AWS News Blog
Introducing Amazon S3 Storage Lens – Organization-wide Visibility Into Object Storage

|
When starting out in the cloud, a customer’s storage requirements might consist of a handful of S3 buckets, but as they grow, migrate more applications and realize the power of the cloud, things can become more complicated. A customer may have tens or even hundreds of accounts and have multiple S3 buckets across numerous AWS Regions. Customers managing these sorts of environments have told us that they find it difficult to understand how storage is used across their organization, optimize their costs, and improve security posture.
Drawing from more than 14 years of experience helping customers optimize their storage, the S3 team has built a new feature called Amazon S3 Storage Lens. This is the first cloud storage analytics solution with support for AWS Organizations to give you organization-wide visibility into object storage, with point-in-time metrics and trend lines as well as actionable recommendations. All these things combined will help you discover anomalies, identify cost efficiencies, and apply data protection best practices across accounts.
With S3 Storage Lens, you can understand, analyze, and optimize storage with 29+ usage and activity metrics and interactive dashboards to aggregate data for your entire organization, specific accounts, regions, buckets, or prefixes. All of this data is accessible in the S3 Management Console or as raw data in an S3 bucket.
Every Customer Gets a Default Dashboard
S3 Storage Lens includes an interactive dashboard which you can find in the S3 console. The dashboard gives you the ability to perform filtering and drill-down into your metrics to really understand how your storage is being used. The metrics are organized into categories like data protection and cost efficiency, to allow you to easily find relevant metrics.
For ease of use all customers receive a default dashboard. If you are like many customers, this maybe the only dashboard that you need, but if you want to, you can make changes. For example, you could configure the dashboard to export the data daily to an S3 bucket for analysis with another tool (Amazon QuickSight, Amazon Athena, Amazon Redshift, etc.) or you could upgrade to receive advanced metrics and recommendations.
Creating a Dashboard
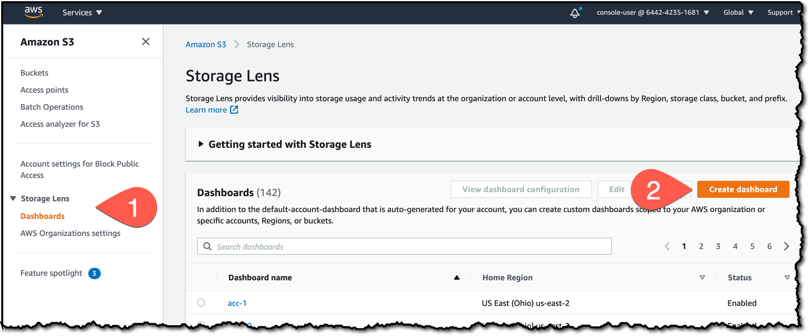
You can also create your own dashboards from scratch, to do this I head over to the S3 console and click on the Dashboards menu item inside the Storage Lens section. Secondly, I click the Create dashboard button.
I give my dashboard the name s3-lens-demo and select a home Region. The home Region is where the metrics data for your dashboard will be stored. I choose to enable the dashboard, meaning that it will be updated daily with new metrics.

A dashboard can analyze storage across accounts, Regions, buckets, and prefix. I choose to include buckets from all accounts in my organization and across all regions in the Dashboard scope section.

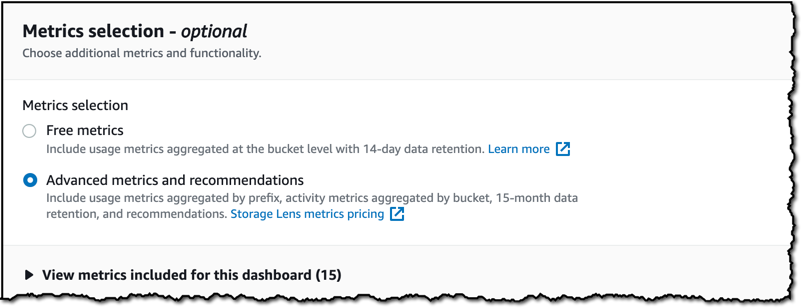
S3 Storage Lens has two tiers: Free Metrics, which is free of charge, automatically available for all S3 customers and contains 15 usage related metrics; and Advanced metrics and recommendations, which has an additional charge, but includes all 29 usage and activity metrics with 15-month data retention, and contextual recommendations. For this demo, I select Advanced metrics and recommendations.
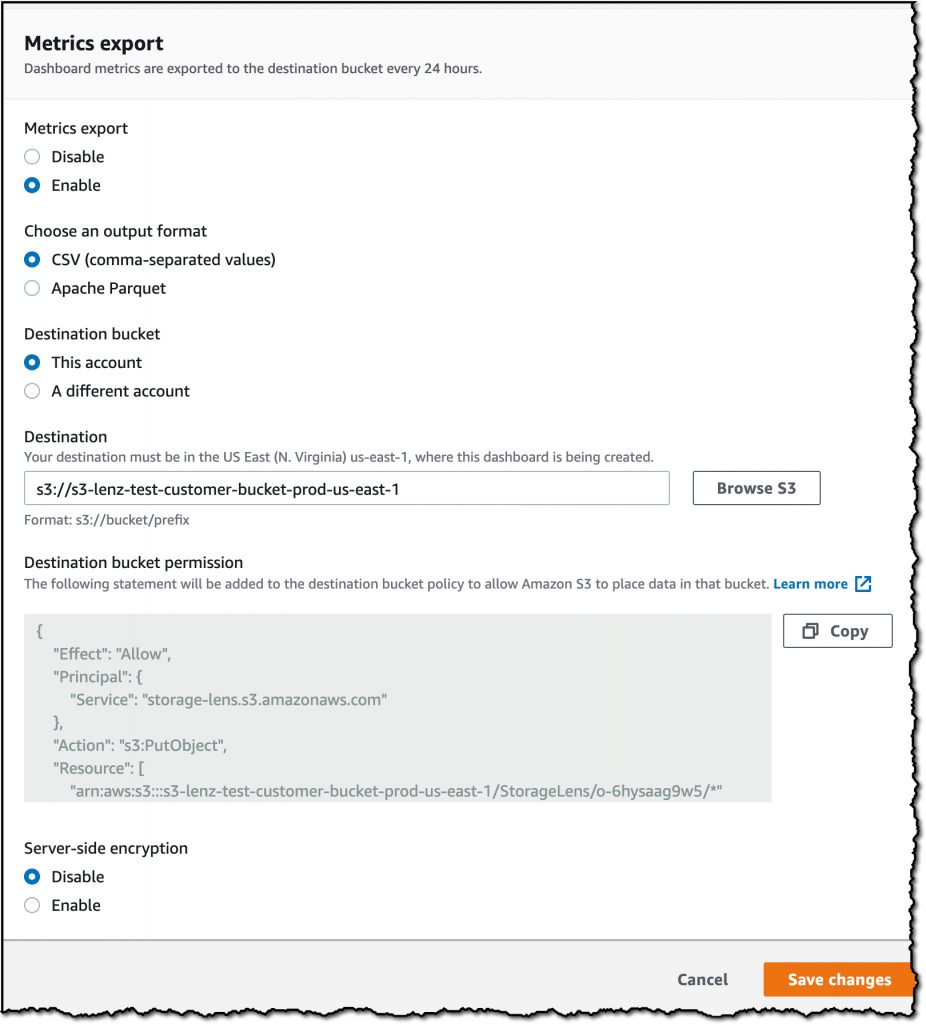
Finally, I can configure the dashboard metrics to be exported daily to a specific S3 bucket. The metrics can be exported to either CSV or Apache Parquet format for further analysis outside of the console.
An alert pops up to tell me that my dashboard has been created, but it can take up to 48 hours to generate my initial metrics.

What does a Dashboard Show?
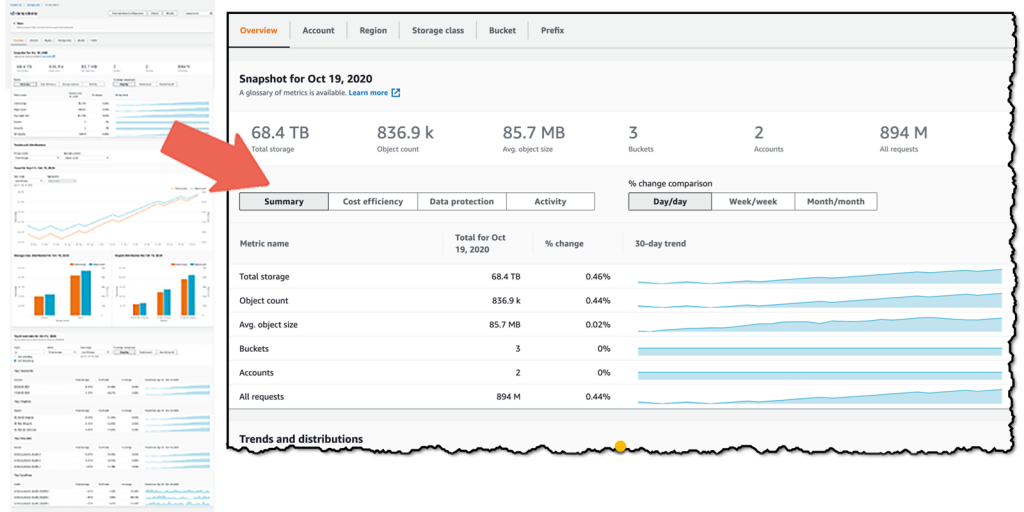
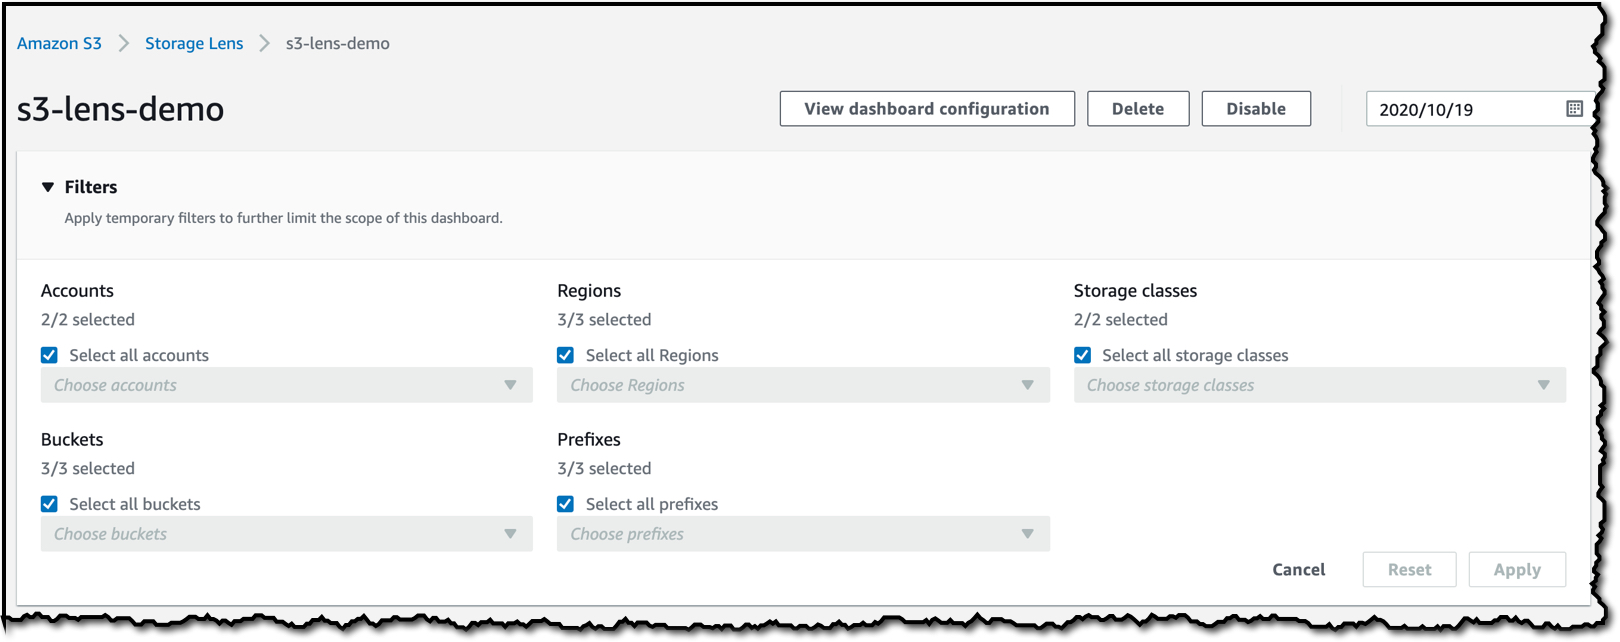
Once my dashboard has been created, I can start to explore the data. I can filter by Accounts, Regions, Storage classes, Buckets, and Prefixes at the top of the dashboard.
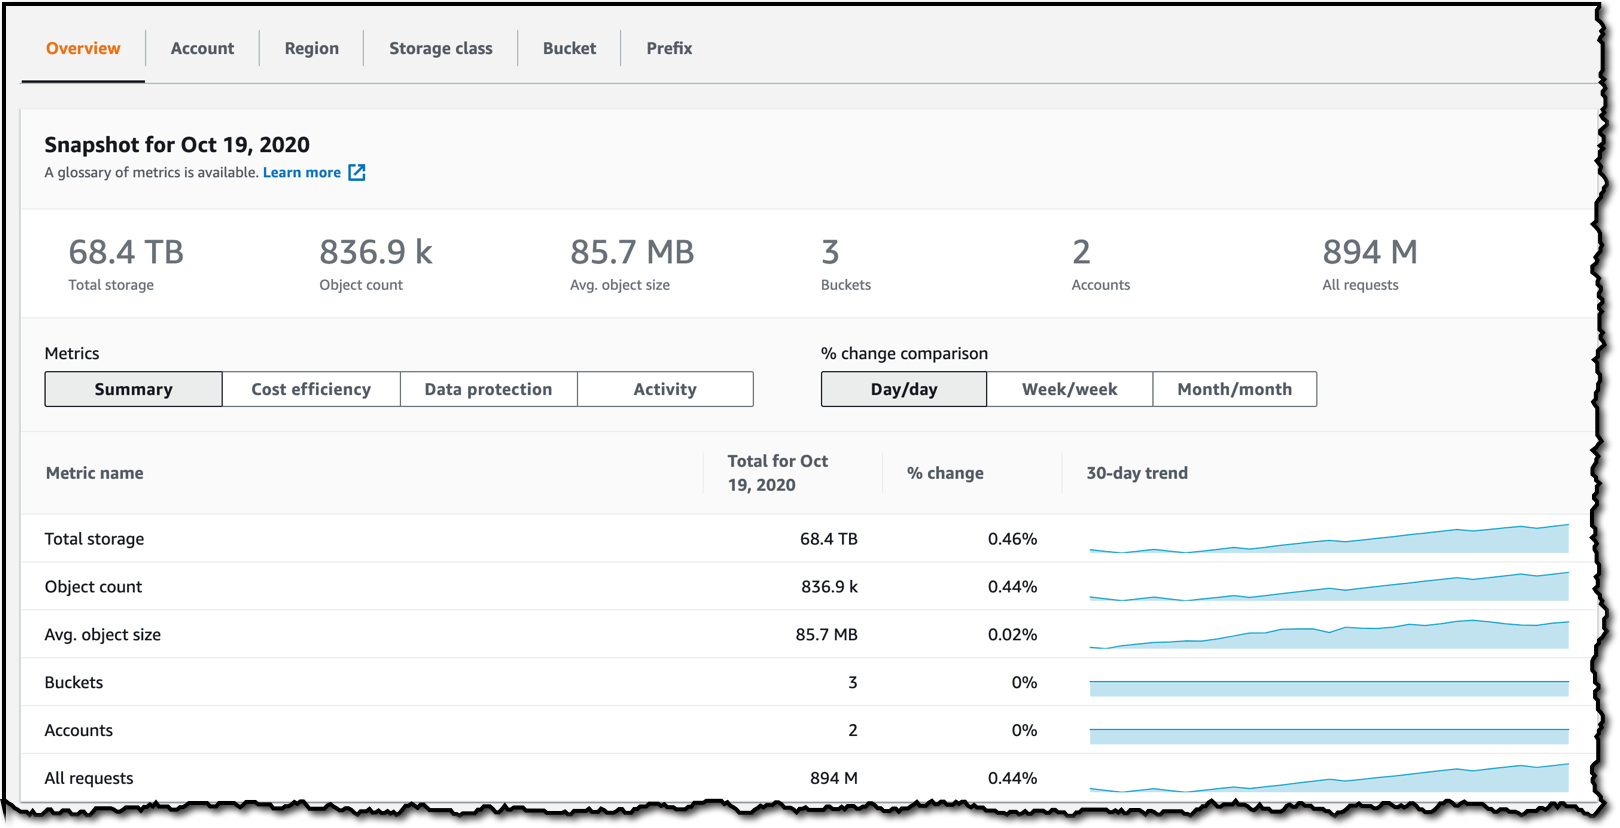
The next section is a snapshot of the metrics such as the Total storage and Object count, and I can see a trendline that shows the trend on each metric over the last 30 days and a percentage change. The number in the % change column shows by default the Day/day percentage change, but I can select to compare by Week/week or Month/month.
I can toggle between different Metric groups by selecting either Summary, Cost efficiency, Data protection, or Activity.
There are some metrics here that are pretty typical like total storage and object counts, and you can already receive these in a few places in the S3 console and in Amazon CloudWatch – but in S3 Storage Lens you can receive these metrics in aggregate across your organization or account, or at the prefix level, which was not previously possible.
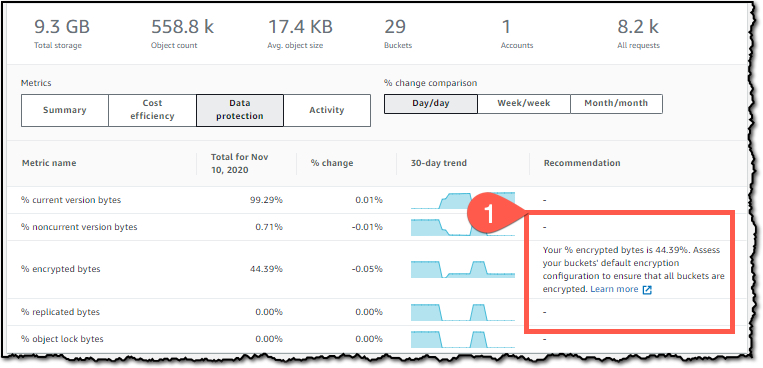
There are some other metrics you might not expect, like metrics that pertain to S3 feature utilization. For example we can break out the % of objects that are using encryption, or the number of objects that are non-current versions. These metrics help you understand how your storage is configured, and allows you to identify discrepancies, and then drill in for details.
The dashboard provides contextual recommendations alongside your metrics to indicate actions you can take based on the metric, for example ways to improve cost efficiency, or apply data protection best practices. Any recommendations are shown in the Recommendation column. A few days ago I took the screenshot below which shows a recommendation on one of my dashboards that suggests I should check my buckets’ default encryption configuration.
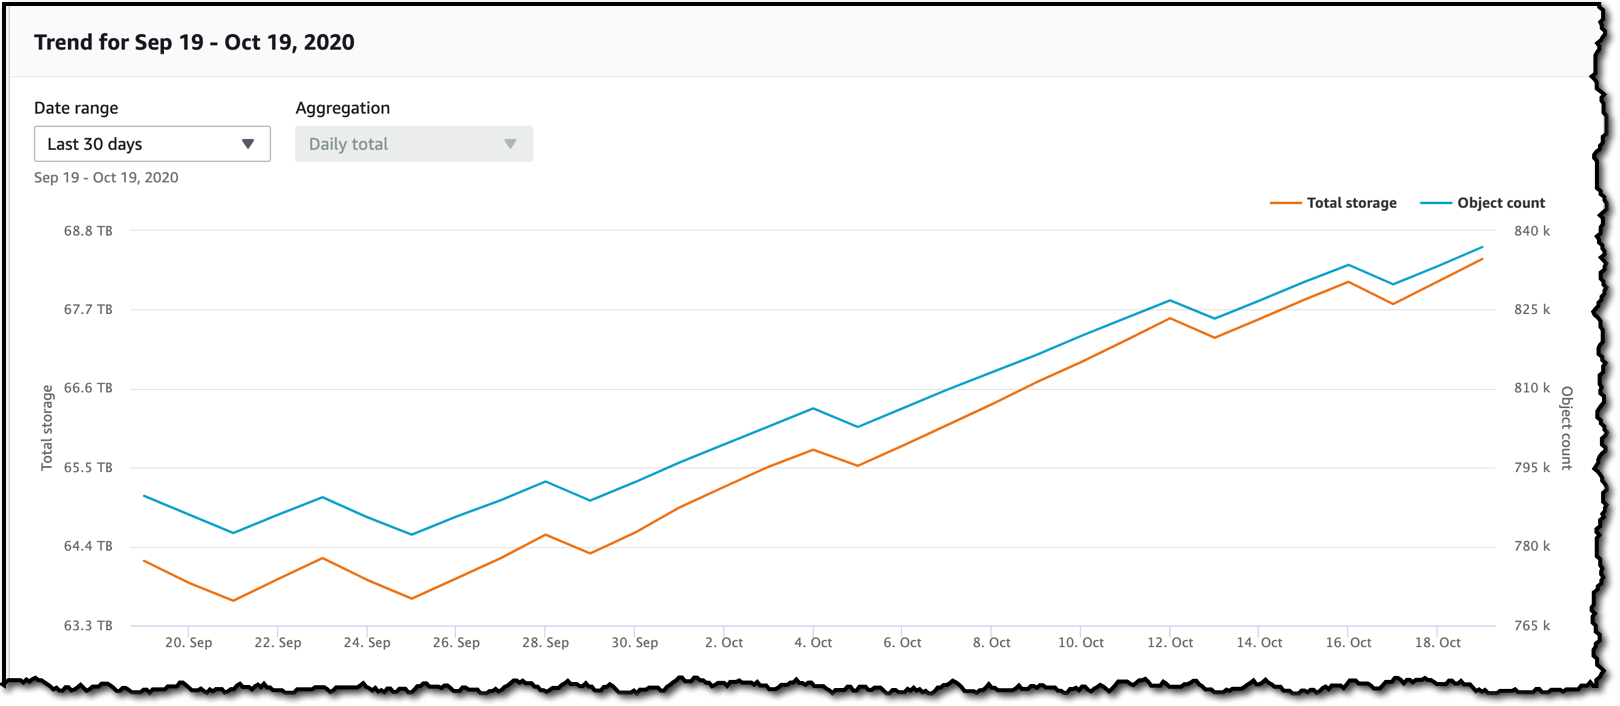
The dashboard trends and distribution section allows me to compare two metrics over time in more detail. Here I have selected Total storage as my Primary metric and Object Count as my Secondary metric.

These two metrics are now plotted on a graph, and I can select a date range to view the trend over time.
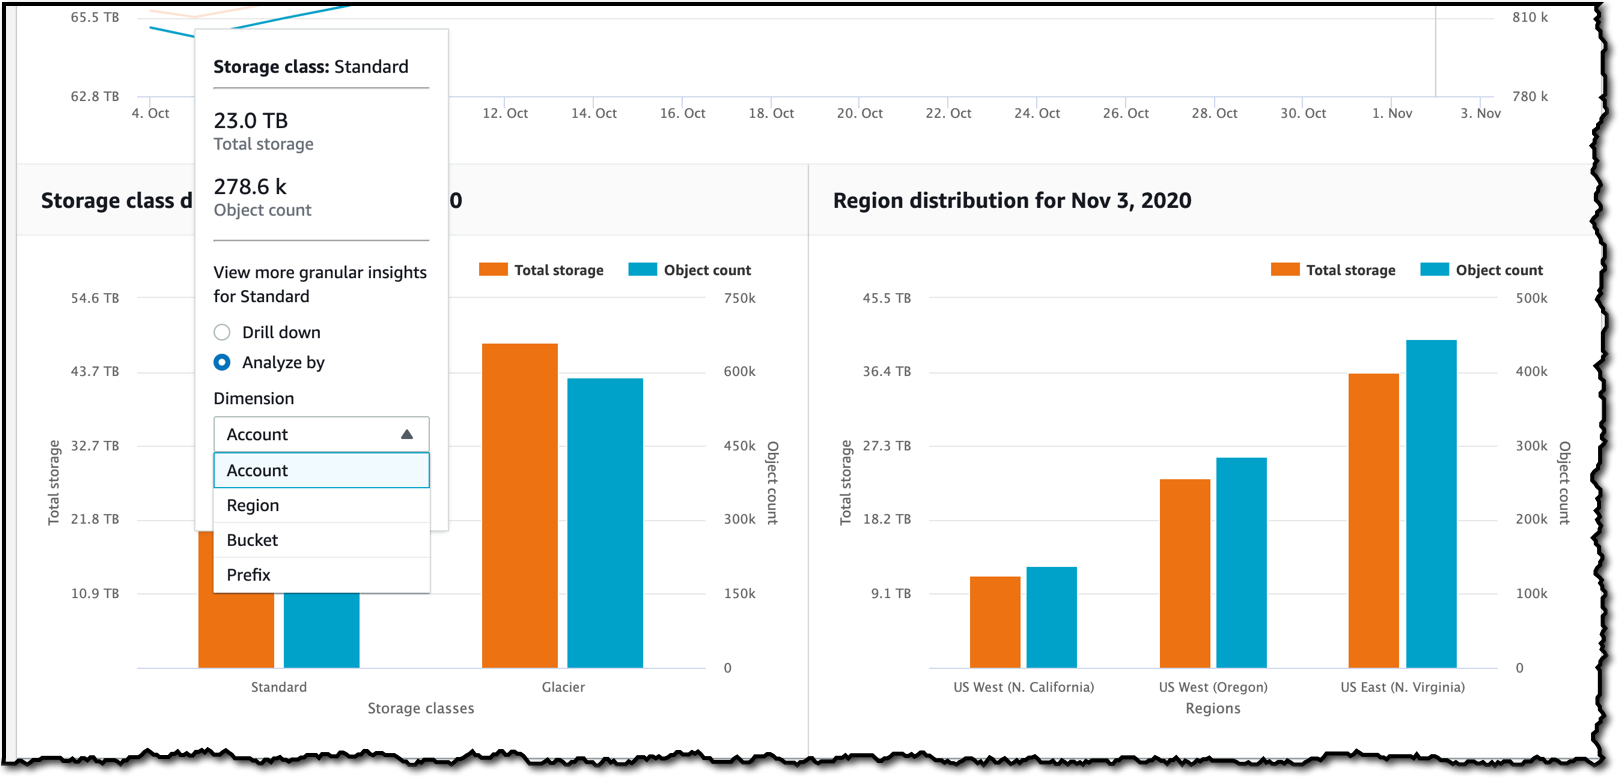
The dashboard also shows me those two metrics and how they are distributed across Storage class and Regions.
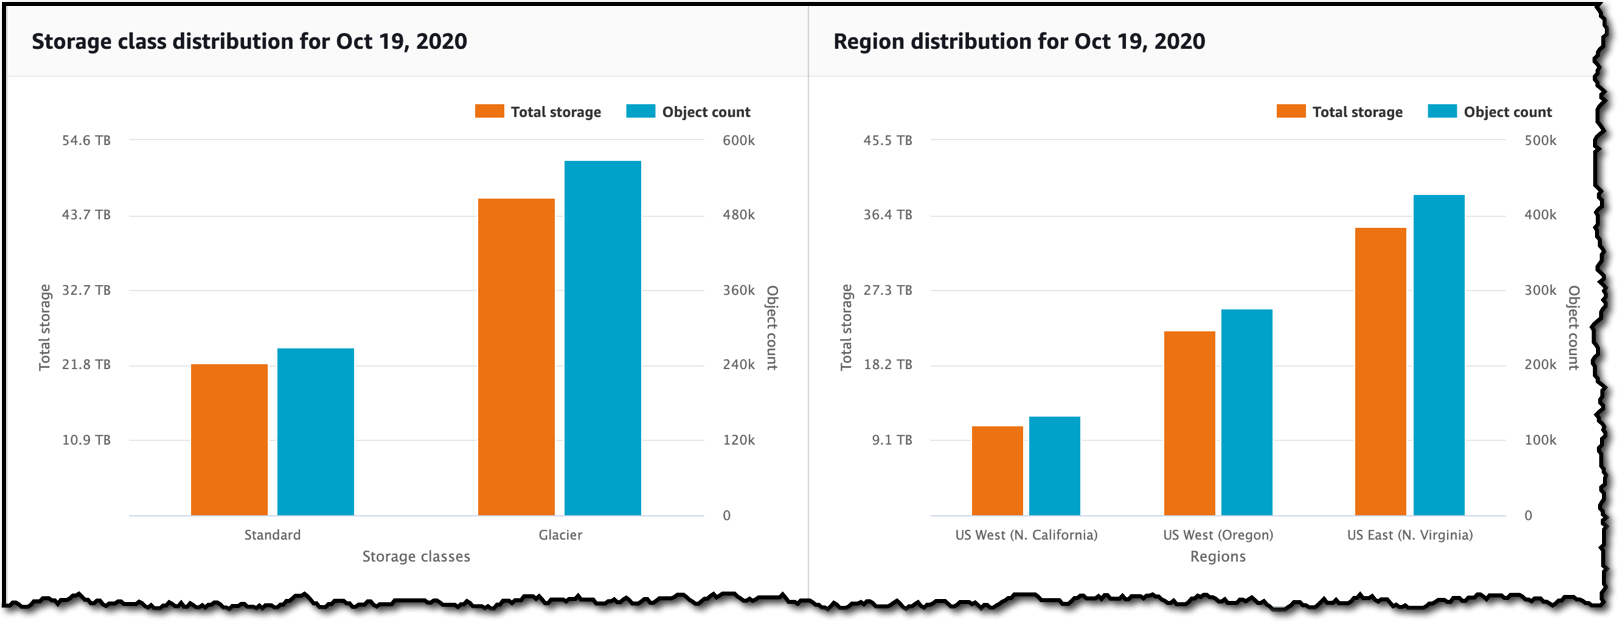
I can click on any value in this graph and Drill down to filter the entire dashboard on that value, or select Anayze by to navigate to a new dashboard view for that dimension.
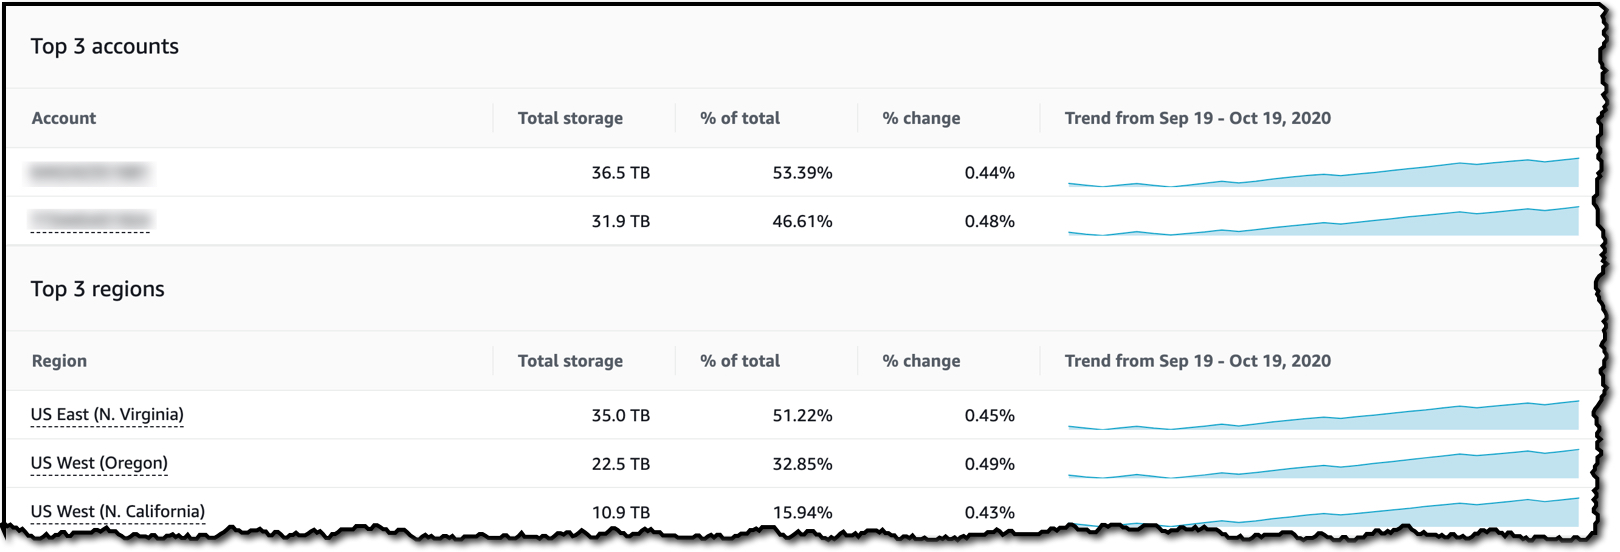
The last section of the dashboard allows me to perform a Top N analysis of a metric over a date range, where N is between 1 and 25. In the example below, I have selected the top 3 items in descending order for the Total storage metric.

I can then see the top three accounts (note: there are only two accounts in my organization) and the Total storage metric for each account.
It also shows the top 3 regions for the Total storage metric, and I can see that 51.15% of my data is stored in US East (N. Virginia)
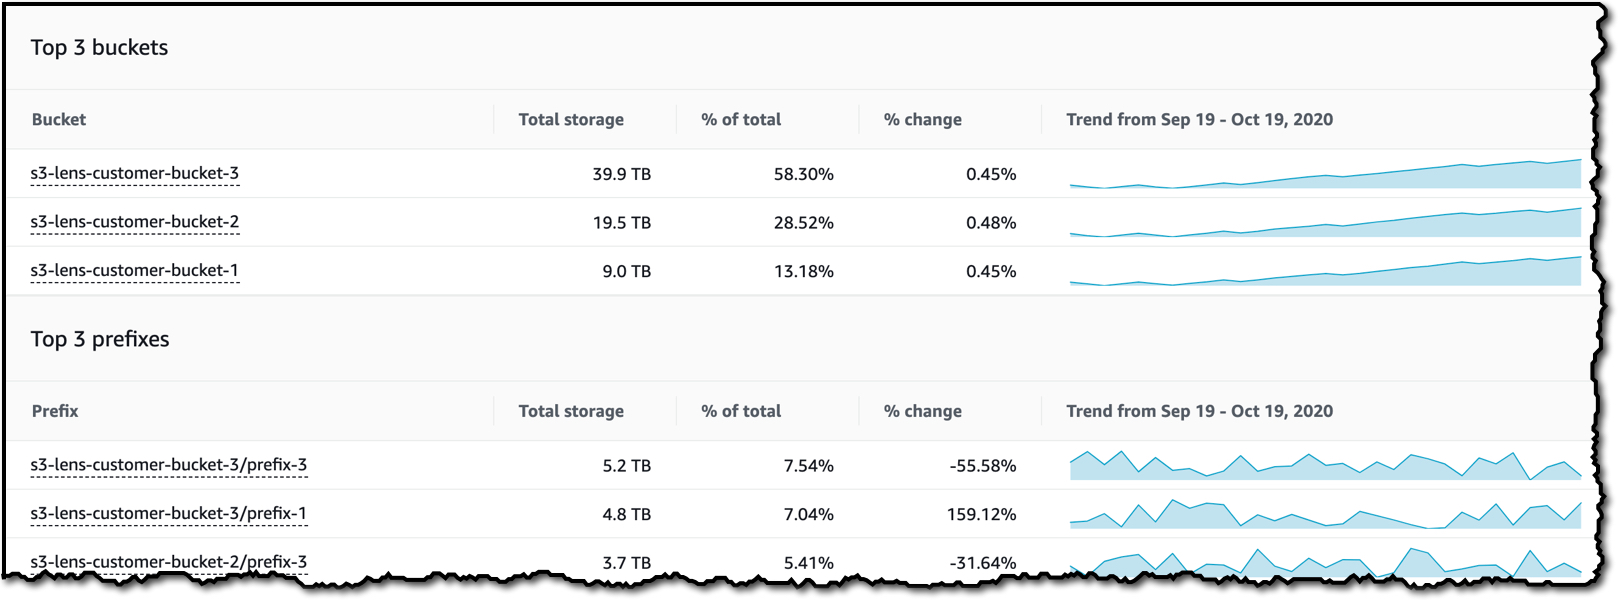
Lastly, the dashboard contains information about the top 3 buckets and prefixes and the associated trends.
As I have shown, S3 Storage Lens delivers more than 29 individual metrics on S3 storage usage and activity for all accounts in your organization. These metrics are available in the S3 console to visualize storage usage and activity trends in a dashboard, with contextual recommendations that make it easy to take immediate action. In addition to the dashboard in the S3 console, you can export metrics in CSV or Parquet format to an S3 bucket of your choice for further analysis with other tools including Amazon QuickSight, Amazon Athena, or Amazon Redshift to name a few.
Video Walkthrough
If you would like a more indepth look at S3 Storage Lens the team have recorded the following video to explain how this new feature works.
Available Now
S3 Storage Lens is available in all commercial AWS Regions. You can use S3 Storage Lens with the Amazon S3 API, CLI, or in the S3 Console. For pricing information, regarding S3 Storage Lens advanced metrics and recommendations, check out the Amazon S3 pricing page. If you’d like to dive a little deeper, then you should check out the documentation or the S3 Storage Lens webpage.
Happy Storing
— Martin