AWS Big Data Blog
Enabling self-service data publication to your data lake using AWS Glue DataBrew
Data lakes have been providing a level of flexibility to organizations unparalleled to anything before them. Having the ability to load and query data in place—and in its natural form—has led to an explosion of data lake deployments that have allowed organizations to accelerate against their data strategy faster than ever before.
Most organizations have a latent demand for business data that already exists within the organization—but is not yet broadly advertised or accessible. Building data lakes with AWS Lake Formation allows you to create an open and portable data platform that allows data consumers (users and applications) to discover and source high-quality and trusted data from across business data domains.
In a typical scenario, a data lake is run and managed by a data team that is responsible for the onboarding of datasets, application and enforcement of business rules (ETL/ELT), and publishing the transformed dataset into a company-wide data catalog for consumption. The following diagram illustrates a typical process flow of how data transmits through a data lake.

In most cases, the data team writes the code and uses platform tools to run the pipeline, including running business logic against the data that is to be shared to the wider organization data users.
The ability for users to self-serve the creation of datasets (such as data owners and business units) for general applicability across the business is an ongoing request for most organizations. If you run a centralized operating model across your data lake, you may require that all data pass through this centralized team or where the facility exists for self-serve data publication, this typically requires a high technical bar to participate in the data onboarding process, which is normally outside the capability of data stewards and owners.
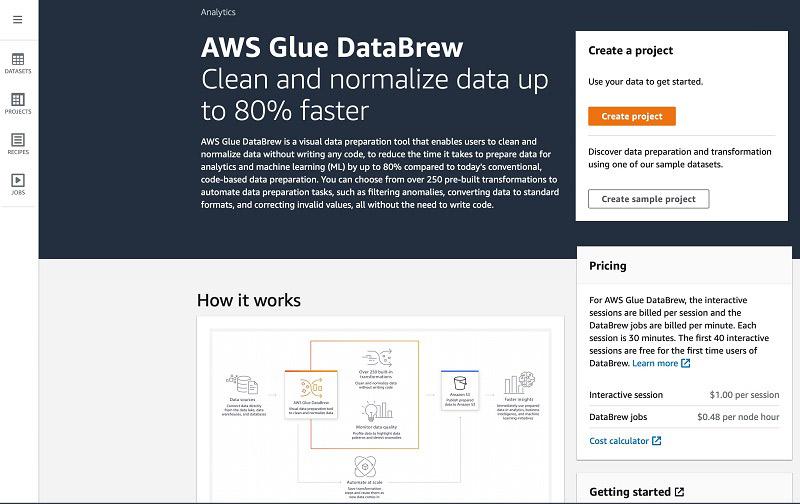
AWS Glue DataBrew is a visual data preparation tool that helps solve some of these challenges by allowing you to inspect datasets and apply transformations against them in a visual and no code way that allows users of all skill sets to participate as part of the data preparation pipeline process. An obvious benefit is data owners and SMEs (subject matter experts) can define and implement data quality and governance checks against their data before publishing it into the data lake.
This accelerates and simplifies the process of producing trusted and quality outputs because the data owners are integrated as part of the onboarding process.
For this post, we discuss a use case of a project team in a consultancy organization that wants to combine first-party data they have acquired against an existing dataset that exists within their data lake.
Overview of solution

The workflow includes the following steps:
Step 1: Create a new AWS Glue DataBrew dataset by uploading a file to, or choosing and existing dataset, from their organization data lake.
Step 2: Create a DataBrew project to load and visually inspect and validate the datasets that you will transform.
Step 3: Using DataBrew, visually transform, augment and define the business rules you want to be applied to your new dataset. (These business rules are called steps, which collectively are called a Recipe)
Step 4: Create a DataBrew job to execute your Rules (Recipe) against the datasets in their entirety.
Step 5: Run a AWS Glue crawler to discover the resulting dataset, publish it to the AWS Glue data catalog and apply a secure permission model to it.
Step 6: Use a preferred analysis or machine learning (ML) tool to browse and consume the data in the Data Catalog based on user permissio
Let’s now go through these steps in a bit more detail.
Creating a project
A project in DataBrew defines two key aspects: the primary dataset you’re working with and the steps you want to run against that dataset to produce a trusted and validated dataset that is specific to your business need.
To create your project, complete the following steps:
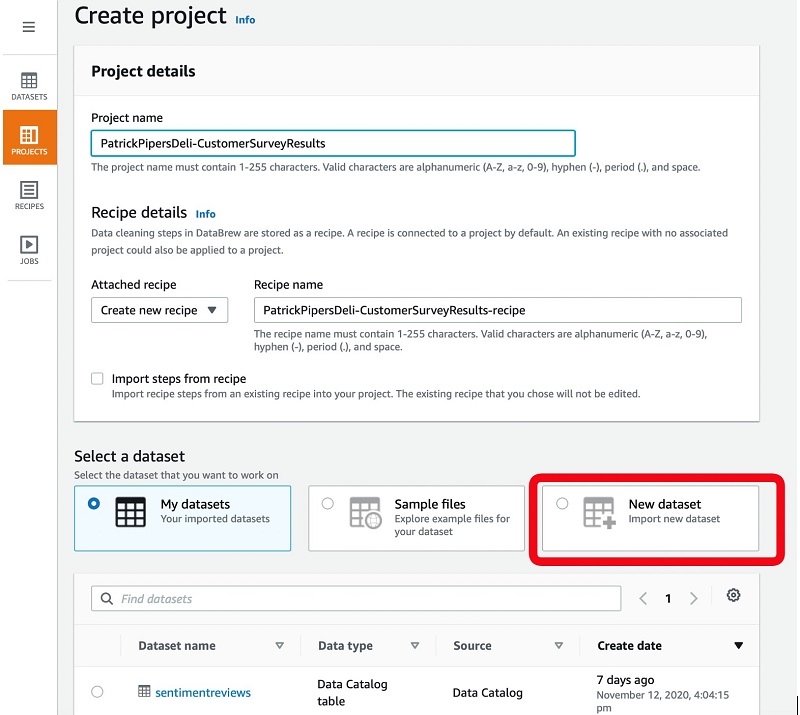
- On the DataBrew console, choose Create project.
- For Project name, enter a name that is representative of the source and intent of the output.
- For Attached recipe, choose Create new recipe.
In subsequent projects with a similar shape of data, you can reuse your recipe of business rules.
You have several options when connecting your dataset. You can upload a new data source (such as a local Excel or JSON file on my computer) or to reuse an existing dataset that exists within your data lake. If you’re sourcing data from the data lake, you can filter by the origin of the source, such as our cloud data warehouse Amazon Redshift, or transactional systems hosted in an Amazon Relation Database Service (Amazon RDS) instance. For more information about copying data into your data lake using AWS Glue, see Which Data Stores Can I Crawl? For this post, I upload a new dataset.
- Select New dataset.
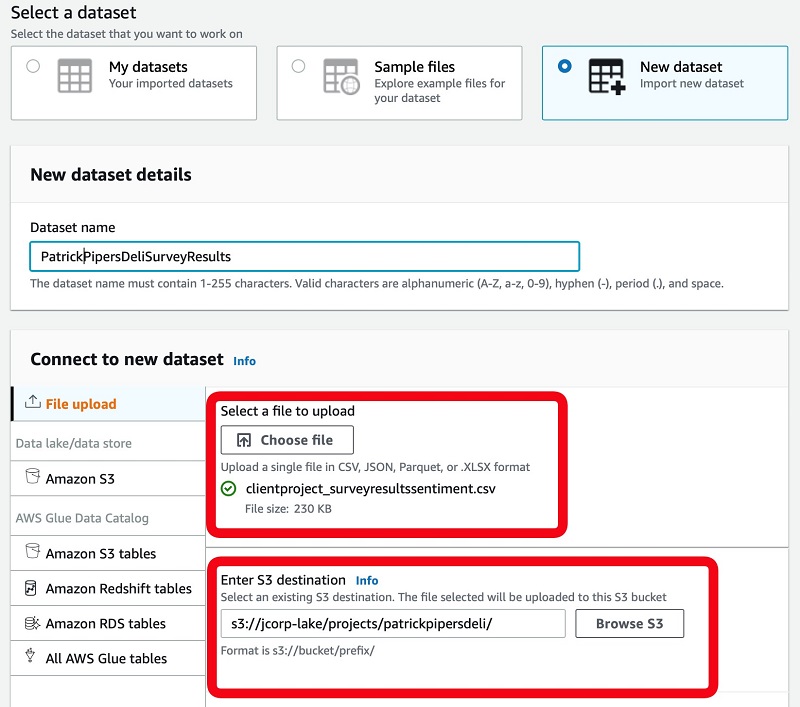
- For Dataset name, enter a name.
- For File upload, choose Choose file.
- Choose the file to upload.
- For Enter S3 destination, enter the location in our data lake where the file is saved to.
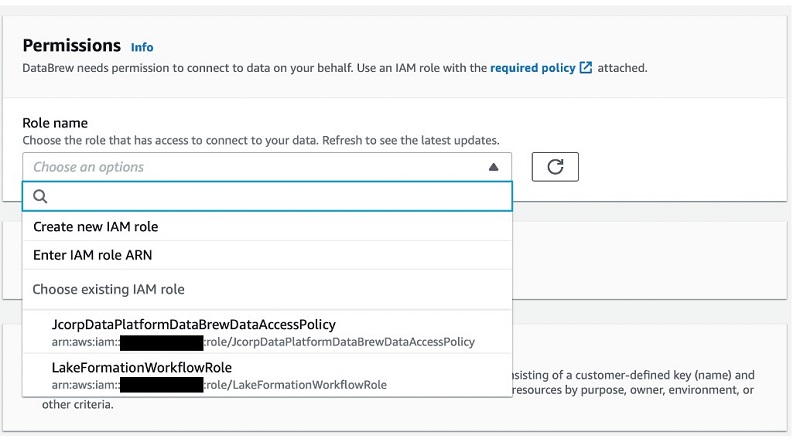
- For Role name, choose a security role that grants access to the data lake location specified.
Typically, this is an area that you have access to that is driven by project or department privileges.
If no role is provided by default, a data platform admin or AWS account admin can create one for you. For more information, see Identity-based policy examples for AWS Glue DataBrew.
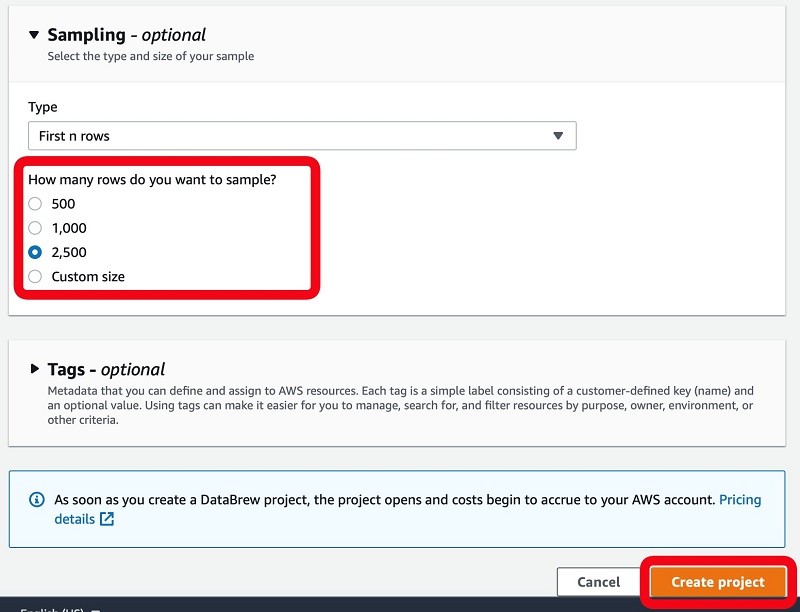
- Optionally, modify the sample size of the data to inspect.
- Choose Create project.
Analyzing and transforming your dataset
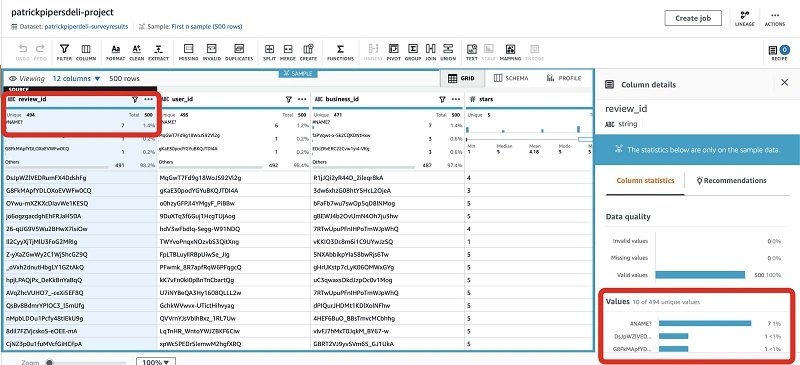
With a project created, I can load a sample of my dataset in a familiar tabular grid view and start to explore the data in greater detail.
This view allows for quick inspection of the data and the ability to run some sample and survey methods to determine if the data being viewed has statistical significance to our project. This way, we can make sure we’re making informed, data-driven decisions on behalf of our clients.
The following screenshot shows that the review_id column has duplicate values.
To maintain integrity and trust of the output, I can remove the duplicate rows as a step by choosing Duplicates and Remove duplicates in column.
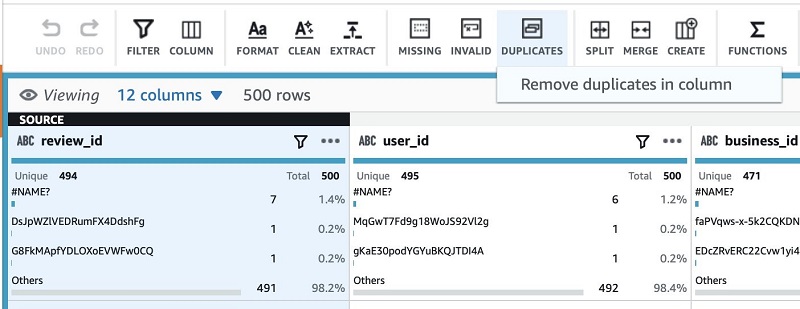
This adds a new step to my recipe, which is enforced on this column type whenever it runs. DataBrew shows a preview of the change before you apply the changes.
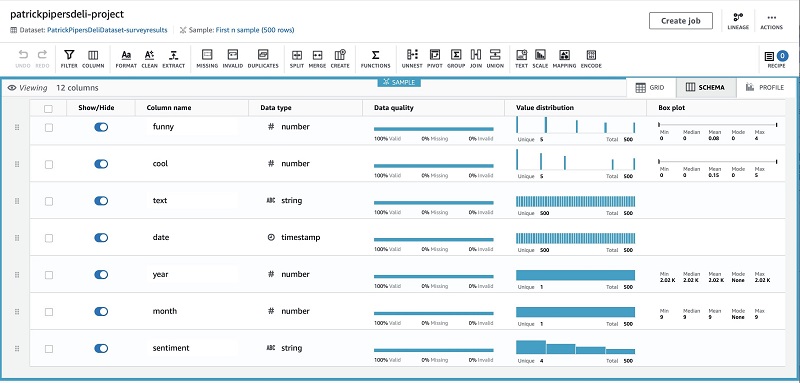
If I want to dig deeper into the shape and validity of my data, I can simply choose the Schema tab to get a coalesced view of the data, or create a data profile job on the Profile tab to get further insights, such as correlations across column types.
The rest of the data looks good, so I now complete the rest of my transformation functions:
- Clean the survey result summary text by removing invalid characters and quotes, and enforcing sentence casing.
- For downstream ML tasks, apply a hot encode function to the text value of a customer’s sentiment (categorical variable) to that of an integer value (binary vector).
- Join to a company dataset that contains our customer data so I can bring in identifiable information of the locations surveyed.
- Hide columns not require for the final output.
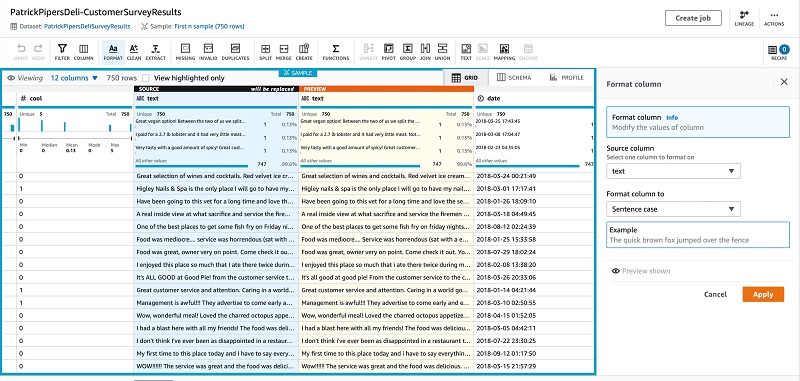
Cleaning the summary text
We first clean the survey result summary text by removing invalid characters and quotes, and enforce sentence casing.
- Choose Format.
- Choose Change to sentence casing.
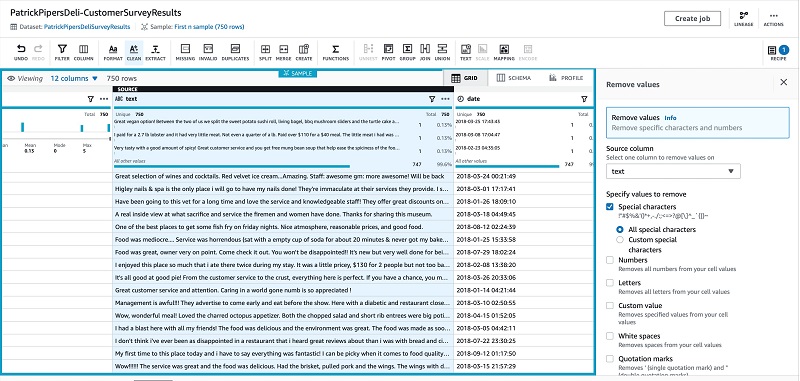
- On the recipe bar, choose Clean.
- For Specify values to remove, select Special characters.
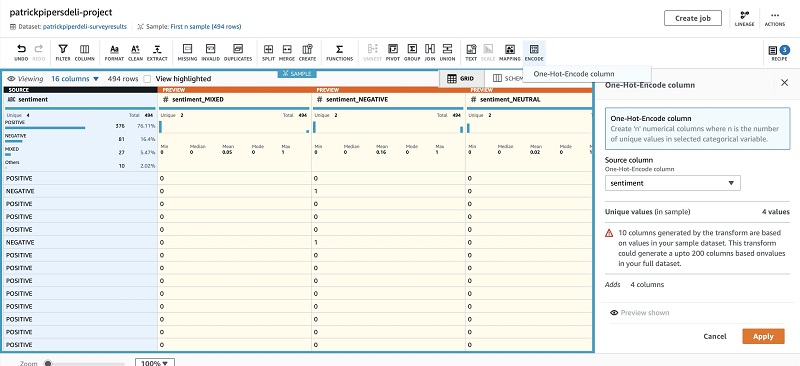
Applying a hot encode function
Next, apply a hot encode function to the categorical variable (sentiment) to a binary vector for downstream ML purposes.
- Choose Encode.
- Choose One-Hot-Encode column.
- Choose your source column.
- Choose Apply.
Joining and enriching our dataset
We now join our dataset against a primary customer dataset so we can enrich our dataset with additional columns of value.
The initial dataset we created contains a number of key data elements, such as a review rating, customer comments, associated sentiment rating, a number of ordinal values specifying the value of the review, emotional attributes from the interviewee, and various restaurant and location identifiers.
As part of our full analysis, we want to reference the additional data elements associated with these restaurant and location identifiers so we can form a complete view of the data.
DataBrew makes this enrichment task easy by letting you join to an additional company dataset that exists within your data lake. In the following steps, I choose to bring across only those columns that I require by deselecting those that are not required. (This existing dataset contains additional data of businesses that are part of the wider survey group.)
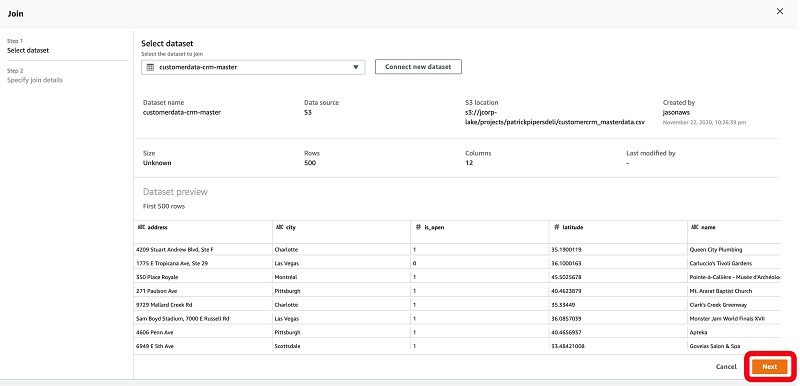
- On the recipe menu bar, choose Join.
- Choose Dataset join.
- For Select dataset, choose the dataset to join against.
The page displays a summary view for inspection.
- Choose Next.
For this post, we perform a left join to ensure that we’re only bring in matching records against our own dataset (Table A) from the paired dataset (Table B).
- Choose the columns between both tables that we want to match against (for this post,
business_id). - Select the columns from the joined table to include in our dataset.
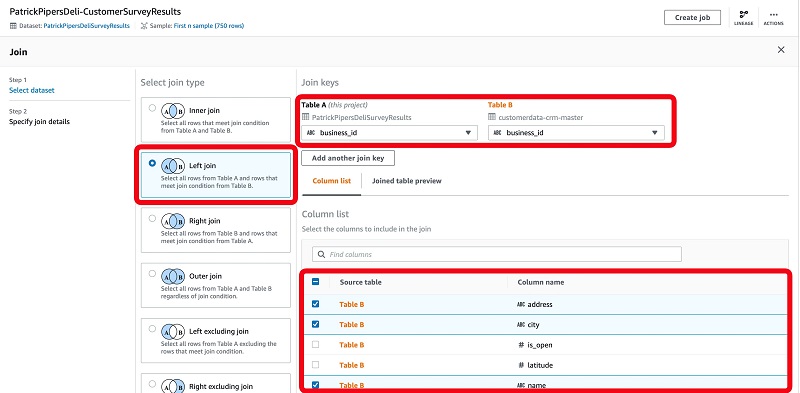
- Choose Finish.
When this step is complete, we have a complete dataset that is applicable towards our final requirements for analysis.
Removing unnecessary columns
Finally, remove columns not required for the final dataset and change the column names.
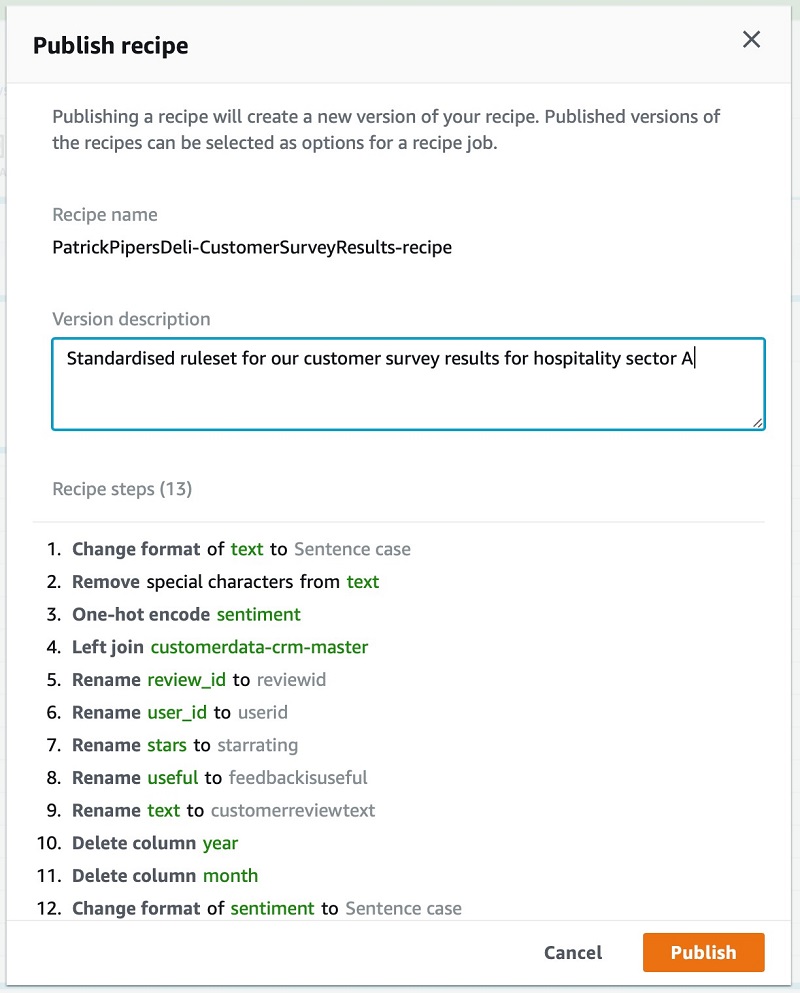
At the conclusion of our data preparation, we can see the number and types of steps we have run.
For similar datasets, you can choose Publish in the Recipe pane to reuse this recipe and enforce the steps taken instead of having to complete the steps again. This allows you to build up your own repository of recipes that you can replay against various datasets to ensure a consistent level of data quality and outputs.

You then provide a description and publish the recipe for broader accessibility.
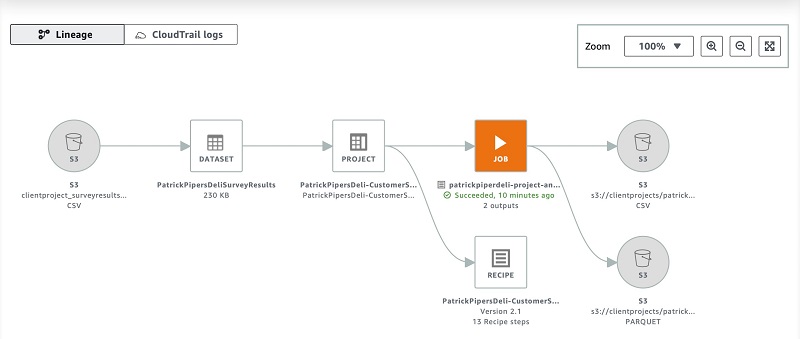
As a final validation step before publishing my dataset, I can choose to visually inspect the data lineage to confirm my sources selected are as intended and to confirm the size of my datasets to process.
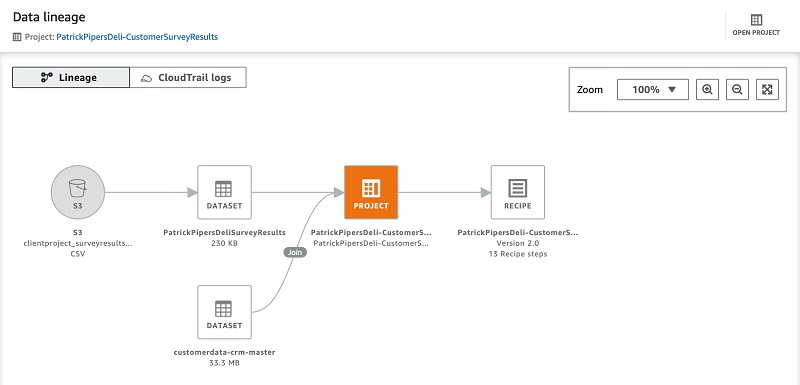
For this post, I can confirm that the source and datasets are correct and the recipe being created has the expected number of steps. The data lineage view is useful for when you’re reading unfamiliar data sources because it allows you to understand the origins and transformations that have taken place beforehand.
Creating a job to publish your dataset
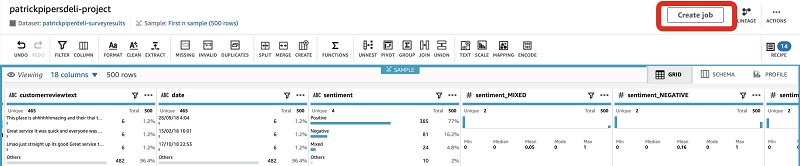
Now we have our dataset defined and validated by way of the visual steps we created in our recipe. It’s time to create a job that runs them against the entirety of our dataset. The output is saved back into an area of our data lake for additional processing, leading to publication within our Data Catalog.
- Choose Create job.
- For Job name, enter a name.
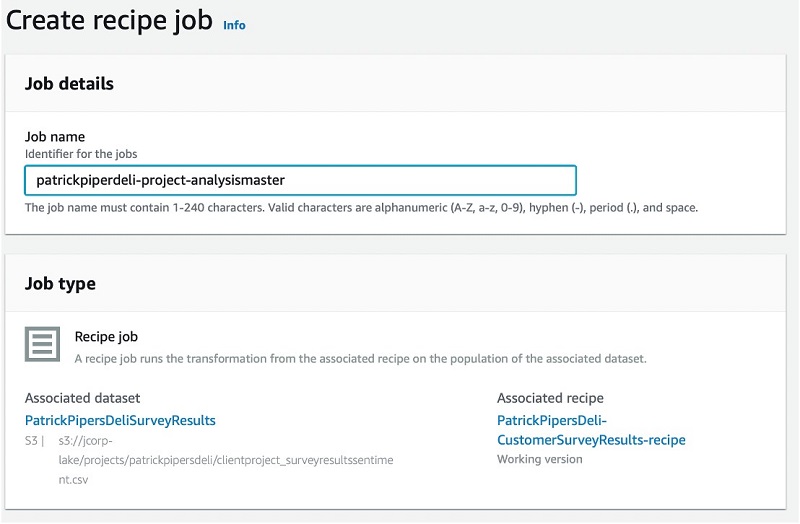
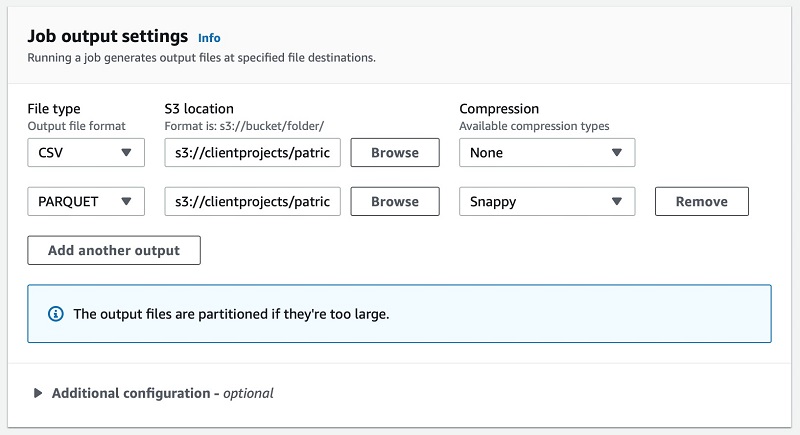
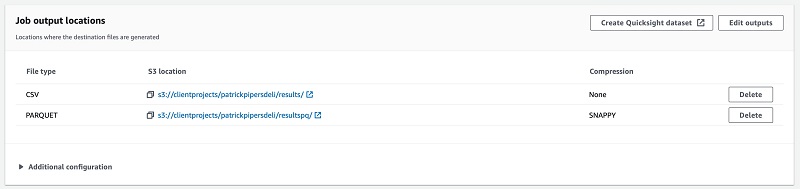
- In the Job output settings section, specify the data lake location where the final output is saved to.
If required, we can optionally choose a file format for the dataset. If you have multiple requirements for different file formats, you can simply choose to save multiple outputs by choosing Add another output and specifying the details. For this post, I opt to save the output in two formats: one in CSV and another in the optimized open file format Apache Parquet.
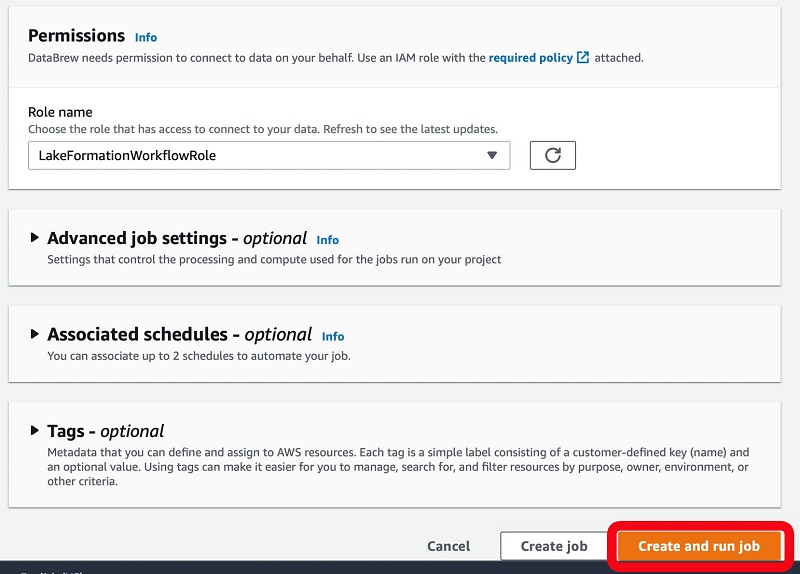
- For Role name, choose the security role that has access to our client project folder to make sure DataBrew has permission to save the dataset to the location specified.
The role that you choose here is different than the DataBrew role you chose when creating the project. Each role serves a different purpose. For this post, we choose a role that has permissions to read, run, and save the resulting files into data lake locations (as governed by the role) of which I have been delegated rights to access and save data to.
- Choose Create and run job.
The project is now visible on the main page, detailing the recipe used against the dataset and the job name.
style=”margin: 20px 0px 20px 0px; border: 1px solid #CCCCCC;”
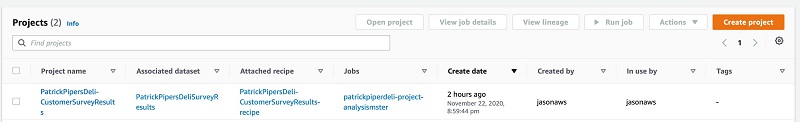
To view details about the job run and inspect completion details, choose the value in the Jobs column.

To see additional details about the history of the job, choose the job name.
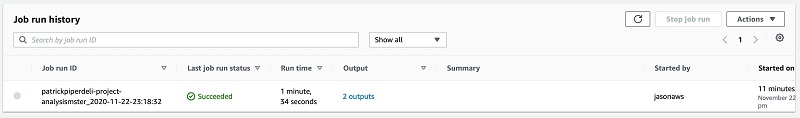
The output provides details of the job.
The lineage view shows the end-to-end process of all input files, transformation steps, and final output locations.
Consuming your dataset
After you save the new dataset to your data lake, we can use AWS Glue to crawl the new dataset and publish it to our Data Catalog. For more information, see Populating the AWS Glue Data Catalog. After the data is indexed, it’s available and visible through AWS Glue and Lake Formation.
Crawling the output files from DataBrew
To crawl the output files and publish them to our Data Catalog, complete the following steps:
- On the AWS Glue console, choose Crawlers.
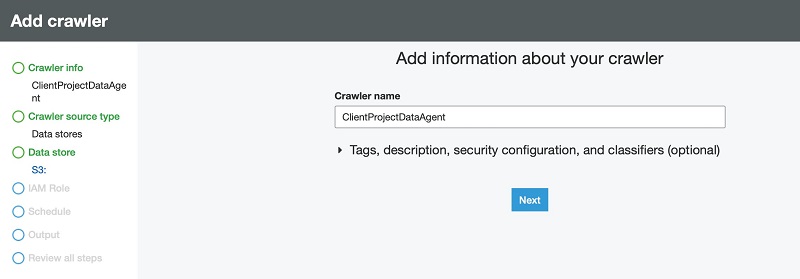
- Choose Add crawler.
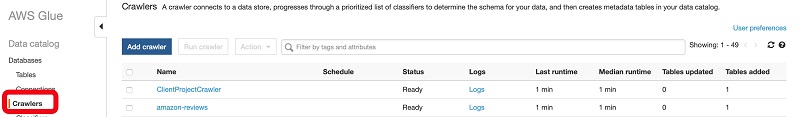
- For Crawler name, enter a name.
- Choose Next.
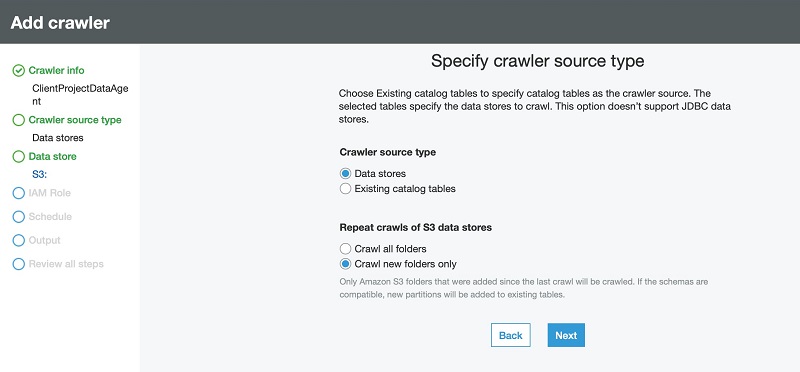
- For Crawler source type, select Data stores.
- For Repeat crawls of S3 data stores, select Crawl new folders only.
- Choose Next.
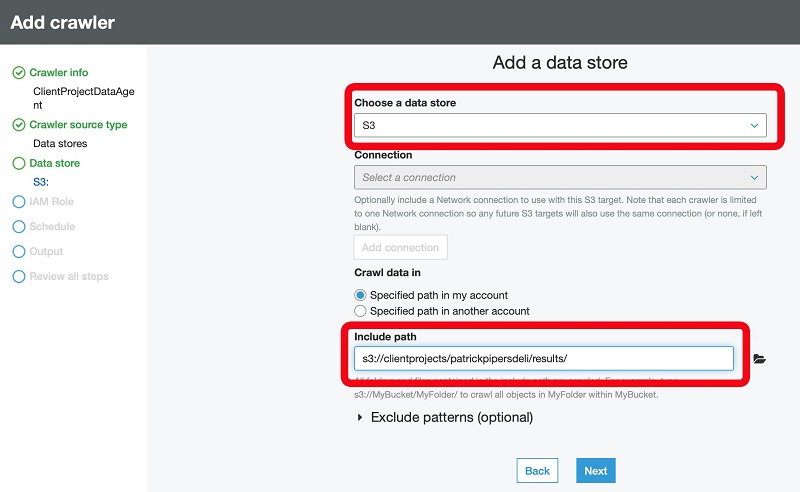
- For Choose a data store, choose S3.
- For Crawl data in, select Specified path in my account.
- For Include path, enter the path of the DataBrew output files.
- Choose Next.
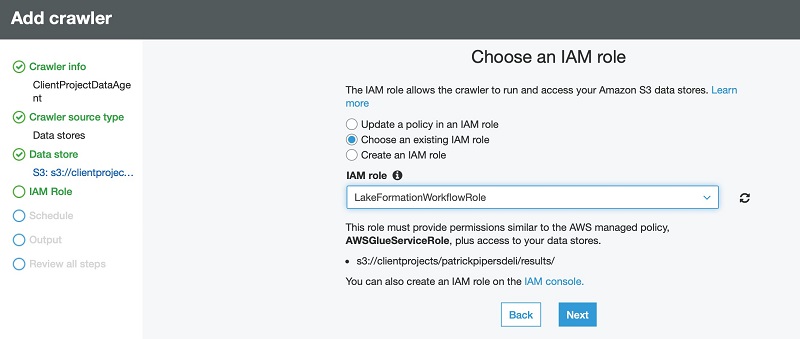
- Select Choose an existing IAM role.
- For IAM role, choose or create a role that has access to the location of your DataBrew output.
If you don’t have such a role, your data platform admin can set one up for you.
- Choose Next.
- For Frequency, specify how often the crawler should check for new output files. For this post, we choose Run on demand.
This normally aligns with the schedule you have set up in DataBrew.

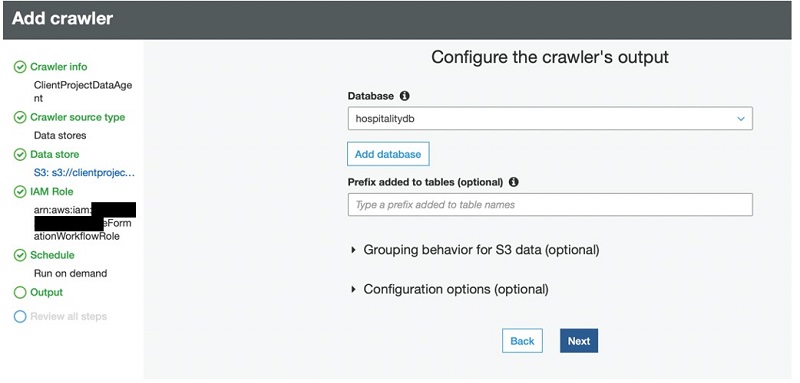
- Choose Next.
- For Database, choose (or create) a database to publish the business view of your output files.
The crawler creates one or more data tables that users can browse and, if permissions allow, run select queries against.
- Choose Next.
- Review the summary page and choose Finish.
- Select your crawler and choose Run crawler.
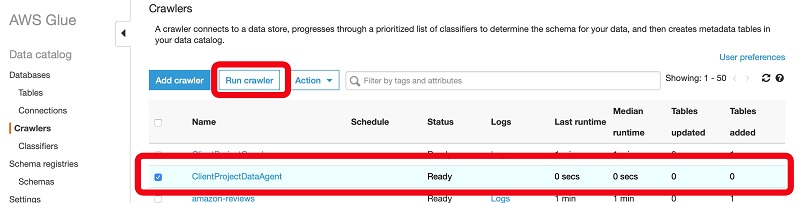
When the crawler is complete, it details the number of tables it created and the time it took to discover and index your output dataset. The next step is to view and set up permissions in the Data Catalog.
Publishing and securing your DataBrew output files
In this post, we use the Lake Formation security and permission model enforced for data consumers using supported services. For more information, see Security and Access Control to Metadata and Data in Lake Formation.
- On the Lake Formation console, under Data catalog, choose Databases.
- Enter the database name you used when you created the crawler earlier (for this post,
hospitalitydb).
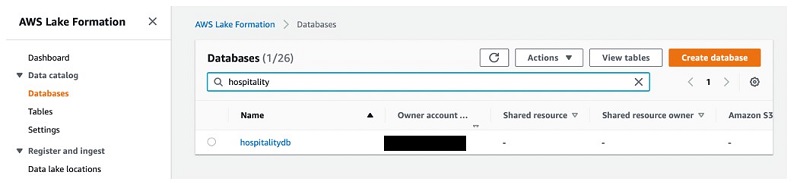
- Select the database and choose View tables.
We can see that a table called results was created in this database.

We can do several things, such as grant or revoke items from the Actions menu, or choose the table name to inspect the schema.
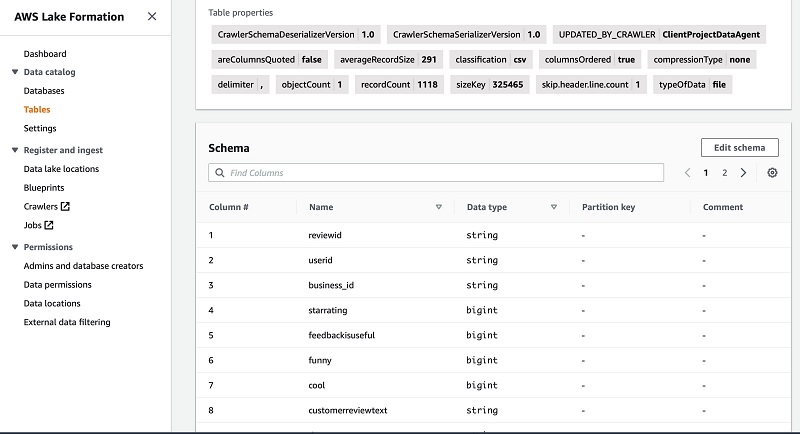
As a data owner, I grant an analyst with the username lfanalyst select permissions to my dataset, and restrict access to only a limited set of columns. For this post, I exclude the userid and reviewid columns.
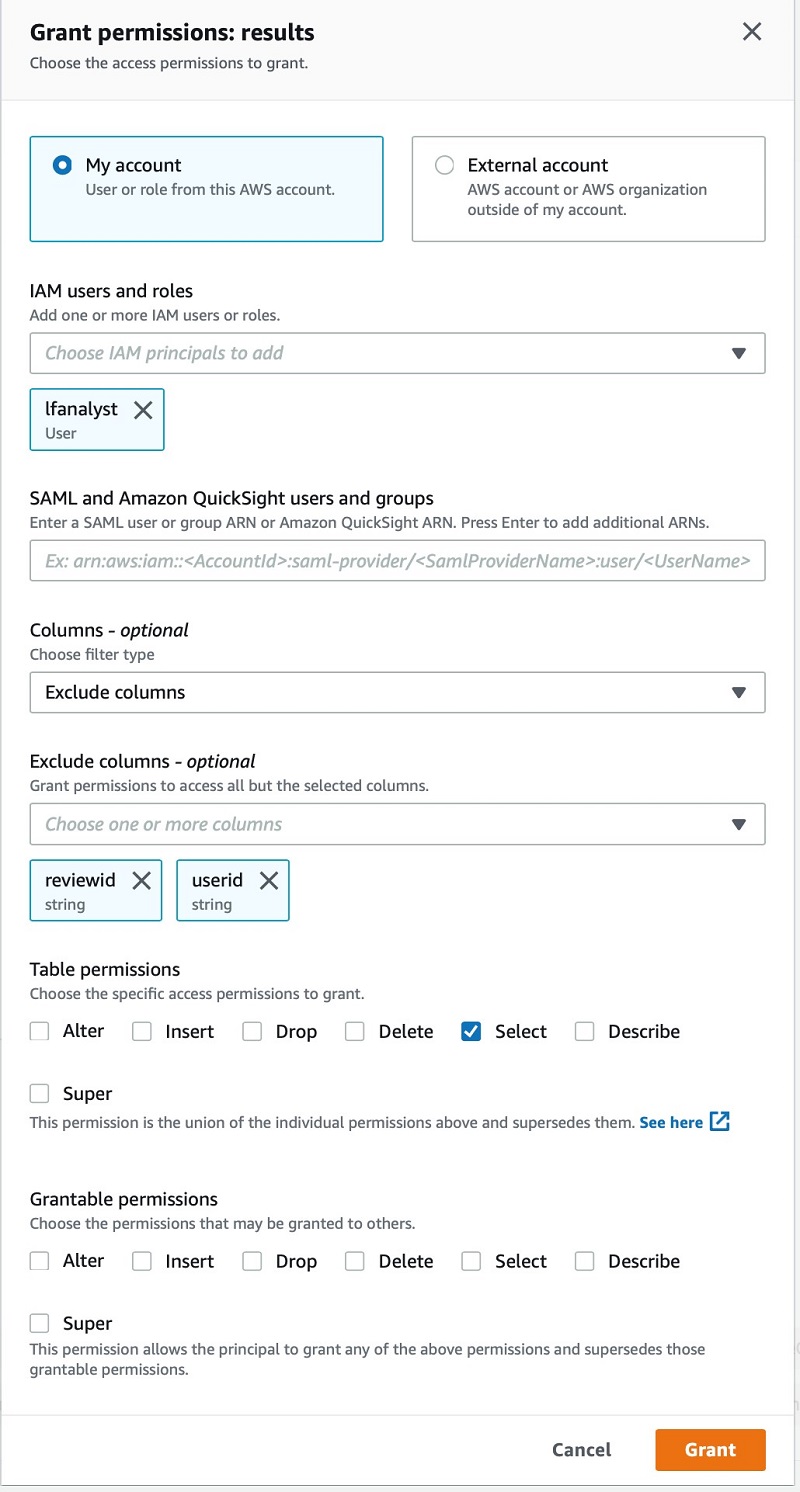
After I save this change, I can let the analyst know that they have access to my survey results.
Consumption access to DataBrew output files
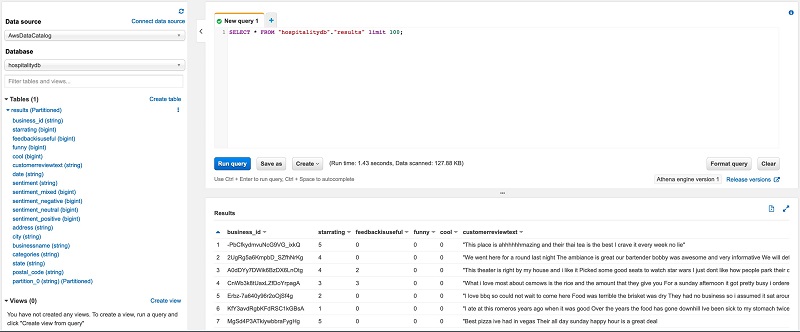
The analyst user who has been granted limited access to this dataset can query the data using Amazon Athena, either via the console or external analytical tools that support the JDBC or ODBC drivers it provides.
If using the console, the analyst can choose the database hospitalitydb to view the results table.

If the analyst expands the results table to view the columns, userid and reviewid aren’t present.
The following screenshot shows the results of a SQL statement to browse a sample of the dataset.
Conclusion
DataBrew makes it easy for data owners, analysts, and data SMEs to easily curate and publish data of value to their organization data lake in a self-service manner.
This visual interface, combined with ML assistance to help you better understand and validate your data, allows all types of users to easily create, consume, and publish data into an organization’s data lake in a visual, no code, or low code way while working within an existing centralized governance model.
About the Author
 Jason Hunter is a Principal Solutions Architect at AWS with a focus on Big Data & Analytics solutions. With over 20 years of experience in information technology, he helps customers architect and build highly scalable, secure and performant cloud-based data platforms, accelerating their journey to become more data driven.