AWS Big Data Blog
Modernize a legacy real-time analytics application with Amazon Managed Service for Apache Flink
Organizations with legacy, on-premises, near-real-time analytics solutions typically rely on self-managed relational databases as their data store for analytics workloads. To reap the benefits of cloud computing, like increased agility and just-in-time provisioning of resources, organizations are migrating their legacy analytics applications to AWS. The lift and shift migration approach is limited in its ability to transform businesses because it relies on outdated, legacy technologies and architectures that limit flexibility and slow down productivity. In this post, we discuss ways to modernize your legacy, on-premises, real-time analytics architecture to build serverless data analytics solutions on AWS using Amazon Managed Service for Apache Flink.
Near-real-time streaming analytics captures the value of operational data and metrics to provide new insights to create business opportunities. In this post, we discuss challenges with relational databases when used for real-time analytics and ways to mitigate them by modernizing the architecture with serverless AWS solutions. We introduce you to Amazon Managed Service for Apache Flink Studio and get started querying streaming data interactively using Amazon Kinesis Data Streams.
Solution overview
In this post, we walk through a call center analytics solution that provides insights into the call center’s performance in near-real time through metrics that determine agent efficiency in handling calls in the queue. Key performance indicators (KPIs) of interest for a call center from a near-real-time platform could be calls waiting in the queue, highlighted in a performance dashboard within a few seconds of data ingestion from call center streams. These metrics help agents improve their call handle time and also reallocate agents across organizations to handle pending calls in the queue.
Traditionally, such a legacy call center analytics platform would be built on a relational database that stores data from streaming sources. Data transformations through stored procedures and use of materialized views to curate datasets and generate insights is a known pattern with relational databases. However, as data loses its relevance with time, transformations in a near-real-time analytics platform need only the latest data from the streams to generate insights. This may require frequent truncation in certain tables to retain only the latest stream of events. Also, the need to derive near-real-time insights within seconds requires frequent materialized view refreshes in this traditional relational database approach. Frequent materialized view refreshes on top of constantly changing base tables due to streamed data can lead to snapshot isolation errors. Also, a data model that allows table truncations at a regular frequency (for example, every 15 seconds) to store only relevant data in tables can cause locking and performance issues.
The following diagram provides the high-level architecture of a legacy call center analytics platform. In this traditional architecture, a relational database is used to store data from streaming data sources. Datasets used for generating insights are curated using materialized views inside the database and published for business intelligence (BI) reporting.

Modernizing this traditional database-driven architecture in the AWS Cloud allows you to use sophisticated streaming technologies like Amazon Managed Service for Apache Flink, which are built to transform and analyze streaming data in real time. With Amazon Managed Service for Apache Flink, you can gain actionable insights from streaming data with serverless, fully managed Apache Flink. You can use Amazon Managed Service for Apache Flink to quickly build end-to-end stream processing applications and process data continuously, getting insights in seconds or minutes. With Amazon Managed Service for Apache Flink, you can use Apache Flink code or Flink SQL to continuously generate time-series analytics over time windows and perform sophisticated joins across streams.
The following architecture diagram illustrates how a legacy call center analytics platform running on databases can be modernized to run on the AWS Cloud using Amazon Managed Service for Apache Flink. It shows a call center streaming data source that sends the latest call center feed in every 15 seconds. The second streaming data source constitutes metadata information about the call center organization and agents that gets refreshed throughout the day. You can perform sophisticated joins over these streaming datasets and create views on top of it using Amazon Managed Service for Apache Flink to generate KPIs required for the business using Amazon OpenSearch Service. You can analyze streaming data interactively using managed Apache Zeppelin notebooks with Amazon Managed Service for Apache Flink Studio in near-real time. The near-real-time insights can then be visualized as a performance dashboard using OpenSearch Dashboards.

In this post, you perform the following high-level implementation steps:
- Ingest data from streaming data sources to Kinesis Data Streams.
- Use managed Apache Zeppelin notebooks with Amazon Managed Service for Apache Flink Studio to transform the stream data within seconds of data ingestion.
- Visualize KPIs of call center performance in near-real time through OpenSearch Dashboards.
Prerequisites
This post requires you to set up the Amazon Kinesis Data Generator (KDG) to send data to a Kinesis data stream using an AWS CloudFormation template. For the template and setup information, refer to Test Your Streaming Data Solution with the New Amazon Kinesis Data Generator.
We use two datasets in this post. The first dataset is fact data, which contains call center organization data. The KDG generates a fact data feed in every 15 seconds that contains the following information:
- AgentId – Agents work in a call center setting surrounded by other call center employees answering customers’ questions and referring them to the necessary resources to solve their problems.
- OrgId – A call center contains different organizations and departments, such as Care Hub, IT Hub, Allied Hub, Prem Hub, Help Hub, and more.
- QueueId – Call queues provide an effective way to route calls using simple or sophisticated patterns to ensure that all calls are getting into the correct hands quickly.
- WorkMode – An agent work mode determines your current state and availability to receive incoming calls from the Automatic Call Distribution (ACD) and Direct Agent Call (DAC) queues. Call Center Elite does not route ACD and DAC calls to your phone when you are in an Aux mode or ACW mode.
- WorkSkill – Working as a call center agent requires several soft skills to see the best results, like problem-solving, bilingualism, channel experience, aptitude with data, and more.
- HandleTime – This customer service metric measures the length of a customer’s call.
- ServiceLevel – The call center service level is defined as the percentage of calls answered within a predefined amount of time—the target time threshold. It can be measured over any period of time (such as 30 minutes, 1 hour, 1 day, or 1 week) and for each agent, team, department, or the company as a whole.
- WorkStates – This specifies what state an agent is in. For example, an agent in an available state is available to handle calls from an ACD queue. An agent can have several states with respect to different ACD devices, or they can use a single state to describe their relationship to all ACD devices. Agent states are reported in agent-state events.
- WaitingTime – This is the average time an inbound call spends waiting in the queue or waiting for a callback if that feature is active in your IVR system.
- EventTime – This is the time when the call center stream is sent (via the KDG in this post).
The following fact payload is used in the KDG to generate sample fact data:
The following screenshot shows the output of the sample fact data in an Amazon Managed Service for Apache Flink notebook.

The second dataset is dimension data. This data contains metadata information like organization names for their respective organization IDs, agent names, and more. The frequency of the dimension dataset is twice a day, whereas the fact dataset gets loaded in every 15 seconds. In this post, we use Amazon Simple Storage Service (Amazon S3) as a data storage layer to store metadata information (Amazon DynamoDB can be used to store metadata information as well). We use AWS Lambda to load metadata from Amazon S3 to another Kinesis data stream that stores metadata information. The following JSON file stored in Amazon S3 has metadata mappings to be loaded into the Kinesis data stream:
Ingest data from streaming data sources to Kinesis Data Streams
To start ingesting your data, complete the following steps:
- Create two Kinesis data streams for the fact and dimension datasets, as shown in the following screenshot. For instructions, refer to Creating a Stream via the AWS Management Console.

- Create a Lambda function on the Lambda console to load metadata files from Amazon S3 to Kinesis Data Streams. Use the following code:
Use managed Apache Zeppelin notebooks with Amazon Managed Service for Apache Flink Studio to transform the streaming data
The next step is to create tables in Amazon Managed Service for Apache Flink Studio for further transformations (joins, aggregations, and so on). To set up and query Kinesis Data Streams using Amazon Managed Service for Apache Flink Studio, refer to Query your data streams interactively using Amazon Managed Service for Apache Flink Studio and Python and create an Amazon Managed Service for Apache Flink notebook. Then complete the following steps:
- In the Amazon Managed Service for Apache Flink Studio notebook, create a fact table from the facts data stream you created earlier, using the following query.
The event time attribute is defined using a WATERMARK statement in the CREATE table DDL. A WATERMARK statement defines a watermark generation expression on an existing event time field, which marks the event time field as the event time attribute.
The event time refers to the processing of streaming data based on timestamps that are attached to each row. The timestamps can encode when an event happened. Processing time (PROCTime) refers to the machine’s system time that is running the respective operation.

- Create a dimension table in the Amazon Managed Service for Apache Flink Studio notebook that uses the metadata Kinesis data stream:

- Create a versioned view to extract the latest version of metadata table values to be joined with the facts table:

- Join the facts and versioned metadata table on
orgIDand create a view that provides the total calls in the queue in each organization in a span of every 5 seconds, for further reporting. Additionally, create a tumble window of 5 seconds to receive the final output in every 5 seconds. See the following code:

- Now you can run the following query from the view you created and see the results in the notebook:

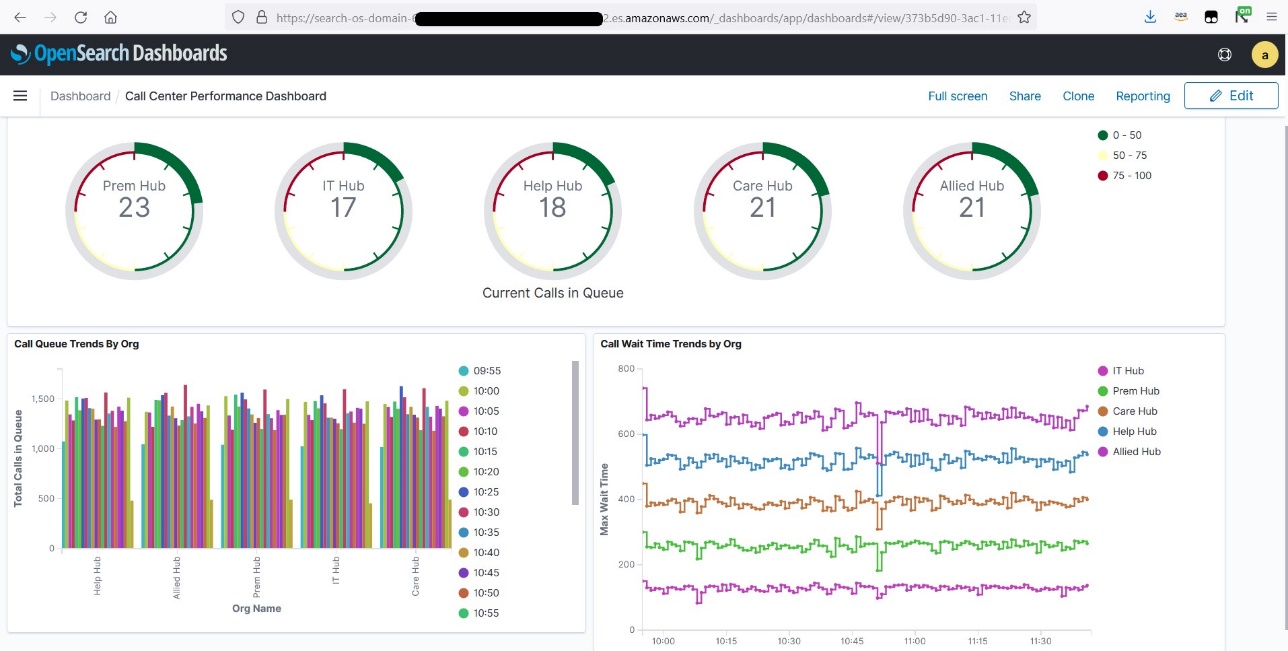
Visualize KPIs of call center performance in near-real time through OpenSearch Dashboards
You can publish the metrics generated within Amazon Managed Service for Apache Flink Studio to OpenSearch Service and visualize metrics in near-real time by creating a call center performance dashboard, as shown in the following example. Refer to Stream the data and validate output to configure OpenSearch Dashboards with Amazon Managed Service for Apache Flink. After you configure the connector, you can run the following command from the notebook to create an index in an OpenSearch Service cluster.
The active_call_queue index is created in OpenSearch Service. The following screenshot shows an index pattern from OpenSearch Dashboards.

Now you can create visualizations in OpenSearch Dashboards. The following screenshot shows an example.
Conclusion
In this post, we discussed ways to modernize a legacy, on-premises, real-time analytics architecture and build a serverless data analytics solution on AWS using Amazon Managed Service for Apache Flink. We also discussed challenges with relational databases when used for real-time analytics and ways to mitigate them by modernizing the architecture with serverless AWS solutions.
If you have any questions or suggestions, please leave us a comment.
About the Authors
 Bhupesh Sharma is a Senior Data Engineer with AWS. His role is helping customers architect highly-available, high-performance, and cost-effective data analytics solutions to empower customers with data-driven decision-making. In his free time, he enjoys playing musical instruments, road biking, and swimming.
 Devika Singh is a Senior Data Engineer at Amazon, with deep understanding of AWS services, architecture, and cloud-based best practices. With her expertise in data analytics and AWS cloud migrations, she provides technical guidance to the community, on architecting and building a cost-effective, secure and scalable solution, that is driven by business needs. Beyond her professional pursuits, she is passionate about classical music and travel.