AWS Big Data Blog
Monitor Apache HBase on Amazon EMR using Amazon Managed Service for Prometheus and Amazon Managed Grafana
Amazon EMR provides a managed Apache Hadoop framework that makes it straightforward, fast, and cost-effective to run Apache HBase. Apache HBase is a massively scalable, distributed big data store in the Apache Hadoop ecosystem. It is an open-source, non-relational, versioned database that runs on top of the Apache Hadoop Distributed File System (HDFS). It’s built for random, strictly consistent, real-time access for tables with billions of rows and millions of columns. Monitoring HBase clusters is critical in order to identify stability and performance bottlenecks and proactively preempt them. In this post, we discuss how you can use Amazon Managed Service for Prometheus and Amazon Managed Grafana to monitor, alert, and visualize HBase metrics.
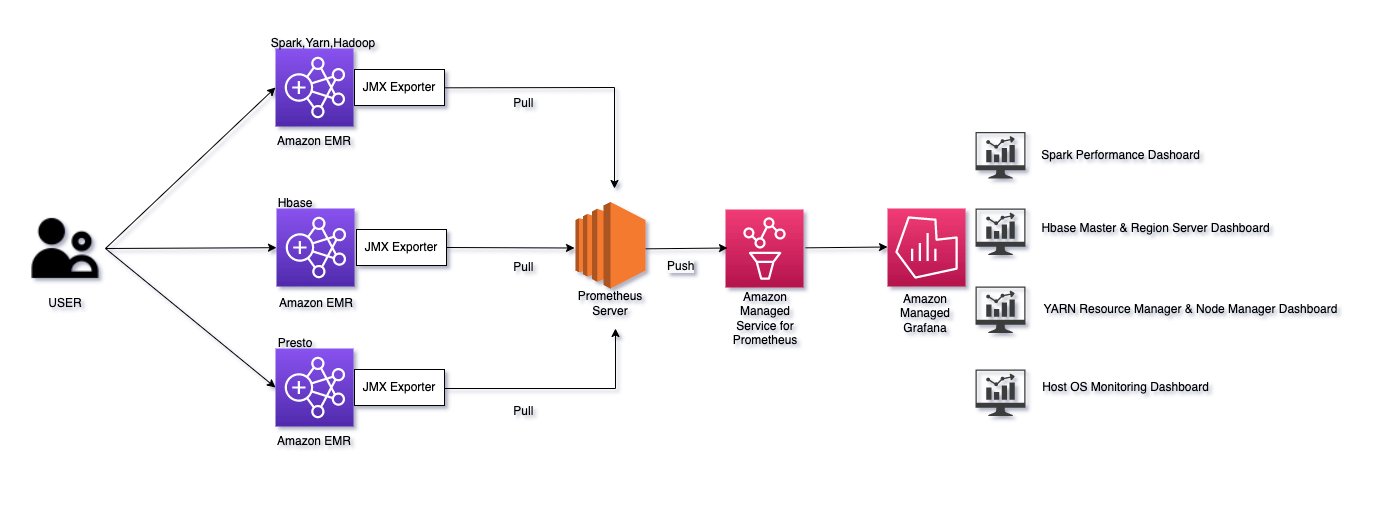
HBase has built-in support for exporting metrics via the Hadoop metrics subsystem to files or Ganglia or via JMX. You can either use AWS Distro for OpenTelemetry or Prometheus JMX exporters to collect metrics exposed by HBase. In this post, we show how to use Prometheus exporters. These exporters behave like small webservers that convert internal application metrics to Prometheus format and serve it at /metrics path. A Prometheus server running on an Amazon Elastic Compute Cloud (Amazon EC2) instance collects these metrics and remote writes to an Amazon Managed Service for Prometheus workspace. We then use Amazon Managed Grafana to create dashboards and view these metrics using an Amazon Managed Service for Prometheus workspace as its data source.
This solution can be extended to other big data platforms such as Apache Spark and Apache Presto that also use JMX to expose their metrics.
Solution overview
The following diagram illustrates our solution architecture.
This post uses an AWS CloudFormation template to perform below actions:
- Install an open-source Prometheus server on an EC2 instance.
- Create appropriate AWS Identity and Access Management (IAM) roles and security group for the EC2 instance running the Prometheus server.
- Create an EMR cluster with an HBase on Amazon S3 configuration.
- Install JMX exporters on all EMR nodes.
- Create additional security groups for the EMR master and worker nodes to connect with the Prometheus server running on the EC2 instance.
- Create a workspace in Amazon Managed Service for Prometheus.
Prerequisites
To implement this solution, make sure you have the following prerequisites:
- An AWS account that provides access to AWS services.
- AWS IAM Identity Center (successor to AWS Single Sign-On) enabled in your account and an IAM Identity Center user to use with Amazon Managed Grafana. For instructions, refer to Enable IAM Identity Center.
- A key pair to SSH into the EMR master node. For instructions, refer to Create a key pair using Amazon EC2.
- Amazon EMR default roles (
EMR_DefaultRoleandEMR_EC2_DefaultRole). Refer to Configure IAM service roles for Amazon EMR permissions to AWS services and resources for instructions or run the following API from the terminal or AWS Cloud9 to create the default roles:
Deploy the CloudFormation template
Deploy the CloudFormation template in the us-east-1 Region:
![]()
It will take 15–20 minutes for the template to complete. The template requires the following fields:
- Stack Name – Enter a name for the stack
- VPC – Choose an existing VPC
- Subnet – Choose an existing subnet
- EMRClusterName – Use
EMRHBase - HBaseRootDir – Provide a new HBase root directory (for example,
s3://hbase-root-dir/). - MasterInstanceType – Use m5x.large
- CoreInstanceType – Use m5x.large
- CoreInstanceCount – Enter 2
- SSHIPRange – Use
<your ip address>/32(you can go to https://checkip.amazonaws.com/ to check your IP address) - EMRKeyName – Choose a key pair for the EMR cluster
- EMRRleaseLabel – Use
emr-6.9.0 - InstanceType – Use the EC2 instance type for installing the Prometheus server

Enable remote writes on the Prometheus server
The Prometheus server is running on an EC2 instance. You can find the instance hostname in the CloudFormation stack’s Outputs tab for key PrometheusServerPublicDNSName.
- SSH into the EC2 instance using the key pair:
- Copy the value for Endpoint – remote write URL from the Amazon Managed Service for Prometheus workspace console.

- Edit
remote_write urlin/etc/prometheus/conf/prometheus.yml:
It should look like the following code:

- Now we need to restart the Prometheus server to pick up the changes:
Enable Amazon Managed Grafana to read from an Amazon Managed Service for Prometheus workspace
We need to add the Amazon Managed Prometheus workspace as a data source in Amazon Managed Grafana. You can skip directly to step 3 if you already have an existing Amazon Managed Grafana workspace and want to use it for HBase metrics.
- First, let’s create a workspace on Amazon Managed Grafana. You can follow the appendix to create a workspace using the Amazon Managed Grafana console or run the following API from your terminal (provide your role ARN):
- On the Amazon Managed Grafana console, choose Configure users and select a user you want to allow to log in to Grafana dashboards.
Make sure your IAM Identity Center user type is admin. We need this to create dashboards. You can assign the viewer role to all the other users.


- Log in to the Amazon Managed Grafana workspace URL using your admin credentials.
- Choose AWS Data Sources in the navigation pane.

- For Service, choose Amazon Managed Service for Prometheus.

- For Regions, choose US East (N. Virginia).
Create an HBase dashboard
Grafana labs has an open-source dashboard that you can use. For example, you can follow the guidance from the following HBase dashboard. Start creating your dashboard and chose the import option. Provide the URL of the dashboard or enter 12722 and choose Load. Make sure your Prometheus workspace is selected on the next page. You should see HBase metrics showing up on the dashboard.

Key HBase metrics to monitor
HBase has a wide range of metrics for HMaster and RegionServer. The following are a few important metrics to keep in mind.
| HMASTER | Metric Name | Metric Description |
| . | hadoop_HBase_numregionservers | Number of live region servers |
| . | hadoop_HBase_numdeadregionservers | Number of dead region servers |
| . | hadoop_HBase_ritcount | Number of regions in transition |
| . | hadoop_HBase_ritcountoverthreshold | Number of regions that have been in transition longer than a threshold time (default: 60 seconds) |
| . | hadoop_HBase_ritduration_99th_percentile | Maximum time taken by 99% of the regions to remain in transition state |
| REGIONSERVER | Metric Name | Metric Description |
| . | hadoop_HBase_regioncount | Number of regions hosted by the region server |
| . | hadoop_HBase_storefilecount | Number of store files currently managed by the region server |
| . | hadoop_HBase_storefilesize | Aggregate size of the store files |
| . | hadoop_HBase_hlogfilecount | Number of write-ahead logs not yet archived |
| . | hadoop_HBase_hlogfilesize | Size of all write-ahead log files |
| . | hadoop_HBase_totalrequestcount | Total number of requests received |
| . | hadoop_HBase_readrequestcount | Number of read requests received |
| . | hadoop_HBase_writerequestcount | Number of write requests received |
| . | hadoop_HBase_numopenconnections | Number of open connections at the RPC layer |
| . | hadoop_HBase_numactivehandler | Number of RPC handlers actively servicing requests |
| Memstore | . | . |
| . | hadoop_HBase_memstoresize | Total memstore memory size of the region server |
| . | hadoop_HBase_flushqueuelength | Current depth of the memstore flush queue (if increasing, we are falling behind with clearing memstores out to Amazon S3) |
| . | hadoop_HBase_flushtime_99th_percentile | 99th percentile latency for flush operation |
| . | hadoop_HBase_updatesblockedtime | Number of milliseconds updates have been blocked so the memstore can be flushed |
| Block Cache | . | . |
| . | hadoop_HBase_blockcachesize | Block cache size |
| . | hadoop_HBase_blockcachefreesize | Block cache free size |
| . | hadoop_HBase_blockcachehitcount | Number of block cache hits |
| . | hadoop_HBase_blockcachemisscount | Number of block cache misses |
| . | hadoop_HBase_blockcacheexpresshitpercent | Percentage of the time that requests with the cache turned on hit the cache |
| . | hadoop_HBase_blockcachecounthitpercent | Percentage of block cache hits |
| . | hadoop_HBase_blockcacheevictioncount | Number of block cache evictions in the region server |
| . | hadoop_HBase_l2cachehitratio | Local disk-based bucket cache hit ratio |
| . | hadoop_HBase_l2cachemissratio | Bucket cache miss ratio |
| Compaction | . | . |
| . | hadoop_HBase_majorcompactiontime_99th_percentile | Time in milliseconds taken for major compaction |
| . | hadoop_HBase_compactiontime_99th_percentile | Time in milliseconds taken for minor compaction |
| . | hadoop_HBase_compactionqueuelength | Current depth of the compaction request queue (if increasing, we are falling behind with storefile compaction) |
| . | flush queue length | Number of flush operations waiting to be processed in the region server (a higher number indicates flush operations are slow) |
| IPC Queues | . | . |
| . | hadoop_HBase_queuesize | Total data size of all RPC calls in the RPC queues in the region server |
| . | hadoop_HBase_numcallsingeneralqueue | Number of RPC calls in the general processing queue in the region server |
| . | hadoop_HBase_processcalltime_99th_percentile | 99th percentile latency for RPC calls to be processed in the region server |
| . | hadoop_HBase_queuecalltime_99th_percentile | 99th percentile latency for RPC calls to stay in the RPC queue in the region server |
| JVM and GC | . | . |
| . | hadoop_HBase_memheapusedm | Heap used |
| . | hadoop_HBase_memheapmaxm | Total heap |
| . | hadoop_HBase_pausetimewithgc_99th_percentile | Pause time in milliseconds |
| . | hadoop_HBase_gccount | Garbage collection count |
| . | hadoop_HBase_gctimemillis | Time spent in garbage collection, in milliseconds |
| Latencies | . | . |
| . | HBase.regionserver.<op>_<measure> | Operation latencies, where <op> is Append, Delete, Mutate, Get, Replay, or Increment, and <measure> is min, max, mean, median, 75th_percentile, 95th_percentile, or 99th_percentile |
| . | HBase.regionserver.slow<op>Count | Number of operations we thought were slow, where <op> is one of the preceding list |
| Bulk Load | . | . |
| . | Bulkload_99th_percentile | hadoop_HBase_bulkload_99th_percentile |
| I/O | . | . |
| . | FsWriteTime_99th_percentile | hadoop_HBase_fswritetime_99th_percentile |
| . | FsReadTime_99th_percentile | hadoop_HBase_fsreadtime_99th_percentile |
| Exceptions | . | . |
| . | exceptions.RegionTooBusyException | . |
| . | exceptions.callQueueTooBig | . |
| . | exceptions.NotServingRegionException | . |
Considerations and limitations
Note the following when using this solution:
- You can set up alerts on Amazon Managed Service for Prometheus and visualize them in Amazon Managed Grafana.
- This architecture can be easily extended to include other open-source frameworks such as Apache Spark, Apache Presto, and Apache Hive.
- Refer to the pricing details for Amazon Managed Service for Prometheus and Amazon Managed Grafana.
- These scripts are for guidance purposes only and aren’t ready for production deployments. Make sure to perform thorough testing.
Clean up
To avoid ongoing charges, delete the CloudFormation stack and workspaces created in Amazon Managed Grafana and Amazon Managed Service for Prometheus.
Conclusion
In this post, you learned how to monitor EMR HBase clusters and set up dashboards to visualize key metrics. This solution can serve as a unified monitoring platform for multiple EMR clusters and other applications. For more information on EMR HBase, see Release Guide and HBase Migration whitepaper.
Appendix
Complete the following steps to create a workspace on Amazon Managed Grafana:
- Log in to the Amazon Managed Grafana console and choose Create workspace.

- For Authentication access, select AWS IAM Identity Center.
If you don’t have IAM Identity Center enabled, refer to Enable IAM Identity Center.
- Optionally, to view Prometheus alerts in your Grafana workspace, select Turn Grafana alerting on.

- On the next page, select Amazon Managed Service for Prometheus as the data source.

- After the workspace is created, assign users to access Amazon Managed Grafana.
- For a first-time setup, assign admin privileges to the user.
You can add other users with only viewer access.
Make sure you are able to log in to the Grafana workspace URL using your IAM Identity Center user credentials.
About the Author
 Anubhav Awasthi is a Sr. Big Data Specialist Solutions Architect at AWS. He works with customers to provide architectural guidance for running analytics solutions on Amazon EMR, Amazon Athena, AWS Glue, and AWS Lake Formation.