AWS Big Data Blog
Microservice observability with Amazon OpenSearch Service part 1: Trace and log correlation
Modern enterprises are increasingly adopting microservice architectures and moving away from monolithic structures. Although microservices provide agility in development and scalability, and encourage use of polyglot systems, they also add complexity. Troubleshooting distributed services is hard because the application behavioral data is distributed across multiple machines. Therefore, in order to have deep insights to troubleshoot distributed applications, operational teams need to collect application behavioral data in one place to scan through them.
Although setting up monitoring systems focuses on analyzing only log data can help you understand what went wrong and notify about any anomalies, it fails to provide insight into why something went wrong and exactly where in the application code it went wrong. Fixing issues in a complex network of systems is like finding a needle in a haystack. Observability based on Open Standards defined by OpenTelemetry addresses the problem by providing support to handle logs, traces, and metrics within a single implementation.
In this series, we cover the setup and troubleshooting of a distributed microservice application using logs and traces. Logs are immutable, timestamped, discreet events happening over a period of time, whereas traces are a series of related events that capture the end-to-end request flow in a distributed system. We look into how to collect a large volume of logs and traces in Amazon OpenSearch Service and correlate these logs and traces to find the actual issue and where the issue was generated.
Any investigation of issues in enterprise applications needs to be logged in an incident report, so that operational and development teams can collaborate to roll out a fix. When any investigation is carried out, it’s important to write a narrative about the issue so that it can be used in discussion later. We look into how to use the latest notebook feature in OpenSearch Service to create the incident report.
In this post, we discuss the architecture and application troubleshooting steps.
Microservice observability with Amazon OpenSearch Service
|
Solution overview
The following diagram illustrates the observability solution architecture to capture logs and traces.
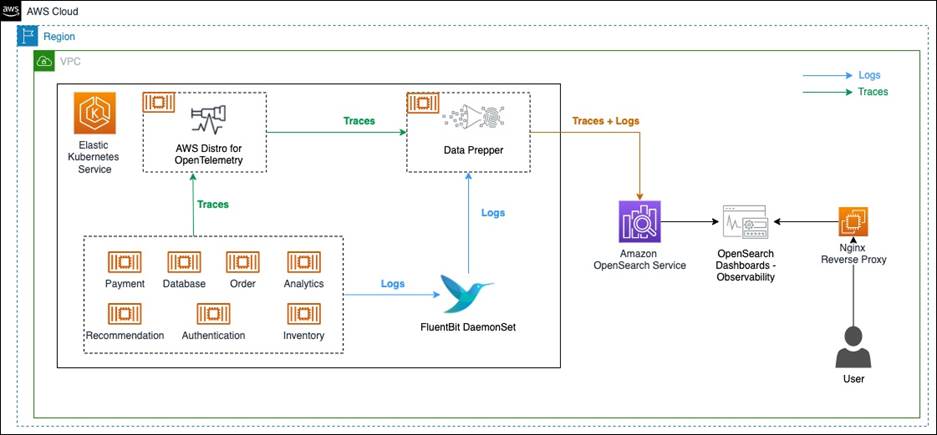
The solution components are as follows:
- Amazon OpenSearch Service is a managed AWS service that makes it easy to deploy, operate, and scale OpenSearch clusters in the AWS Cloud. OpenSearch Service supports OpenSearch and legacy Elasticsearch open-source software (up to 7.10, the final open-source version of the software).
- FluentBit is an open-source processor and forwarder that collects, enriches, and sends metrics and logs to various destinations.
- AWS Distro for OpenTelemetry is a secure, production-ready, AWS-supported distribution of the OpenTelemetry project. With AWS Distro for OpenTelemetry, you can instrument your applications just once to send correlated metrics and traces to multiple AWS and Partner monitoring solutions, including OpenSearch Service.
- Data Prepper is an open-source utility service with the ability to filter, enrich, transform, normalize, and aggregate data to enable an end-to-end analysis lifecycle, from gathering raw logs to facilitating sophisticated and actionable interactive ad hoc analyses on the data.
- We use a sample observability shop web application built as a microservice to demonstrate the capabilities of the solution components.
- Amazon Elastic Kubernetes Service (Amazon EKS) is a managed service that you can use to run Kubernetes on AWS without needing to install, operate, and maintain your own Kubernetes control plane or nodes. Kubernetes is an open-source system for automating the deployment, scaling, and management of the container.
In this solution, we have a sample o11y (Observability) Shop web application written in Python and Java, and deployed in an EKS cluster. The web application is composed of various services. When some operations are done from the front end, the request travels through multiple services on the backend. The application services are running as separate containers, while AWS Distro for OpenTelemetry, FluentBit, and Data Prepper are running as sidecar containers.
FluentBit is used for collecting log data from application containers, and then sends logs to Data Prepper. For collecting traces, first the application services are instrumented using the OpenTelemetry SDK. Then, with AWS Distro for OpenTelemetry collector, trace information is collected and sent to Data Prepper. Data Prepper forwards the logs and traces data to OpenSearch Service.
We recommend deploying the OpenSearch Service domain within a VPC, so a reverse proxy is needed to be able to log in to OpenSearch Dashboards.
Prerequisite
You need an AWS account with necessary permissions to deploy the solution.
Set up the environment
We use AWS CloudFormation to provision the components of our architecture. Complete the following steps:
- Launch the CloudFormation stack in the
us-east-1Region:

- You may keep the stack name default to
AOS-Observability. - You may change the
OpenSearchMasterUserNameparameter used for OpenSearch Service login while keeping other parameter values to default. The stack provisions a VPC, subnets, security groups, route tables, an AWS Cloud9 instance, and an OpenSearch Service domain, along with a Nginx reverse proxy. It also configures AWS Identity and Access Management (IAM) roles. The stack will also generate a new random password for OpenSearch Service domain which can be seen in the CloudFormation Outputs tab underAOSDomainPassword. - On the stack’s Outputs tab, choose the link for the AWS Cloud9 IDE.

- Run the following code to install the required packages, configure the environment variables and provision the EKS cluster:
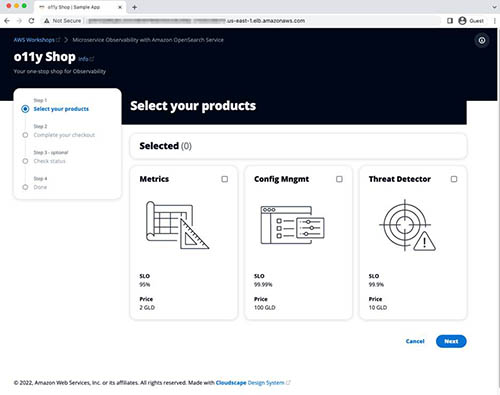
After the resources are deployed, it prints the hostname for the o11y Shop web application.

- Copy the hostname and enter it in the browser.
This opens the o11y Shop microservice application, as shown in the following screenshot.
Access the OpenSearch Dashboards
To access the OpenSearch Dashboards, complete the following steps:
- Choose the link for
AOSDashboardsPublicIPfrom the CloudFormation stack outputs. Because the OpenSearch Service domain is deployed inside the VPC, we use an Nginx reverse proxy to forward the traffic to the OpenSearch Service domain. Because the OpenSearch Dashboards URL is signed using a self-signed certificate, you need to bypass the security exception. In production, a valid certificate is recommended for secure access.
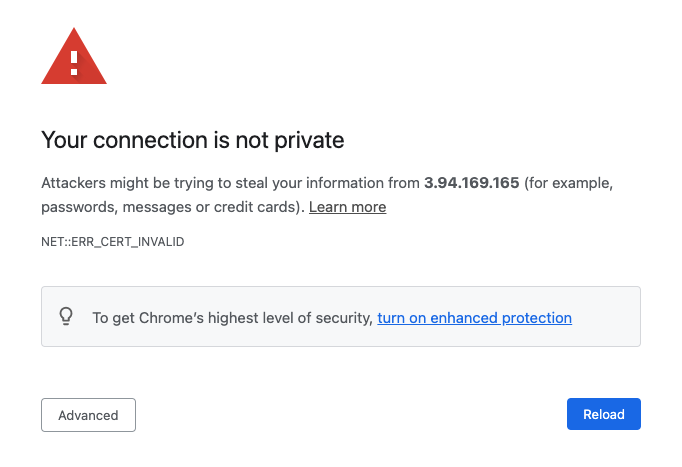
- Assuming you’re using Google Chrome, while you are on this page, enter
thisisunsafe.Google Chrome redirects you to the OpenSearch Service login page. - Log in with the OpenSearch Service login details (found in the CloudFormation stack output:
AOSDomainUserNameandAOSDomainPassword).You’re presented with a dialog requesting you to add data for exploration. - Select Explore on my own.
- When asked to select a tenant, leave the default options and choose Confirm.
- Open the Hamburger menu to explore the plugins within OpenSearch Dashboards.

This is the OpenSearch Dashboards user interface. We use it in the next steps to analyze, explore, fix, and find the root cause of the issue.
Logs and traces generation
Click around the o11y Shop application to simulate user actions. This will generate logs and some traces for the associated microservices stored in OpenSearch Service. You can do the process multiple times to generate more sample logs and traces data.
Create an index pattern
An index pattern selects the data to use and allows you to define properties of the fields. An index pattern can point to one or more indexes, data streams, or index aliases.
You need to create an index pattern to query the data through OpenSearch Dashboards.
- On OpenSearch Dashboards, choose Stack Management.
- Choose Index Patterns
- Choose Create index pattern.
- For Index pattern name, enter
sample_app_logs. OpenSearch Dashboards also supports wildcards. - Choose Next step.

- For Time field, choose time.
- Choose Create index pattern.

- Repeat these steps to create the index pattern
otel-v1-apm-span*withevent.timeas the time field for discovering traces.
Search logs
Choose the menu icon and look for the Discover section in OpenSearch Dashboards. The Discover panel allows you to view and query logs. Check the log activity happening in the microservice application.
If you can’t see any data, increase the time range to something large (like the last hour). Alternatively, you can play around the o11y Shop application to generate recent logs and traces data.

Instrument applications to generate traces
Applications need to be instrumented to generate and send trace data downstream. There are two types of instrumentation:
- Automatic – In automatic instrumentation, no application code change is required. It uses an agent that can capture trace data from the running application. It requires usage of the language-specific API and SDK, which takes the configuration provided through the code or environment and provides good coverage of endpoints and operations. It automatically determines the span start and end.
- Manual – In manual instrumentation, developers need to add trace capture code to the application. This provides customization in terms of capturing traces for a custom code block, naming various components in
OpenTelemetrylike traces and spans, adding attributes and events, and handling specific exceptions within the code.
In our application code, we use manual instrumentation. Refer to Manual Instrumentation to collect traces in the GitHub repository to understand the steps.
Explore trace analytics
OpenSearch Service version 1.3 has a new module to support observability.
- Choose the menu icon and look for the Observability section under OpenSearch Plugins.

- Choose Trace analytics to examine some of the traces generated by the backend service. If you fail to see sufficient data, increase the time range. Alternatively, choose all the buttons on the sample app webpage for each application service to generate sufficient trace data to debug. You can choose each option multiple times. The following screenshot shows a summarized view of the traces captured.
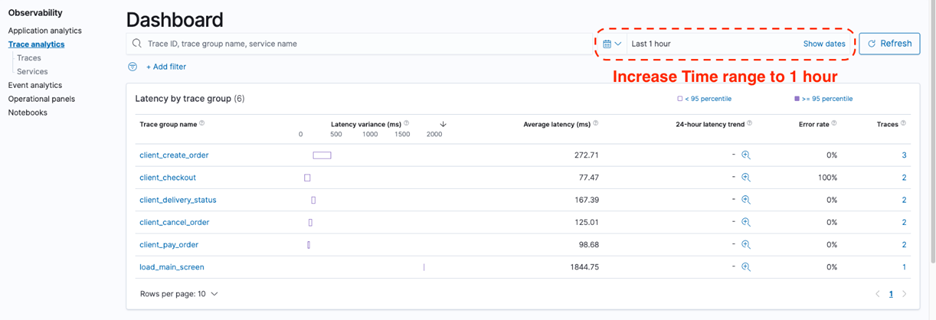
The dashboard view groups traces together by trace group name and provides information about average latency, error rate, and trends associated with a particular operation. Latency variance indicates if the latency of a request falls below the 95 percentile or above. If there are multiple trace groups, you can reduce the view by adding filters on various parameters. - Add a filter on the trace group
client_checkout.

The following screenshot shows our filtered results.

The dashboard also features a map of all the connected services. The Service map helps provide a high-level view on what’s going on in the services based on the color-coding grouped by Latency, Error rate, and Throughput. This helps you identify problems by service. - Choose Error rate to explore the error rate of the connected services.Based on the color-coding in the following diagram, it’s evident that the payment service is throwing errors, whereas other services are working fine without any errors.

- Switch to the Latency view, which shows the relative latency in milliseconds with different colors.
This is useful for troubleshooting bottlenecks in microservices.

The Trace analytics dashboard also shows distribution of traces over time and trace error rate over time.

- To discover the list of traces, under Trace analytics in the navigation pane, choose Traces.
- To find the list of services, count of traces per service, and other service-level statistics, choose Services in the navigation pane.

Search traces
Now we want to drill down and learn more about how to troubleshoot errors.
- Go back to the Trace analytics dashboard.
- Choose Error Rate Service Map and choose the
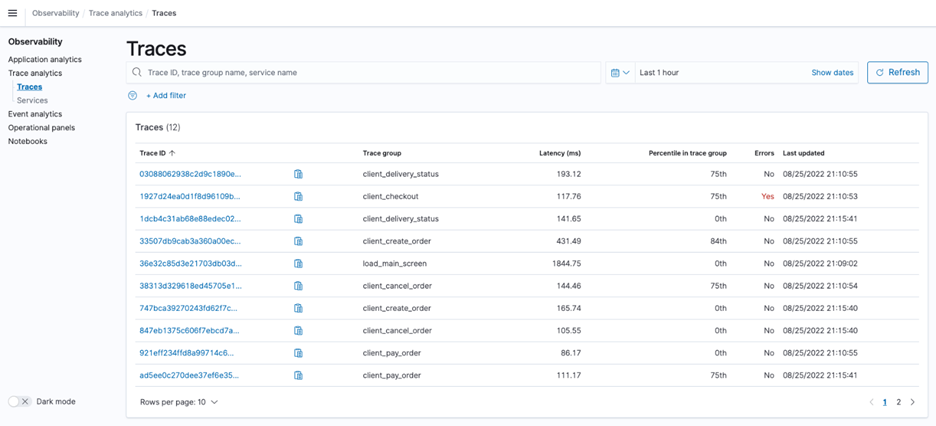
paymentservice on the graph.Thepaymentservice is in dark red. This also sets thepaymentservice filter on the dashboard, and you can see the trace group in the upper pane. - Choose the Traces link of the
client_checkouttrace group.

You’re redirected to the Traces page. The list of traces for theclient_checkouttrace group can be found here.

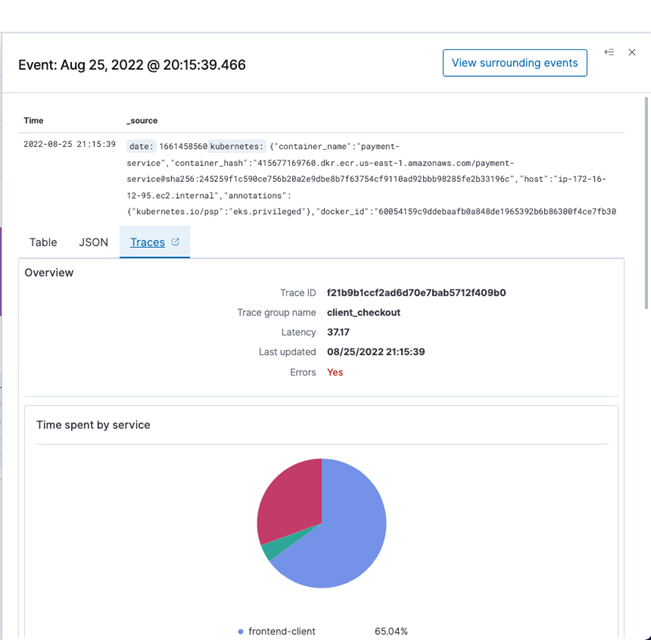
- To view details of the traces, choose Trace IDs.You can see a pie chart showing how much time the trace has spent in each service. The trace is composed of multiple spans, which is defined as a timed operation that represents a piece of workflow in the distributed system. On the right, you can also see time spent in each span, and which have an error.
- Copy the trace ID in the
client-checkoutgroup.

Log and trace correlation
Although the log and trace data provides valuable information individually, the actual advantage is when we can relate trace data to log data to capture more details about what went wrong. There are three ways we can correlate traces to logs:
- Runtime – Logs, traces, and metrics can record the moment of time or the range of time the run took place.
- Run context – This is also known as the request context. It’s standard practice to record the run context (trace and span IDs as well as user-defined context) in the spans.
OpenTelemetryextends this practice to logs where possible by including theTraceIDandSpanIDin the log records. This allows us to directly correlate logs and traces that correspond to the same run context. It also allows us to correlate logs from different components of a distributed system that participated in the particular request. - Origin of the telemetry – This is also known as the resource context.
OpenTelemetrytraces and metrics contain information about the resource they come from. We extend this practice to logs by including the resource in the log records.
These three correlation methods can be the foundation of powerful navigational, filtering, querying, and analytical capabilities. OpenTelemetry aims to record and collect logs in a manner that enables such correlations.
- Use the copied
traceIdfrom the previous section and search for corresponding logs on the Event analytics page.
We use the following PPL query:Make sure to increase the time range to at least the last hour.

- Choose Update to find the corresponding log data for the trace ID.

- Choose the expand icon to find more details.This shows you the details of the log including the
traceId. This log shows that the payment checkout operation failed. This correlation allowed us to find key information in the log that allows us to go to the application and debug the code.

- Choose the Traces tab to see the corresponding trace data linked with the log data.
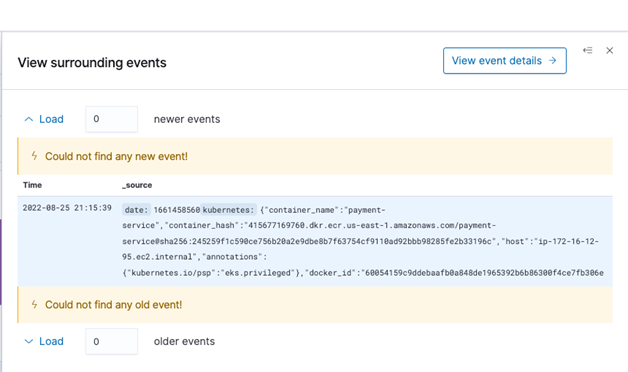
- Choose View surrounding events to discover other events happening at the same time.
This information can be valuable when you want to understand what’s going on in the whole application, particularly how other services are impacted during that time.
Cleanup
This section provides the necessary information for deleting various resources created as part of this post.
It is recommended to perform the below steps after going through the next post of the series.
- Execute the following command on the Cloud9 terminal to remove Elastic Kubernetes Service Cluster and its resources.
- Execute the script to delete the Amazon Elastic Container Registry repositories.
- Delete the CloudFormation stacks in sequence
- eksDeploy,AOS-Observability.
Summary
In this post, we deployed an Observability (o11y) Shop microservice application with various services and captured logs and traces from the application. We used FluentBit to capture logs, AWS Distro for Open Telemetry to capture traces, and Data Prepper to collect these logs and traces and send it to OpenSearch Service. We showed how to use the Trace analytics page to look into the captured traces, details about those traces, and service maps to find potential issues. To correlate log and trace data, we demonstrated how to use the Event analytics page to write a simple PPL query to find corresponding log data. The implementation code can be found in the GitHub repository for reference.
The next post in our series covers the use of PPL to create an operational panel to monitor our microservices along with an incident report using notebooks.
About the Author
 Subham Rakshit is a Streaming Specialist Solutions Architect for Analytics at AWS based in the UK. He works with customers to design and build search and streaming data platforms that help them achieve their business objective. Outside of work, he enjoys spending time solving jigsaw puzzles with his daughter.
 Marvin Gersho is a Senior Solutions Architect at AWS based in New York City. He works with a wide range of startup customers. He previously worked for many years in engineering leadership and hands-on application development, and now focuses on helping customers architect secure and scalable workloads on AWS with a minimum of operational overhead. In his free time, Marvin enjoys cycling and strategy board games.
 Rafael Gumiero is a Senior Analytics Specialist Solutions Architect at AWS. An open-source and distributed systems enthusiast, he provides guidance to customers who develop their solutions with AWS Analytics services, helping them optimize the value of their solutions.