AWS Big Data Blog
Visualize and Monitor Amazon EC2 Events with Amazon CloudWatch Events and Amazon Kinesis Firehose
February 9, 2024: Amazon Kinesis Data Firehose has been renamed to Amazon Data Firehose. Read the AWS What’s New post to learn more.
September 8, 2021: Amazon Elasticsearch Service has been renamed to Amazon OpenSearch Service. See details.
Monitoring your AWS environment is important for security, performance, and cost control purposes. For example, by monitoring and analyzing API calls made to your Amazon EC2 instances, you can trace security incidents and gain insights into administrative behaviors and access patterns. The kinds of events you might monitor include console logins, Amazon EBS snapshot creation/deletion/modification, VPC creation/deletion/modification, and instance reboots, etc.
In this post, I show you how to build a near real-time API monitoring solution for EC2 events using Amazon CloudWatch Events and Amazon Kinesis Firehose. Please be sure to have Amazon CloudTrail enabled in your account.
- CloudWatch Events offers a near real-time stream of system events that describe changes in AWS resources. CloudWatch Events now supports Kinesis Firehose as a target.
- Kinesis Firehose is a fully managed service for continuously capturing, transforming, and delivering data in minutes to storage and analytics destinations such as Amazon S3, Amazon Kinesis Analytics, Amazon Redshift, and Amazon OpenSearch Service.
Walkthrough
For this walkthrough, you create a CloudWatch event rule that matches specific EC2 events such as:
- Starting, stopping, and terminating an instance
- Creating and deleting VPC route tables
- Creating and deleting a security group
- Creating, deleting, and modifying instance volumes and snapshots
Your CloudWatch event target is a Kinesis Firehose delivery stream that delivers this data to an Elasticsearch cluster, where you set up Kibana for visualization. Using this solution, you can easily load and visualize EC2 events in minutes without setting up complicated data pipelines.

Set up the Elasticsearch cluster
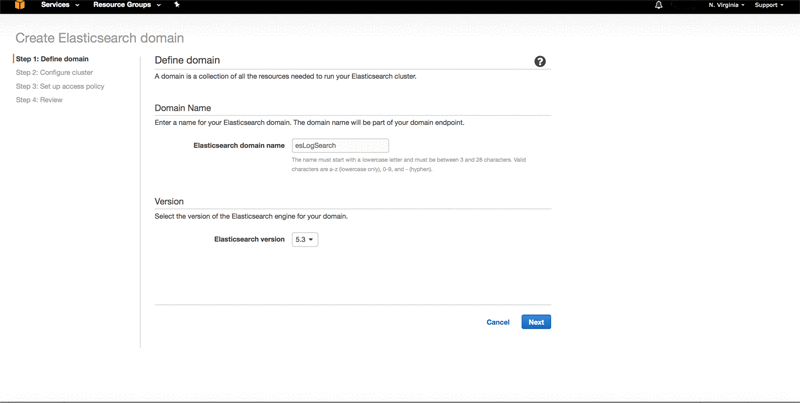
Create the Amazon OpenSearch Service domain in the Amazon OpenSearch Service console, or by using the create-elasticsearch-domain command in the AWS CLI.
This example uses the following configuration:
- Domain Name: esLogSearch
- Elasticsearch Version: 1
- Instance Count: 2
- Instance type:elasticsearch
- Enable dedicated master: true
- Enable zone awareness: true
- Restrict Amazon OpenSearch Service to an IP-based access policy
Other settings are left as the defaults.
Create a Kinesis Firehose delivery stream
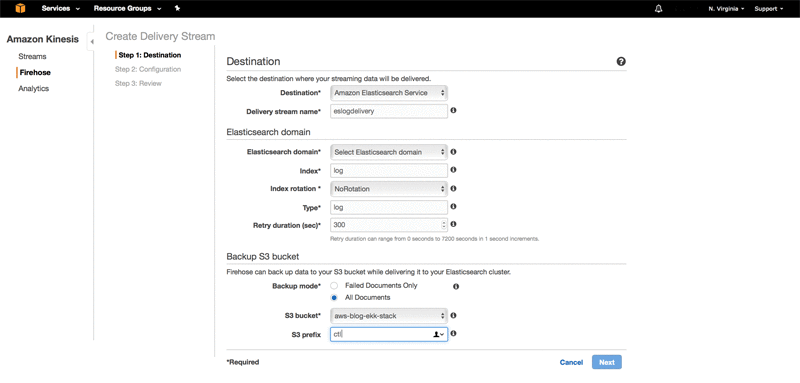
In the Kinesis Firehose console, create a new delivery stream with Amazon OpenSearch Service as the destination. For detailed steps, see Create a Kinesis Firehose Delivery Stream to Amazon Elasticsearch Service.
Set up CloudWatch Events
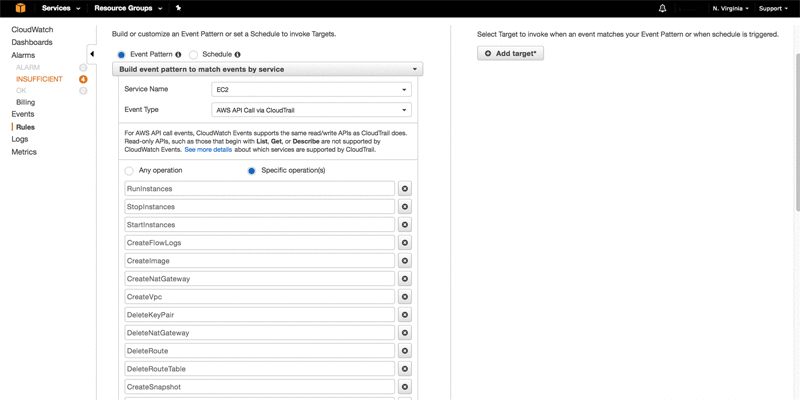
Create a rule, and configure the event source and target. You can choose to configure multiple event sources with several AWS resources, along with options to specify specific or multiple event types.
In the CloudWatch console, choose Events.
For Service Name, choose EC2.
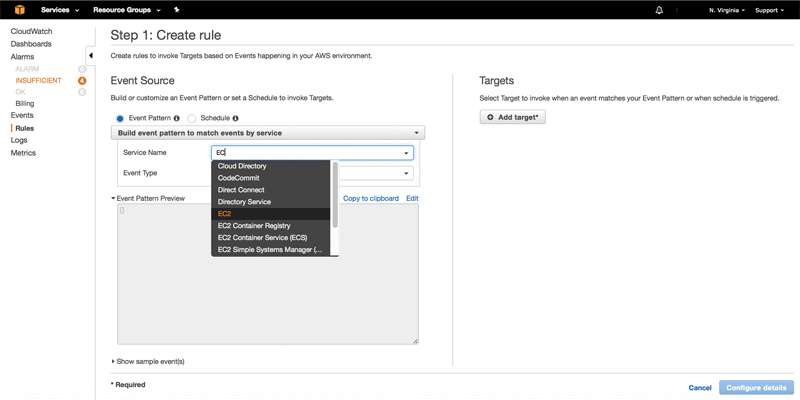
In Event Pattern Preview, choose Edit and copy the pattern below. For this walkthrough, I selected events that are specific to the EC2 API, but you can modify it to include events for any of your AWS resources.
The following screenshot shows what your event looks like in the console.
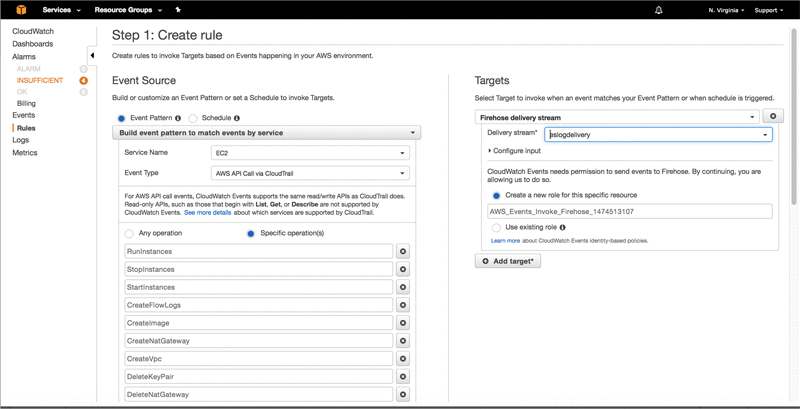
Next, choose Add target and select the delivery stream that you just created.
Set up Kibana on the Elasticsearch cluster
Amazon OpenSearch Service provides a default installation of Kibana with every Amazon OpenSearch Service domain. You can find the Kibana endpoint on your domain dashboard in the Amazon OpenSearch Service console. You can restrict Amazon OpenSearch Service access to an IP-based access policy.
In the Kibana console, for Index name or pattern, type log. This is the name of the Elasticsearch index.
For Time-field name, choose @time.
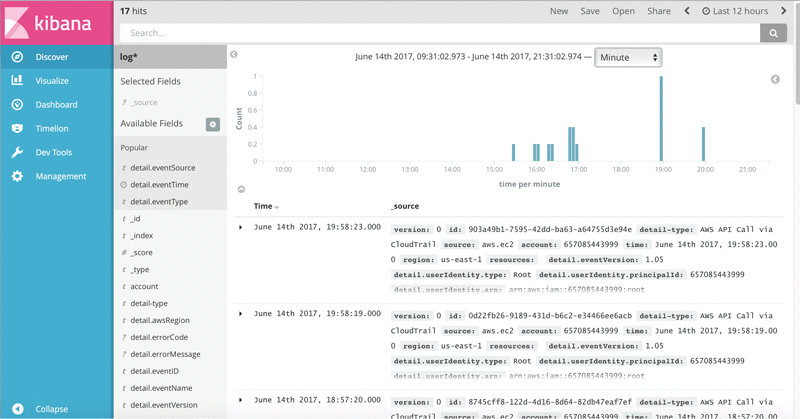
To view the events, choose Discover.
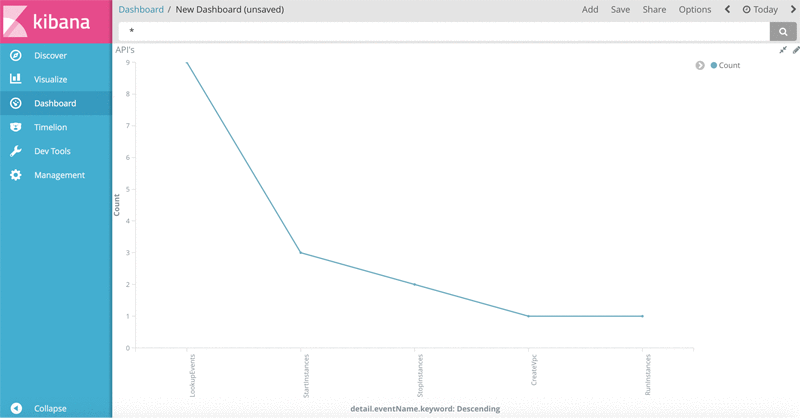
The following chart demonstrates the API operations and the number of times that they have been triggered in the past 12 hours.
Summary
In this post, you created a continuous, near real-time solution to monitor various EC2 events such as starting and shutting down instances, creating VPCs, etc. Likewise, you can build a continuous monitoring solution for all the API operations that are relevant to your daily AWS operations and resources.
With Kinesis Firehose as a new target for CloudWatch Events, you can retrieve, transform, and load system events to the storage and analytics destination of your choice in minutes, without setting up complicated data pipelines.
If you have any questions or suggestions, please comment below.
Additional Reading
