AWS Database Blog
Analyze Amazon Aurora MySQL Workloads with Performance Insights
Amazon Relational Database Service (Amazon RDS) Performance Insights gives customers instant visibility into the nature of the workloads on their Amazon RDS databases, as well as the causes of performance problems. In this blog post, we will take a quick tour of the Performance Insights dashboard for the Amazon Aurora MySQL-Compatible Edition and learn to analyze certain performance issues. In a previous blog post, Analyzing Amazon RDS Database Workloads with Performance Insights, we covered the basics of accessing Performance Insights as well as using the it with the Amazon Aurora PostgreSQL-Compatible Edition.
Below, Performance Insights shows a load running on an Aurora MySQL database. In this example, the load graph is sliced by waits. Waits let us see what kind of work is responsible for the load. Waits let us see how much of the load comes from CPU, I/O reads, locks, write to stable storage, or contention from other database resources. Aurora MySQL uses MySQL’s Performance Schema to instrument waits in the database. That means that Aurora MySQL users that want to get the most from Performance Insights should have the MySQL Performance Schema enabled. If you have never enabled or disabled Performance Schema in the RDS parameter group, then enabling Performance Insights will automatically enable and configure MySQL Performance Schema for you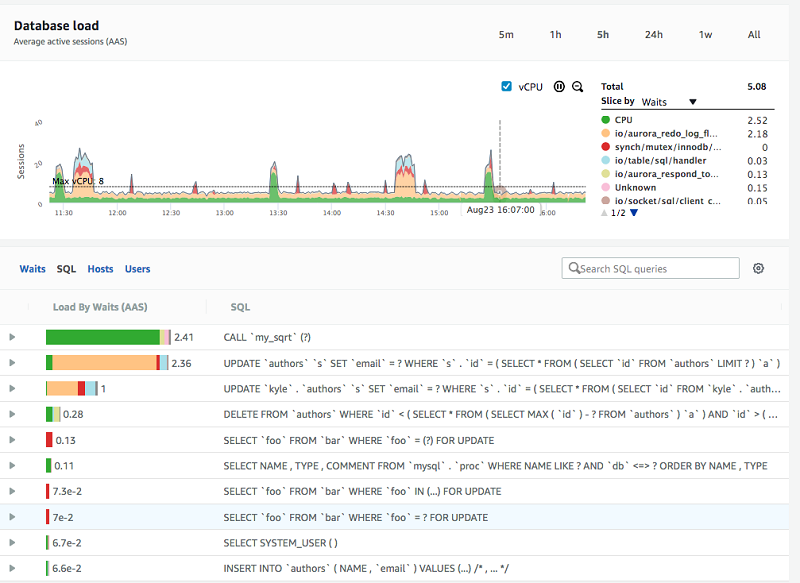
Database load
The top half of the dashboard shows database load measured in average active sessions (AAS). By default, Performance Insights shows one hour of history with each point representing the average during 1 minute. The graph automatically refreshes every minute to show new incoming data.
Database load measured in average active sessions (AAS) is a novel representation and visualization of database performance, and in essence reflects the number of database connections concurrently running queries in the database (in this context, a session is the same as a connection). For example, if a user runs a query that takes 60 seconds on an otherwise idle database, then the DB load during that minute will be 1, because there is one session active the whole minute. If two users simultaneously run queries that take 60 seconds, then for that minute the DB load will be 2. If 60 users each run a query that takes one second, and they each run that query exactly once inside a minute, then the DB load during that minute will be 1 (since on average, there is one connection running a query in any given second of that minute). The average connections active during one minute is 1 if each execution only takes one second.
Performance Insights doesn’t only show you DB load. It also shows you what kind of activities are responsible for that load. When slice by waits is selected, Performance Insights groups DB load by the kind of activity happening, such as CPU, I/O, lock, or waiting for other database resources. By observing which waits are most responsible for DB load, you can understand what kind of contention is limiting performance.
There is an important graphic element on the load chart: The dotted Max vCPU line represents the maximum number of sessions that can be active on CPU before CPU queueing arises. For example, if I have two vCPUs and four active processes then only two of the processes can be active on the vCPU at a time. The other two will wait in the run queue. Thus, the vCPU line is a good yardstick for measuring whether the load exceeds available resources, or whether the instance has spare capacity.
Top SQL
By default, a list below the DB load graph shows the SQL queries responsible for that load. Those at the top of the list are most responsible, and are likely the SQLs you will want to focus on tuning to resolve a bottleneck.
When is your database idle?
Knowing that your database is idle is important. With an idle database, any application performance issues are likely not due to the database. With Performance Insights, you can quickly see if the database is idle: There is no activity in the database load chart. An example is shown here:

Do you have a CPU bottleneck?
In the DB load chart below, there is a spike just before 13:30. The majority of the spike is CPU, which is colored green. The DB load from CPU demand peaks at about 15 AAS.

Because the database only has access to 8 vCPUs, this means that during the CPU demand peak, almost half of the sessions were waiting for CPU cycles at any one point in time. Another way to say this is that during that peak minute, those 15 sessions spent nearly half their time waiting to get access to CPU. If you were to provide twice the amount of CPU, then they could potentially run almost twice as fast.
In Performance Insights, you can zoom into an parts of the DB load graph by clicking and dragging. In the image here, I am zooming in to the CPU load spike on August 24.

Performance Insights zooms to that selection, and the top SQL list is re-scoped to the new timeframe:

In the SQL tab below the load chart a single stored procedure, my_sqrt(), is running concurrently in several sessions and is solely responsible for the CPU load. In this scenario, you would focus on optimizing this stored procedure by examining the internal logic of the function, or by reducing the frequency the application calls it.
Do you have a bottleneck?
In the following example, we can see a spike on the left of the DB Load chart. In this case, the spike shows that most of the load is from the Aurora MySQL wait event io/aurora_redo_log_flush, which is a wait for writing to stable Aurora storage.

If we zoom in on the spike we see:

Almost all the wait for io/aurora_redo_log_flush is coming from two update statements. If we were to investigate these update statements we would find that they are single-row update statements that are not part of an explicit transaction. Aurora MySQL by default uses implicit commit (autocommit) for each execution of DML statements outside a transaction. Commits require a durable write, so after every update there is a wait for writing to stable storage. To optimize this, you could do a batch of updates, for example 50, and then commit, or group multiple different DML statements into transactions that commit at the end.
Here is a micro-benchmark example. In the following case I ran 4 concurrent sessions each with 10,000 updates for a total of 40,000 updates. In the first case, autocommit is turned on and the 40,000 updates took 40 seconds to complete. The connections spent most of their time waiting for io/aurora_redo_log_flush. In the second case, autocommit is off and the 40,000 updates only took 10 seconds to execute. You can see the results visually in the load chart below. On the load chart below we can see the first run with autocommit on the left which shows up as a 40 second wide AAS load of 4 and most of the load is waiting for “io/aurora_redo_log_flush”. After that there is a 20 second idle gap while the script sleeps. Finally there is a 10 second wide spike representing the workload with autocommit off and waiting mainly on “io/aurora_respond_to_client”. The second run of the load is 10 second which is 4x faster than the first and all the wait for “io/aurora_redo_log_flush” is gone. All the wait time from “io/aurora_redo_log_flush” was eliminated by turning off autocommit, which commited after every update, and instead committing at the end of each batch of records.

Summary
Performance Insights helps you quickly and easily identify performance bottlenecks on Aurora MySQL and helps you discover where to look to address those bottlenecks. By default, Performance Insights is enabled at database creation. The control for enabling Performance Insights can be found in the RDS Console when you create or modify a database instance. Performance Insights is fully automated, and in most cases the overhead is around 1 percent of a vCPU. All the data storage, processing, and aggregation are automatically managed and done outside of the database host to minimize impact on the database.
If you have comments about this blog post, submit them in the comments section below.
About the Author
 Kyle Hailey is a product manager for Performance Insights at Amazon Web Services.