AWS for Games Blog
Using Amazon CloudWatch Internet Monitor for a Better Gaming Experience
This blog post describes how gaming customers can use health metrics to more easily monitor game performance by using Amazon CloudWatch Internet Monitor. It provides an example overview of an online-gaming application architecture, outlines everyday issues and challenges with monitoring performance and availability for gamers, and describes how you can use Internet Monitor to identify and address latency and availability issues for gaming applications. Note that this blog post assumes a basic familiarity with Internet Monitor, such as the information covered in the earlier blog post, Introducing CloudWatch Internet Monitor.
Several gaming companies take advantage of Amazon Web Services (AWS) services, using its breadth and depth in hardware as well as software components. Multiplayer online games require fast, stable internet connections to ensure smooth, seamless gameplay, so internet speed and connectivity are a significant priority for gamers. Not all gamers understand latency, but it’s one of the single highest priorities for a game developer to ensure a smooth experience for players. Internet Monitor can help you quickly pinpoint where users are experiencing latency issues globally, and give insights into improving performance for your internet-facing applications on AWS.
The architecture of gaming workloads
When multiplayer game servers run in the cloud, game sessions are hosted on remote servers and connected to end devices, such as computers, tablets, or smartphones. Because video and audio stream onto local devices, gamers can enjoy interactively playing with others, and there’s no requirement for specific high-end gaming hardware. The following diagram shows an example gaming application architecture and typical AWS components.
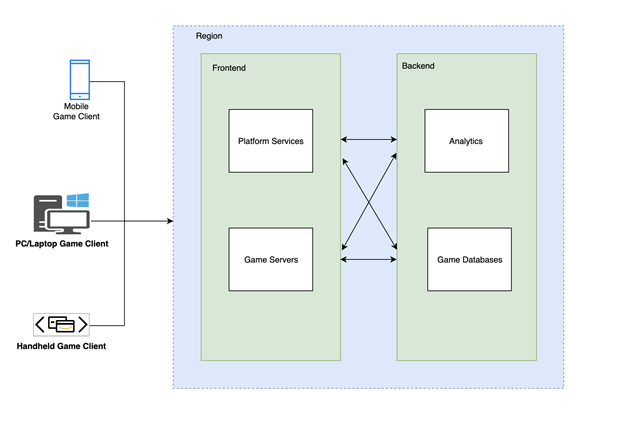
Figure 1. Example architecture for gaming applications in AWS
- The game client is a computer, tablet, or handheld gaming device. It’s the player’s device for accessing the game portal and playing games.
- Frontend servers include the game servers, which host the game itself and platform services for the game, which provide features like leaderboards, matchmaking, chat services, inventory management, and analytics.
- Backend servers include servers that provide game database and analytics services (either regional or centralized), maintain game state, store analytics, and keep game servers up-to-date.
Running game servers in the cloud can provide a scalable, high-performance platform for players to enjoy games from anywhere in the world. However, given that the internet is a distributed environment with users competing for resources, intermittent issues may occur. The following section runs through common internet issues.
Internet issues for game studios
The following are some common internet issues that gamers who use cloud gaming can encounter:
- Latency and lag: Latency is colloquially known by players as “ping time” or “round-trip time”. This is the time it takes for data to travel from a player’s device to the game server, and back. High latency can cause delays and lag in the game, which can affect the player’s ability to play because they are out of sync.
- Packet loss: Packet loss is when some of the data sent from a gamer’s device to the game server is lost. This can lead to glitches in the game and even game crashing, which is frustrating for players because they miss what’s happened.
- Bandwidth: Bandwidth is the amount of data that can be transferred over an internet connection per second. High-quality games require more bandwidth to run smoothly, and a slow internet connection can result in choppy gameplay and longer load times.
Challenges with monitoring online games
The quality of a player’s experience is tightly integrated with the performance of their internet connection. When the connection quality degrades, identifying what’s causing a specific internet issue isn’t easy because there are multiple factors that can be responsible, and it can be hard to track down which one is the actual problem. Here are some of the challenges:
- Internet performance is made up of many different providers
- Lack of visibility when an Internet Service Provider (ISP) has network issues
- Gathering data about ISP performance to drive improvements
The following diagram helps illustrate how complex troubleshooting internet issues can be. In the diagram, game servers located in one AWS Region are connected over the internet to play games. ISPs typically have multiple points of presence (POPs) for accessing and connecting to the internet. There can be an internet outage at a POP or another access point. Game developers must test, monitor, and troubleshoot to detect these kinds of internet problems.
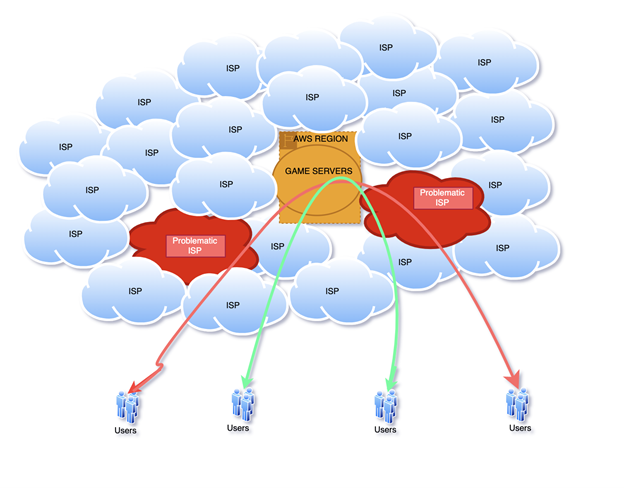
Figure 2. Clients and ISP networks accessing the AWS cloud
It is essential to monitor traffic into AWS to understand how your internet-facing game performs. However, collecting and tracking internet traffic data can be difficult and expensive. Network capture tools can be intrusive and create machine overhead for players. You can avoid these problems by using Internet Monitor with your game.
Addressing customer needs
With Internet Monitor, you can monitor internet problems across multiple geographic locations and internet service providers (Autonomous System Numbers or ASNs), without writing a single line of code or putting network capture tools on your players’ machines. When an issue occurs, Internet Monitor can help you visualize its impact and pinpoint the locations, including ISPs, affected. You can see a global view of traffic patterns and health events, and dig into details about events based on the event’s location. You can also learn about actions that you can take to improve your game’s network experience for players in the future by rerouting through different ISPs or by using other AWS Regions or services.
Customer Use Case
In this walkthrough, we illustrate how Internet Monitor can help you monitor and improve your game’s performance. The use case is a game studio that has launched a global game in an AWS Region. The studio is concerned about providing a smooth gaming experience for all players, and wants to respond quickly to any network issues. The studio wants to see all client traffic for its game, so it chooses to monitor 100% of internet-facing traffic.
The studio wants to focus on improving performance across its top 100 cities, then pinpoint areas experiencing issues and adjust the traffic that it monitors accordingly. To identify where player experience can be improved, the studio will use time to first byte (TTFB) as a key metric. TTFB measures how long it takes to transfer the first byte of data from the server to the game client. The studio would also like to optimize future game launches by deploying on servers in the Region that will reduce TTFB for the most gamers. By doing this, they can improve game play for their biggest player base.
Step 1: Create a monitor, following the steps in the Internet Monitor user guide, and select 100% of traffic, as shown in the following screenshot:

Step 2: After about 10 minutes, you can see suggested optimizations for the Top 10 locations in the Internet Monitor dashboard (see the Traffic insights tab). To see suggestions for a larger set of locations, follow these steps to run a query in CloudWatch Log Insights.
- In the CloudWatch console, choose Log Insights.
- Select the log-group “/aws/internet-monitor/<monitorname>/byCity”.

- Select an appropriate time period, and run the following query:
fields @timestamp,
clientLocation.city as @city,
clientLocation.subdivision as @subdivision,
clientLocation.country as @country,
`trafficInsights.timeToFirstByte.currentExperience.serviceName` as @serviceNameField,
concat(@serviceNameField, ` (`, `serviceLocation`, `)`) as @currentExperienceField,
concat(`trafficInsights.timeToFirstByte.ec2.serviceName`, ` (`, `trafficInsights.timeToFirstByte.ec2.serviceLocation`, `)`) as @ec2Field,
`trafficInsights.timeToFirstByte.cloudfront.serviceName` as @cloudfrontField,
concat(`clientLocation.networkName`, ' (AS', `clientLocation.asn`, `)`) as @networkName
| filter ispresent(`trafficInsights.timeToFirstByte.currentExperience.value`)
| stats avg(`trafficInsights.timeToFirstByte.currentExperience.value`) as @averageTTFB,
avg(`trafficInsights.timeToFirstByte.ec2.value`) as @ec2TTFB,
avg(`trafficInsights.timeToFirstByte.cloudfront.value`) as @cloudfrontTTFB,
sum(bytesIn + bytesOut) as @totalBytes,
latest(@ec2Field) as @ec2,
latest(@currentExperienceField) as @currentExperience,
latest(@cloudfrontField) as @cloudfront,
count(*) by @networkName, @city, @subdivision, @country
| display @city, @subdivision, @country, @networkName, @totalBytes, @currentExperience, @averageTTFB, @ec2, @ec2TTFB, @cloudfront, @cloudfrontTTFB
| sort @averageTTFB desc | limit 100

The query sorts by highest average TTFB for the top 100 locations, so that you can focus on improving those areas first.
Step 3: To determine which Region to launch your next server in to improve performance for the most players, see the Traffic insights tab in Internet Monitor. Under Traffic optimization suggestions, you can sort by a client location or TTFB, for example, and then select different service options to see the impact on TTFB.
For example, you can select Amazon Elastic Compute Cloud (EC2) or Amazon CloudFront for a Region, to see what the predicted average TTFB is compared to the current TTFB. The table shows you if the current path is already optimized, or if making a change will lower the TTFB for a location and ASN. Viewing the options and recommendations can help give you a head start on planning new setups for your application, to improve performance.
Sample optimization suggestions are shown in the following screenshot. We’ve sorted the table by highest current TTFB, to look at the biggest issues.

London, England, United Kingdom has the largest amount of total traffic and the highest TTFB. Internet Monitor suggests that to reduce TTFB for the most players, optimizing its next game release, the game studio should launch its next server in eu-west-2 (shown under Lowest TTFB setup).
Conclusion:
In this blog post, we described how you can improve your players’ experience by using Amazon CloudWatch Internet Monitor. Using the connectivity data that AWS captures from its global networking footprint, you can identify internet issues that impact game players, and use data and recommendations to improve connectivity by shifting traffic to different AWS Regions or services. To learn more about Internet Monitor, see the documentation.
Blog authors: David Fowler & Prashanth Nalubandhu