AWS Cloud Operations Blog
Accelerate troubleshooting with structured logs in Amazon CloudWatch
Troubleshooting often involves complex analysis across fragmented telemetry data. While alarms on metrics can signal high-level deviations, deeper context often resides in other areas such as log messages, which help uncover the root cause. This disjointed approach not only consumes time and effort, but also inflates telemetry costs.
In this post, we’ll showcase how structured logging with Amazon CloudWatch resolves these challenges. By harnessing structured logging, you can unlock CloudWatch’s array of features, including CloudWatch Logs Insights which provides query and visualization capabilities for logs, Embedded metric format (EMF), which facilitates multi-dimensional analysis, and CloudWatch Contributor Insights offers advanced analytics to identify trends and anomalies in log data. All these capabilities are enabled from the same structured log.
What is structured logging?
Logs are timestamped text records with metadata such as requestId, application name and severity. Structured logging implements a consistent logging schema that makes it easy for users and applications to read, search, and analyze logs. Structured logging most often uses JavaScript Object Notation (JSON).
Structured JSON logs represent data as key-value pairs where each entry describes relevant information emitted by the system. For example, the structured log below describes an error on a web server. It includes the timestamp of when the error occurred, the originating IP address of the request, and the URL of the resource requested in a JSON object.
{
	"timestamp": "2024-01-12 00.00 UTC",
	"host_ip": "192.168.1.1",
	"path": "/home/main",
	"error_id": "123",
	"error_message": "file corrupted"
}
The format of the structured logs enables the log information to be in a reader-friendly and machine-friendly manner and allows nesting or hierarchies if needed. This makes it efficient to query the logs and transform the values as needed, which accelerates troubleshooting.
Setup
We will use the open source sample application from the One Observability Workshop. This application is a pet adoption site that allows users to adopt bunnies, puppies, and kittens. The Pet Details page allows users to browse the pets available for adoption and select the pet they want to adopt. It is an important page and having consistent, fast responses on this page is critical for our customers to adopt these pets.
The application uses the structured logs to capture events when viewing pets for adoption. The example below describes the adoption of a one-year-old puppy being viewed by “Saanvi Sarkar” located in USA. This structured log will be the basis of our analysis. We will analyze the adoption process, customer locations, and look for opportunities to improve the adoption process.
{
	"PetAge": 1,
	"PetId": "001",
	"PetType": "puppy",
	"Latency": 62,
	"customer": {
		"ID": 1695798641753576756,
		"FullName": "Saanvi Sarkar",
		"Country": "USA"
	},
	"method": "View Pet Details",
	"traceId": "1-6513d571-344b7d2e5eae71655a1cfd7c",
	"ts": "2024-01-12T04:31:19.802967467Z",
	"_aws": {
		"Timestamp": 1705033879000,
		"CloudWatchMetrics": [{
			"Namespace": "PetSite",
			"Dimensions": [ [ "PetType"] ],
			"Metrics": [{
				"Name": "Latency",
				"Unit": "Milliseconds"
			}]
		}]
	}
}
Using EMF to analyze logs and take actions
Embedded metric format (EMF) is a JSON specification that uses structured logging. It instructs CloudWatch Logs to automatically extract metric values embedded in structured log events. This enables us to visualize, build dashboards, create alarms or set up automation based on the extracted metric values. EMF allows us to ingest high-cardinality data from application logs and generate actionable metrics from them.
To use EMF, we can use open-source client libraries to create and send logs to CloudWatch Logs. Alternatively, we can manually include EMF metadata (EMF specification) to our JSON structured log, guiding CloudWatch on how to generate metrics from the given logs. Once we have included the EMF metadata (the “_aws” property from the structured log above), we can readily observe the metrics in the CloudWatch console.
Given the importance of the Pet Details page, we want to be made aware of any increase in latency on the page so you can quickly investigate and address the issue. This page has been set up to use structured logging as described above, which enables us to extract the “Latency” in milliseconds grouped by PetType dimension. Once the metric is available in CloudWatch, we can take actions on it. For example, we can set alarms on the backend latency metric extracted using EMF to be triggered in case the backend latency goes beyond 300ms.
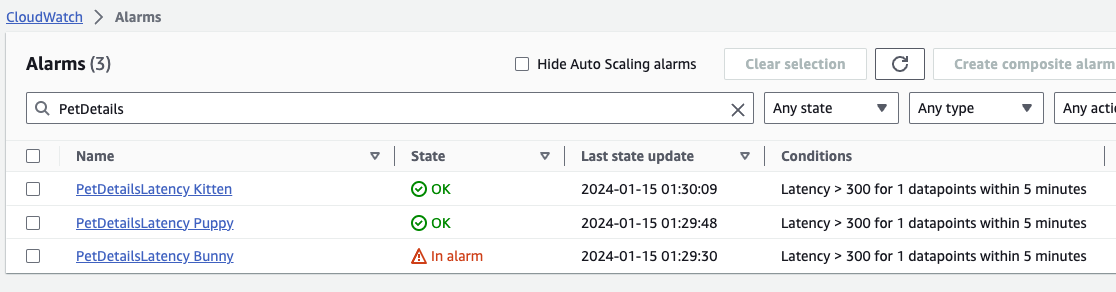
Figure 1: Alarms on the backend Latency metric extracted using EMF for each pet type
We notice that the alarm is triggered when the “Latency” metric is higher than expected on the Pet Details page for the PetType “bunny”. Once we have identified that the backend latency is high, we may want to understand if this higher latency is localized to bunnies or is it a problem across all PetTypes, as it may determine the next step in our investigation.
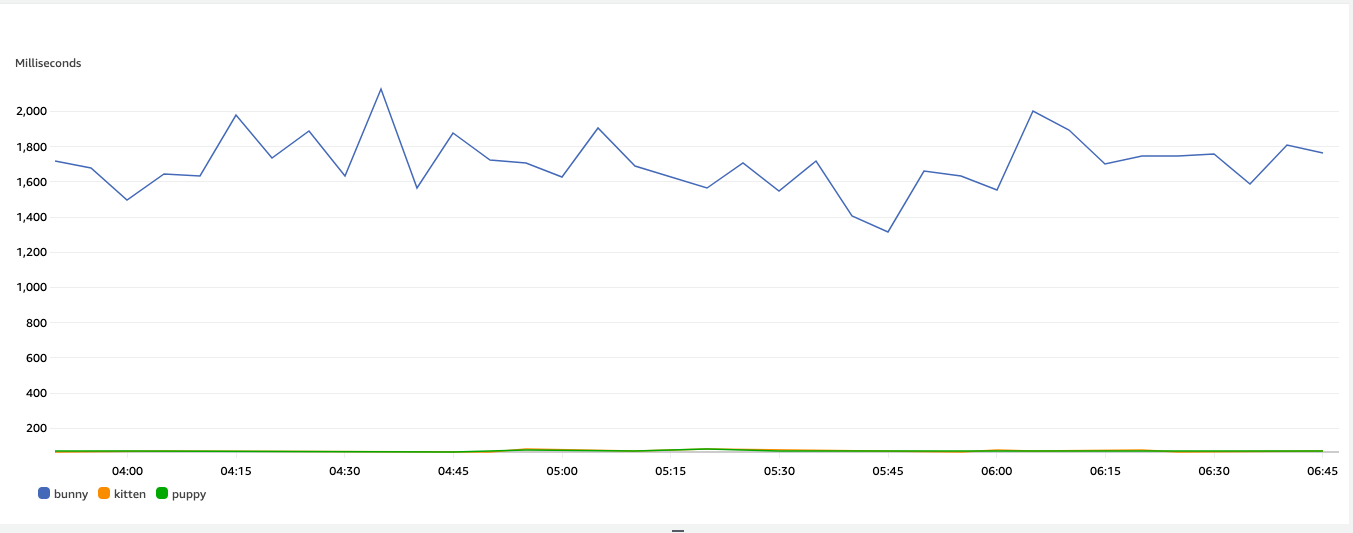
Figure 2: Adoption Latency metric graphed for each of the Pet Types
This shows that the adoption of PetType “bunny” is taking ~2 seconds, while the adoption of ”kitten“ or ”puppy“ is below 200 milliseconds. Using CloudWatch alarms on the metrics extracted via EMF, we are able to narrow down the increase in latency in the Pet Details page to one PetType (bunnies). Now, our next step is to dive deeper into PetType “bunny” to uncover what is driving the increase in latency. And since we are capturing all the relevant information in structured logs, Logs Insights is the perfect tool for the job.
Using CloudWatch Logs Insights as a time machine to analyze logs
CloudWatch Logs Insights is a fully integrated, interactive, pay-as-you-go log analytics service that enables us to visualize, interactively search, and analyze our log data in Amazon CloudWatch Logs. We can perform queries to analyze operational issues. It includes a purpose-built query language, query auto completion, log field discovery, sample queries, and machine learning backed pattern detection to help us get started. It supports queries with aggregations, filters, and regular expression to analyze logs.
Continuing the Pet Details example from earlier, we write a query to look at Latency for bunnies. This will enable us to understand if this issue is across all bunnies, or particular ones.
The query below will filter all logs for PetType “bunny”, aggregate the p99 for the Latency field, group by PetId, and sorted by slowest to fastest. P99 shows the worst-case response time 99% of the time, helping understand how a system performs in real-world situations.
filter PetType in ["bunny"]
| stats pct(Latency, 99) as p99 by PetId
| sort by p99 desc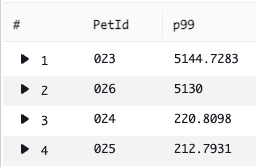
Figure 3: Result of query aggregating p99 Latency for PetType “bunny” sorted slowest to fastest grouped by PetID
Once we graph the results of the query, we notice that two bunnies (PetId 023 and 026) are significantly slower compared to the rest of the bunnies.
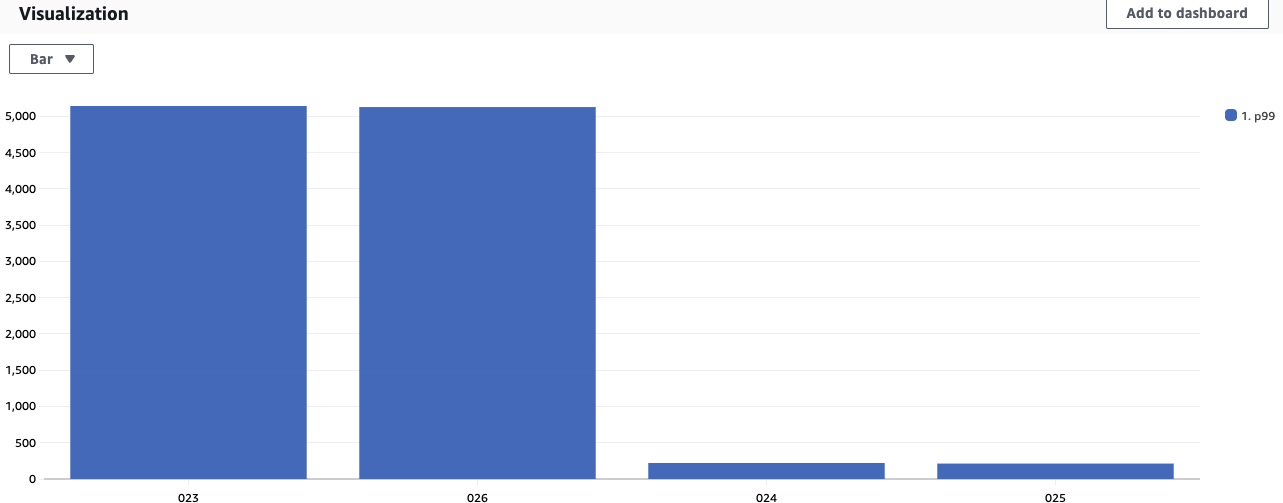
Figure 4: Graph visualization of result of query aggregating p99 Latency for PetType “bunny” sorted slowest to fastest grouped by PetID
We can dive further to understand when the latency started increasing for these two bunnies by using the query below.
filter PetType in ["bunny"]
| filter PetId in ["023", "026"]
| stats pct(Latency, 99) as p99 by bin(1h) as time
| sort by time
This query provides you with the visualization of when this issue first started, which was around 11:10am local time. As you can see, Logs Insights can serve as a time-machine for metrics enabling you to visualize data points from the past, even if you didn’t proactively have a metric defined.
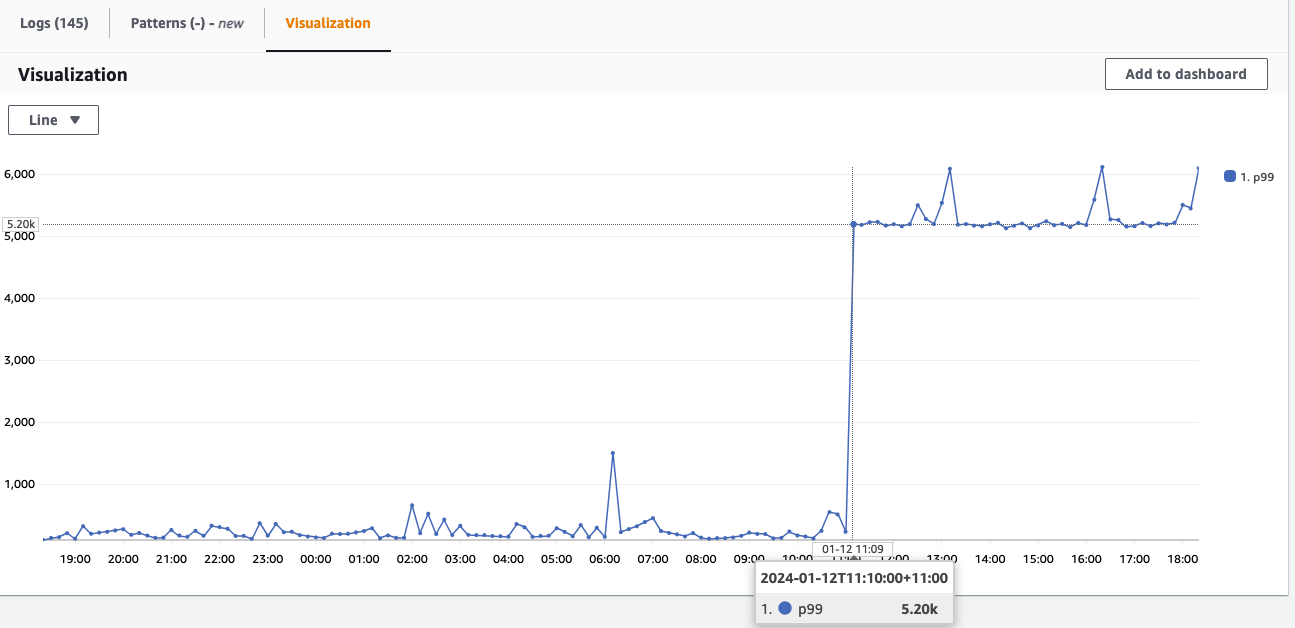
Figure 5: Visualization of when the Latency increase for the PetIds 023 and 026 started
As you can see, Logs Insights and structured logs provides us the ability to drill deep into our application to understand exactly which pets are impacted, and when this started. This will allow you to focus on the changes in the environment during that time to understand the root cause, which is beyond the scope of this blog post.
Using Contributor Insights to monitor and alarm on high-cardinality patterns
Ad-hoc queries using Log Insights can uncover some interesting facts about our application, but ideally we want to be able identify any PetIds with significantly higher latency proactively and automatically to accelerate detection and remediation. This is where we can use Contributor Insights to continuously monitor our structured logs and identify anomalies. Contributor Insights enables us to analyze log data and create time series that visualize metrics about the top-N contributors, the total number of unique contributors, and their usage. It is especially powerful in monitoring high-cardinality fields such as customer names, site-ids etc, which cannot be effectively monitored as metric dimensions. For example, if we would like to identify customers impacted by the application issues, we can use Contributor Insights.
We can use the property PetId to create a rule to identify which specific pets are seeing the high latency. The below example shows how we can create this rule in Contributor Insights using AWS Management Console. To do this, we choose “Create rule” within Contributor Insights and select the log group that we want to analyze. We specify the format of our logs and list the fields to build our analysis on. For example, we can create a custom rule for the log group /ecs/PayForAdoption that focuses on monitoring incoming logs for PetIds where Latency is greater than 150ms. It will provide a count on the number of PetIds that surpass this threshold along with unique PetIds that are impacted so you can quickly mitigate the problem. We can define this rule in a guided manner within CloudWatch console or, in JSON format in the Syntax tab as follows:
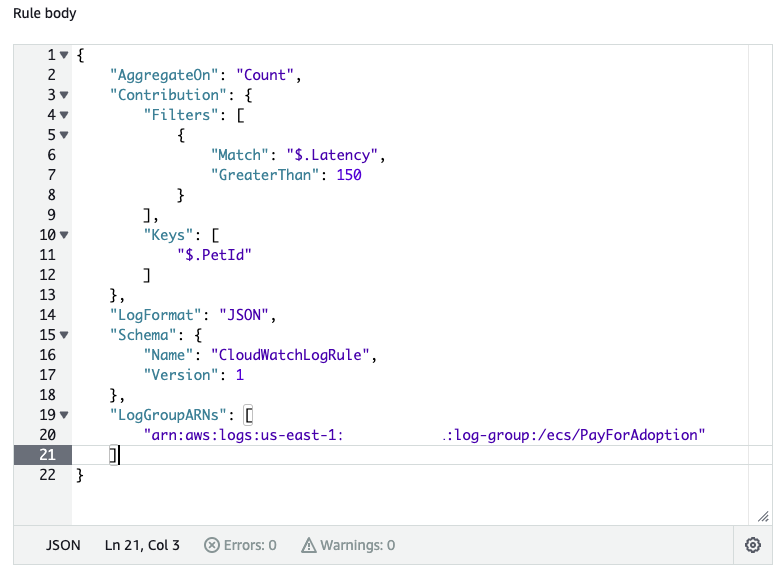
Figure 6: Creating a Contributor Insights custom rule for the log group /ecs/PayForAdoption that focuses on monitoring PetIds where Latency is greater than 150ms in JSON
When we set up the above rule, Contributor Insights will monitor incoming logs based on the rules specified above, and provide the following results, visible in the figure below.
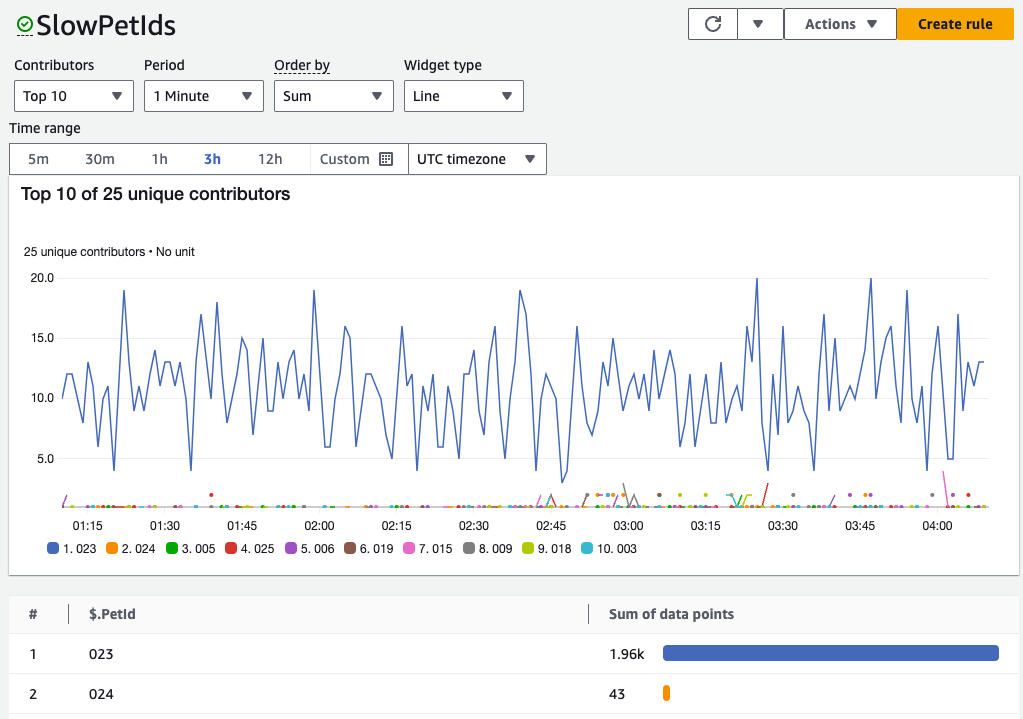
Figure 7: Contributor Insights rule results showing number of unique PetIds exceeding 150 ms in Latency
We can visualize our structured logs and identify key contributors in real time for our application. In this case, we see that PetId 023 has significant performance problems.
Integrating this rule with CloudWatch Metrics will allow us to build dashboards, alarms, and automations. We can view this rule in CloudWatch Metrics by using the Actions menu.
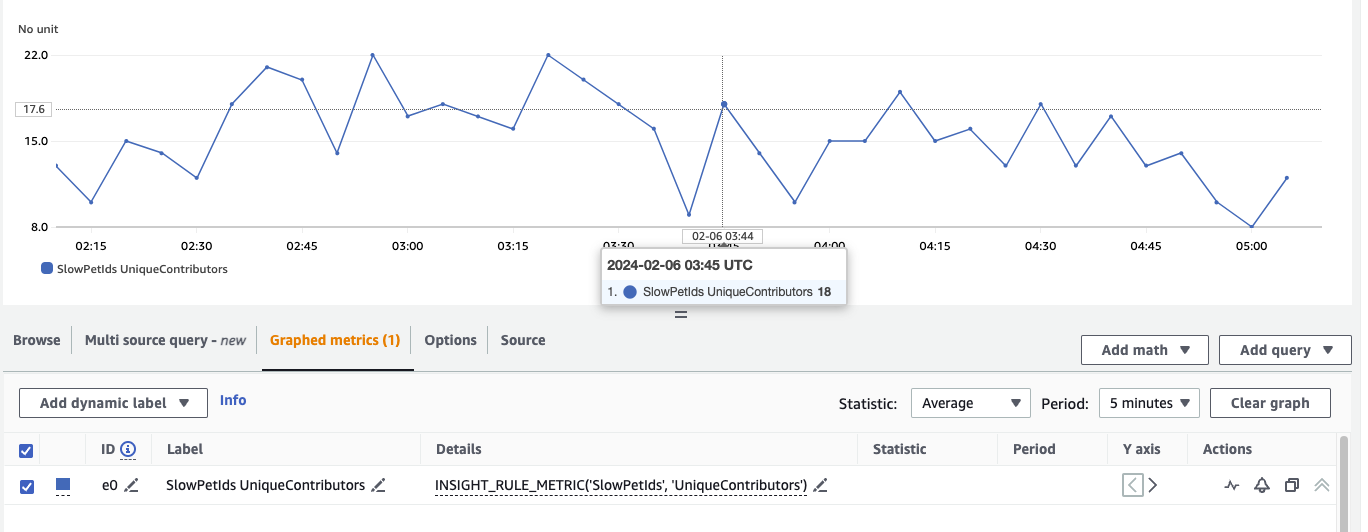
Figure 8: Counting the number of unique PetIds exceeding 150 ms in Latency extracted using Contributor Insights
By using the metric math function INSIGHT_RULE_METRIC in Figure 8, it allows us to add data from Contributor Insights to the Metrics tab as seen above. We can graph metrics generated by the rules, such as UniqueContributors, MaxContributorValue, or SampleCount as some examples.
Contributor Insights can analyze any structured log format such as network and AWS Web Application Firewall (WAF) traffic, Amazon Virtual Private Cloud (VPC) flow logs, Amazon API Gateway logs among others. As shown above, you can also create Metrics and Alarms (including Anomaly Detection alarms) on Contributor Insights rules.
Conclusion
In this blog post, we introduced structured logging (specifically JSON) and how it can help enhance your observability workflows.
We started with an EMF structured log which automatically extracted latency metrics to alarm on. When this alarm was triggered, we were able to view the underlying metric and its dimensions to narrow down our increased latency problem to a specific PetType (bunny). Then, because we were able to add additional context in the underlying log, we leveraged Logs Insights to further analyze historical latency trends across each PetType to uncover the two specific PetIDs which were driving our issue. Finally, to ensure we have better and proactive visibility to such issues in the future, we leveraged Contributor Insights to visualize and monitor PetIDs with the highest latency, without needing to create an individual metric for each.
All of these insights were derived from the same structured log, and highlights the power for various tools within Amazon CloudWatch, especially with structured logging. You can get started with embedded metric format, Logs Insights, and Contributor Insights today in all Regions where CloudWatch is available.