AWS Cloud Operations Blog
Alarms, incident management, and remediation in the cloud with Amazon CloudWatch
Application workloads being built for the cloud are getting easier to deploy with tools like Amazon Elastic Kubernetes Service (Amazon EKS) and Amazon Elastic Container Service (Amazon ECS and AWS Fargate), infrastructure as code (IaC), and full-scale DevSecOps pipelines. But there’s more to migrating workloads than ease of development and deployment: application workloads still need to be monitored. “Incidents” are both known and unknown events that disrupt your applications’ performance and resiliency, and can negatively impact your business.
With Amazon CloudWatch, you can monitor your application workloads, create alarms, set thresholds for alarms, and even create self-mitigating responses or send notifications in near-real time to your operations team. In this post, we discuss in detail alarms, incident management, and remediation.
What is an incident and why is it important?
According to the Information Technology Infrastructure Library (ITIL), an incident is an “an unplanned interruption to an IT service or reduction in the quality of an IT service.” Many of us have experienced such issues where the pager goes off in the early morning hours, confusion ensues about whether the incident is negatively impacting your customers, and management is demanding answers from those trying to piece together the evidence trail to identify the root cause and bring the service back to a stable operating state. Such incidents aren’t fun for anyone.
It’s important to understand what kinds of issues cause these incidents. When you understand the root cause, you can monitor, alert, and mitigate quickly to minimize the duration of the disruption. Here is a small list of examples:
- Code deployments – In the cloud, this process is now two-fold. A deployment gone wrong could potentially affect either the infrastructure or the software running on the infrastructure. With IaC, someone might set up the autoscaling group of a service with a maximum that’s too low, causing the system to stall when load goes above normal because it can’t scale to take the increased traffic. With a software deployment, you could be deploying new code that can’t process a particular data attribute or type because your testing framework didn’t account for it, so the application throws an exception and doesn’t process the data as expected.
- Software issues in running workloads – These software-related issues aren’t caused by a recent deployment but by something else, such as a memory leak or a software bug based on an unknown condition. Ideally these are caught in testing, but they do happen.
- Infrastructure issues – Infrastructure outages can occur due to manual configuration errors such as network settings modifications or hardware failures.
CloudWatch provides monitoring for AWS resources for metrics like Amazon Elastic Compute Cloud (Amazon EC2) instance CPU, network I/O, and more. These baseline metrics are often enough to help get your application workloads enterprise-
ready, but you can add more metric collections if needed, such as application-specific metrics. You can configure Amazon EC2 Auto Scaling to use CPU metrics to determine when the autoscaler needs to scale out the number of instances to meet the workloads requirement. You can also use it to scale in when the CPU utilization drops. However, what if you wanted to use a different metric, such as number of connections, or queue depth, which are not included in CloudWatch by default. CloudWatch allows you to push custom metrics specific to your application workload needs. For more information, see How to better monitor your custom application metrics using Amazon CloudWatch Agent.
Creating alarms and setting thresholds
When you’re collecting the metrics you need from your application workload in CloudWatch, you need to determine what you want to alarm on. When to alarm is an important decision: you are effectively saying, “The system has hit a problem that someone should know about.” If you alarm too much and too often, alarms tend to get ignored – the exact opposite of what you want. If one important alarm is lost in a sea of less-critical alarms, a service disruption could go on longer than required and have a negative impact on your business.
When you create an alarm, you first select a metric. Keep three key concepts in mind:
- The threshold for the alarm – For instance, setting an Amazon EC2 Auto Scaling event to scale out when CPU utilization exceeds 90% may be too high, because you may not be able to get new resources started in time before the CPU saturates at 100%. On the other hand, setting the scale-out event at 50% CPU utilization may be too low, causing more resources to be added when the CPU would have only increased to 65%, which the workload would have handled without needing a scale-out event.
- The statistic you’re measuring – This statistic defines if you’re looking at the metric in question as an average value, summed value, a maximum value, a minimum value, a P90 value, or a sample count. Looking at the metric value with different types of statistical variance gives you more flexibility in setting alarms. For instance, percentiles are very powerful in making good approximations and can provide insights into the consistency of your applications’ response time compared to that of an average.
- The period, threshold, and data points to alarm – Understanding how these features work together helps make sure that you don’t over-alarm, and that the system has a chance to self-heal before an alarm is triggered.
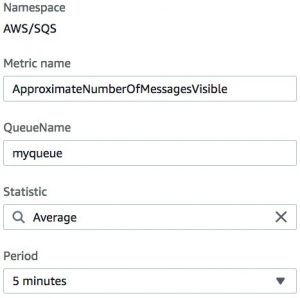
In the following use case, I have an application that uses an Amazon Simple Queue Service (Amazon SQS) queue and I want to alarm when the total number of visible messages (ready-to-be-processed messages) exceeds 1 million. From both testing and early production data, we know that the queue usually has no more than 100,000 messages.
- On the CloudWatch console, choose Create alarm.
- Choose the metric SQS namespace.
- For Metric name, enter
ApproximateNumberOfMessageVisible. - For QueueName, enter a name.
- For Statistic, choose Average (Max may also be appropriate).
- For Period, choose 5 minutes.
- For Threshold type, select Static.
- Select Greater.
- For Define the threshold value, enter
1000000.
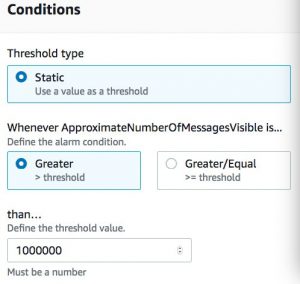
- Under Additional configuration, set Datapoints to alarm to 3 out of 3.
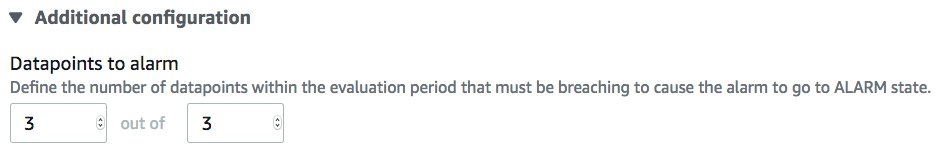
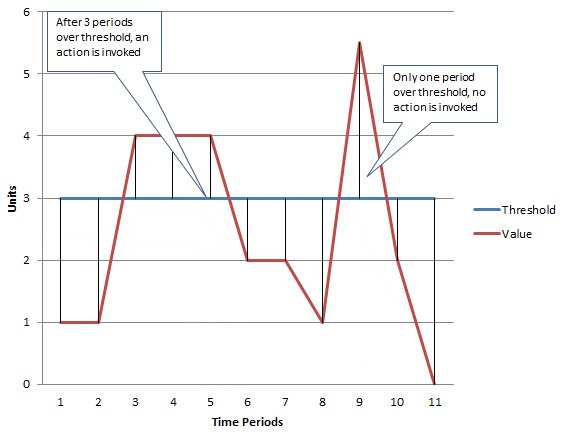
The Datapoints to alarm configuration allows you to create a soft vs. hard state before the alarm is triggered and action is taken. For this use case, if the queue is greater than 1 million messages in the first 5-minute period, the alarm sees it but doesn’t act. If in the next 5-minute period it’s still over 1 million messages, it sees it but still doesn’t act. If in the third 5-minute period the messages are still more than 1 million, the alarm changes from a soft to a hard alarm state because it saw three consecutive alarm criteria met. In essence, this means that the issue must be an issue for three consecutive periods or 15 minutes.
Thinking of this another way, if in the first 5-minute period there were over 1 million messages in the queue and it alarmed, but in the next 5-minute period the consumers of the messages had already processed a third of the queue, the alarm would have been sent out prematurely and the operations person who woke up at 3:00 AM to check to the queue would see that the problem had resolved itself, and would be less interested in responding to any future 3:00 AM queue depth pages. The following graph illustrates the threshold changing over time.
That doesn’t mean, however, that all alarms require action. Sometimes, you may just want to send a notification for informational purposes; other times you may want to send a notification that requires manual intervention. These are some of the criteria between a critical alarm vs. informational alarms. In our use case, if our queue reaches a depth of 1 million messages, I want a notification to be sent to the operations email distribution list. This is strictly informational, to make aware that at times we are greatly over our normal message counts. Informational notifications can provide clues on new trends and changes, such as the growing popularity of your product in another part of the world, and help reset the threshold before an outage actually occurs.
With CloudWatch, you can also combine alarms into a single composite alarm. This allows you to monitor the health of a larger ecosystem such as a web application, a large scale workload, a Region, or even Availability Zones by reducing the number of alarms associated with the resources that make up the ecosystem. For more information, see Improve monitoring efficiency using Amazon CloudWatch Composite Alarms.
Another way to monitor metrics that finds changes in normal behavior and learns from it is to incorporate AI or machine learning into your monitoring, as introduced in CloudWatch earlier this year with Anomaly Detection. For more information, see How to set up CloudWatch Anomaly Detection to set dynamic alarms, automate actions, and drive online sales.
Types of actions to take based on alarm state
It’s important not only to trigger alarms for the right reasons , but also to is take actions based on alarms. Each alarm you configure triggers once per the criteria you set. In our use case of the queue, it triggers when three consecutive alarms are triggered three consecutive times, and then triggers again when another three consecutive occurrences are captured. What can you do with these alarms? What is the right action to take?
Email notifications
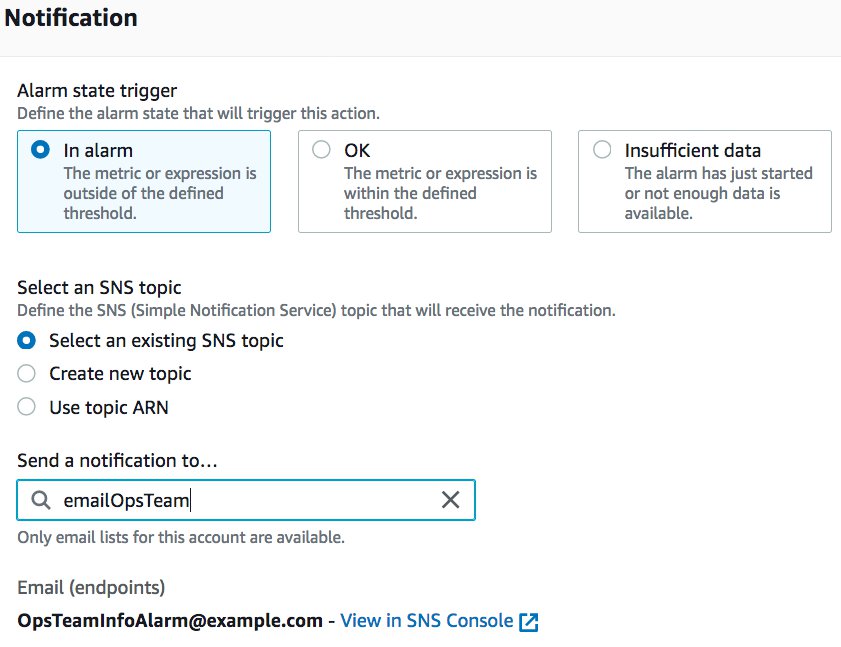
Notifications are a good place to start. With an alarm that has triggered the alarm state, you can set the alarm to send a notification to an Amazon Simple Notification Service (Amazon SNS) topic. This allows you to create subscriptions based on the topic. For this use case, I trigger an alarm and send an informational email any time the message queue has over 1 million visible messages. The following screenshot shows the configuration of this notification.
Here in the below screenshot, you can see that we have chosen “In alarm” option and selected the “Select an existing SNS topic” option to send notifications to the SNS topic on the account.
The OpsTeamInfoAlarm@example.com address receives the email but they aren’t paged. How do I page when there is a critical alarm? In this use case, I’m monitoring the APIs of my microservices and I find that one of my microservices or health-check API endpoints has been down two consecutive times over 10 minutes, which matches the alarm state of the CloudWatch alarm for that service. Someone needs to be alerted to investigate and hopefully restore the microservice to health. You can send text messages to the on-call team or integrate with a tool like PagerDuty to page them.
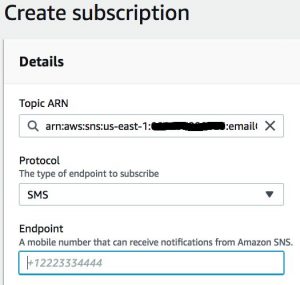
SMS text notifications
To send a text message, create an SNS topic. Then create a subscription and for Protocol, choose SMS and enter the phone number to text. Make sure the SMS is available in your Region and be aware that you may need to request a raise in SMS limits.
PagerDuty integration
To integrate with PagerDuty, you must be signed up as a PagerDuty customer. PagerDuty has released custom integrations with CloudWatch for both SNS topics and CloudWatch Events. If you follow the PagerDuty integration procedure, you can have your alarms sent to PagerDuty and to the pagers of your on-call staff.
Slack channel notification
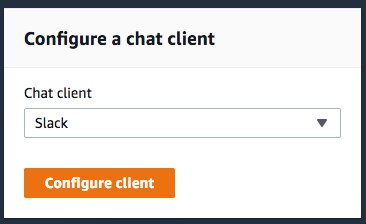
Many teams communicate in Slack channels because they’re an excellent way to create and communicate in virtual conference rooms when people aren’t sitting near each other or the gear that they are administering or operating. To post CloudWatch alarm data to a Slack channel:
- Configure the alarm to forward the details to an SNS topic (as for email or SMS text).
- In the AWS Management Console, navigate to AWS Chatbot.
- Choose Configure a chat client.
- For Chat client, choose Slack.
- Choose Configure client.
- In the top right corner of the next page, choose Sign in to another workspace or choose the workspace you are already signed in to.
- Read the details on permissions and choose Allow.
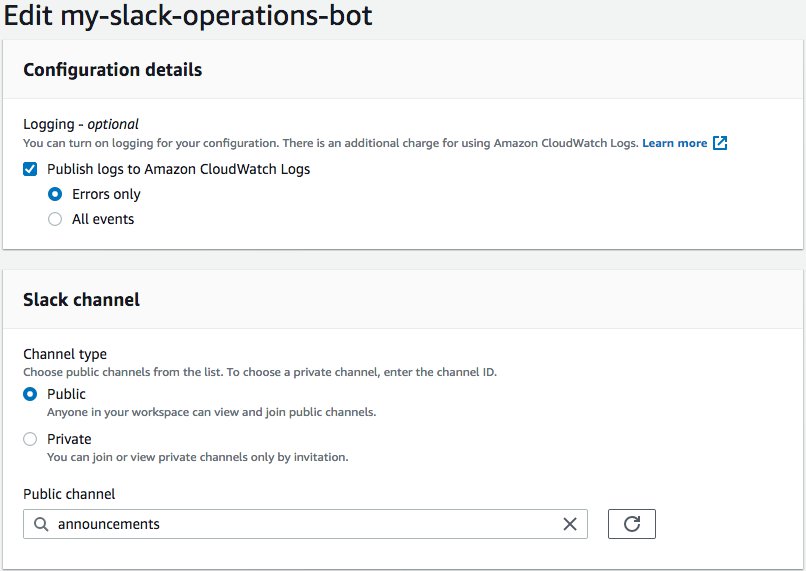
- In the Configuration settings of the workspace, you can choose to publish logs to CloudWatch Logs. For this use case, I select Errors only.
- For Channel type, I select Public and enter the channel name
announcements.
You need to give the chatbot an AWS Identity and Access Management (IAM) role. You can use one that you already created, but you need to make sure that you modify it for AWS Chatbot to use.
- Configure the chatbot by choosing an SNS topic in the Region you chose.
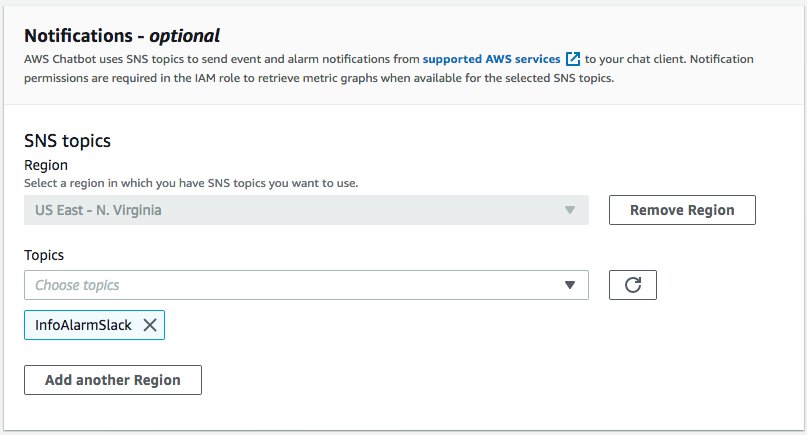
- Choose Save.
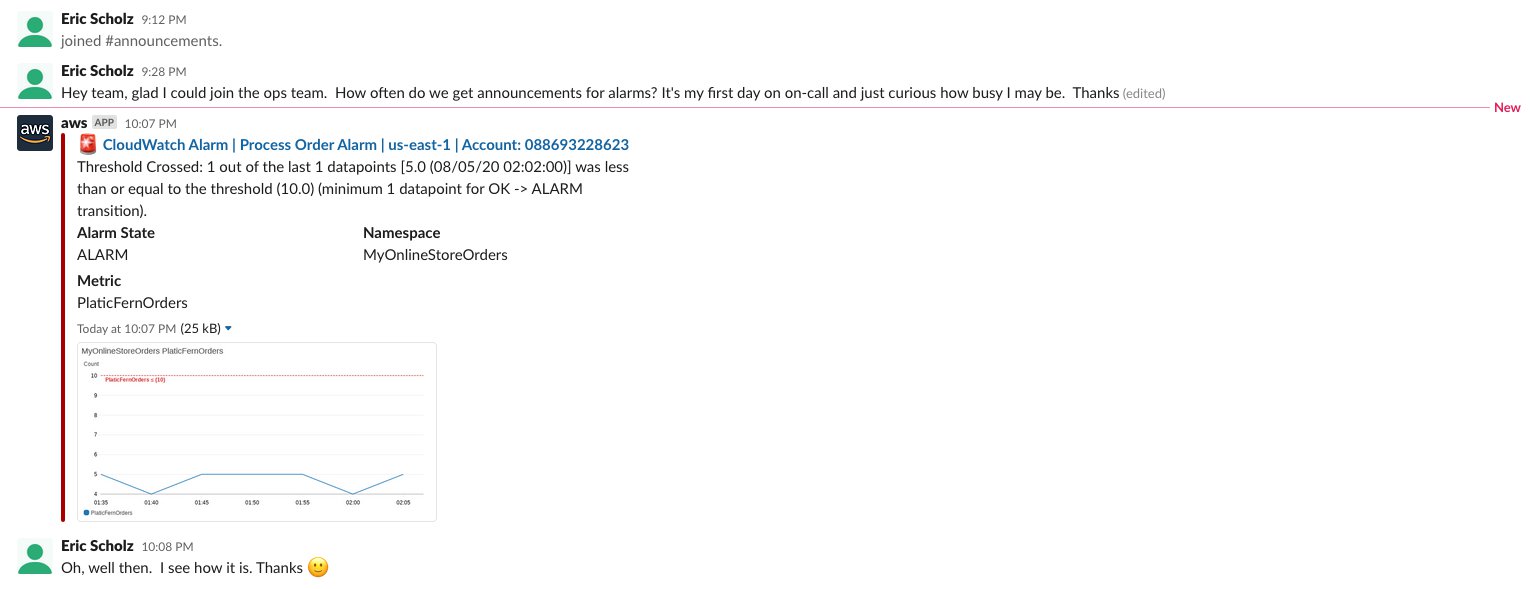
The chatbot is now subscribed to the SNS topic, which your alarm is configured to send details to when triggered. Did it work? The following screenshot shows the alarm messaging the ops team Slack channel.
AWS Chatbot can only receive events from the SNS topic from supported AWS services. If you send a notification event from a non-supported AWS service to your SNS topic, it doesn’t forward the published SNS message to your Slack channel. In the chatbot setup above, I selected to publish errors to CloudWatch Logs. The following screenshot shows a message in CloudWatch Logs intended for my Slack channel but published to SNS from an unsupported service.
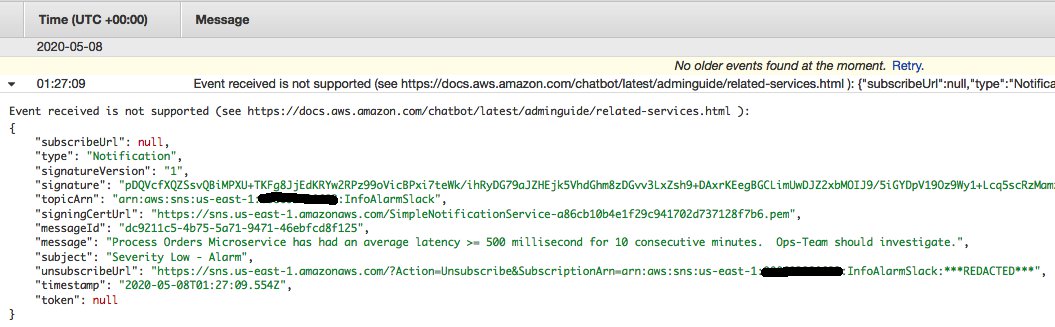
As described in the error message, “Event received is not supported” because I simply published a message directly to the SNS topic from the console. For more information about setting up AWS Chatbot with Slack, see Test notifications from AWS services to Amazon Chime or Slack chat rooms.
Automation with Auto-Scaling
As discussed earlier, you may use your monitoring and metrics to drive autoscaling events such as scaling out or out Amazon EC2 resources, as well as ECS containers.
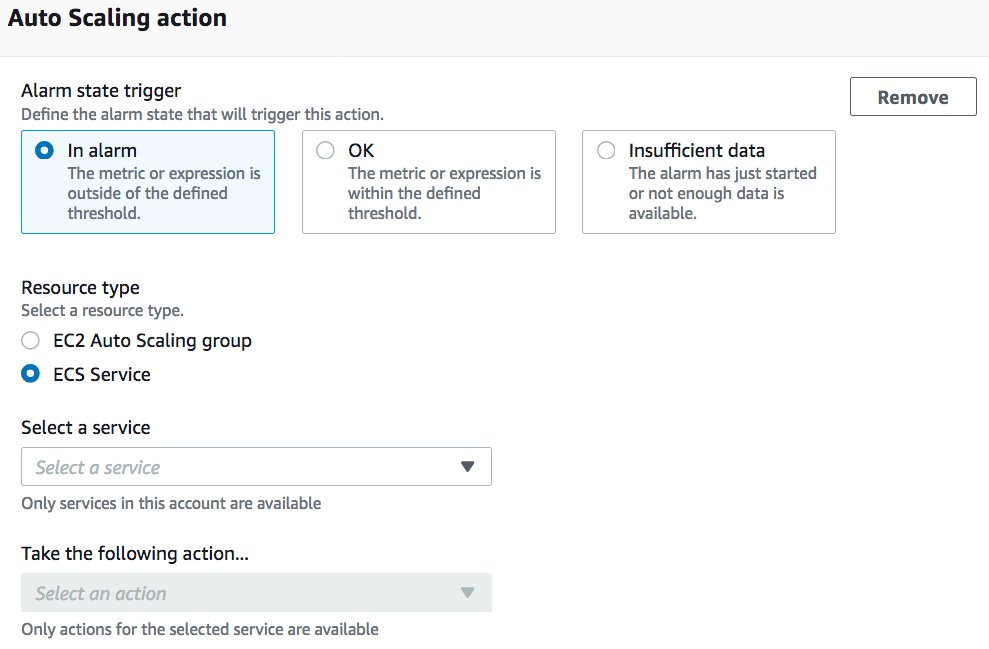
- When configuring the CloudWatch alarm, in the Auto Scaling section, for Alarm state trigger, select In alarm.
- For Resource type, select EC2 Auto Scaling group or ECS Service.
- For Select a service, choose your service.
- For Take the following action… choose the action to take.
Automation with AWS Lambda
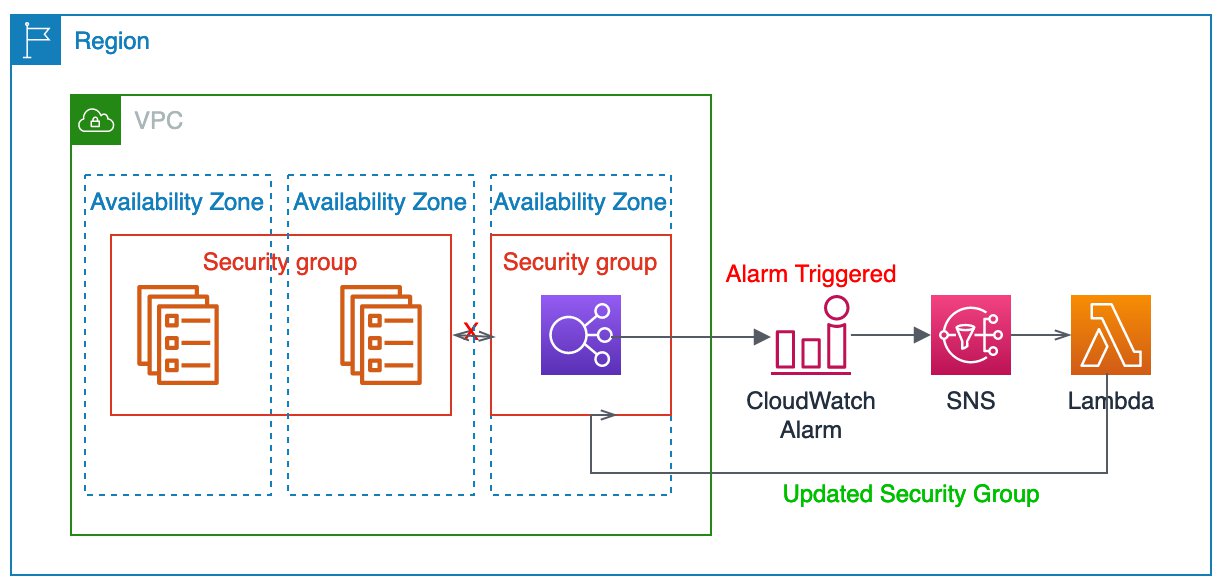
AWS Lambda is a great way to remediate incidents that occur based on your alarms. For instance, in this example, you’re monitoring your microservices API that is behind an Application Load Balancer, traffic can’t reach the microservice, so it times out. You could have an alarm triggered to send an SNS notification to a topic to which a Lambda function is subscribed so it runs a describe-security-groups —group-name microserviceXYZ command to validate that the ports are still open for the load balancer. If not, it could issue a command to open them. The integration is very similar to that of the Slack integration, but instead of a message being posted in a Slack channel, it automatically fixes the issue. The following diagram illustrates this architecture. Here we have an alarm configured which will trigger a notification to SNS. This invokes a Lambda function which in-turn makes changes to the security group in question.
Alarm prioritization
There are times when you may want the first occurrence of an alarm being triggered to be informational, the second to notify your operations teams to take action, and the third time to escalate to senior leadership. CloudWatch doesn’t dictate the prioritization of any alarms that you create, but these requirements can be met based on your configuration of the alarms.
The easiest way to achieve this is to create multiple alarms for the same metric, with different thresholds for each alarm. For instance, if you have a microservice that takes orders and processes them, you can create a custom metric in CloudWatch that reports on the service’s latency each time it called.
For the lowest-priority alarm (notification to email or operations Slack channel), you create an alarm that looks at the average latency every 5 minutes and alarms if the latency is greater than 300 milliseconds for two consecutive periods (10 minutes).
For the medium level of priority (page the on-call of the operations team), you create an alarm that watches the same latency metric but looks for a threshold greater than 500 milliseconds for three consecutive periods (15 minutes).
Finally, the escalation email to senior leadership might be an alarm watching the same metric with a threshold greater than 1 second of latency for three consecutive periods (15 minutes).
Each alarm is watching the same metric but looking for different thresholds over different consecutive periods. If all three alarms trigger during a hypothetical outage of the process orders microservice, the first alert sequence might look like the following timeline which shows all the alarms getting triggered sequentially
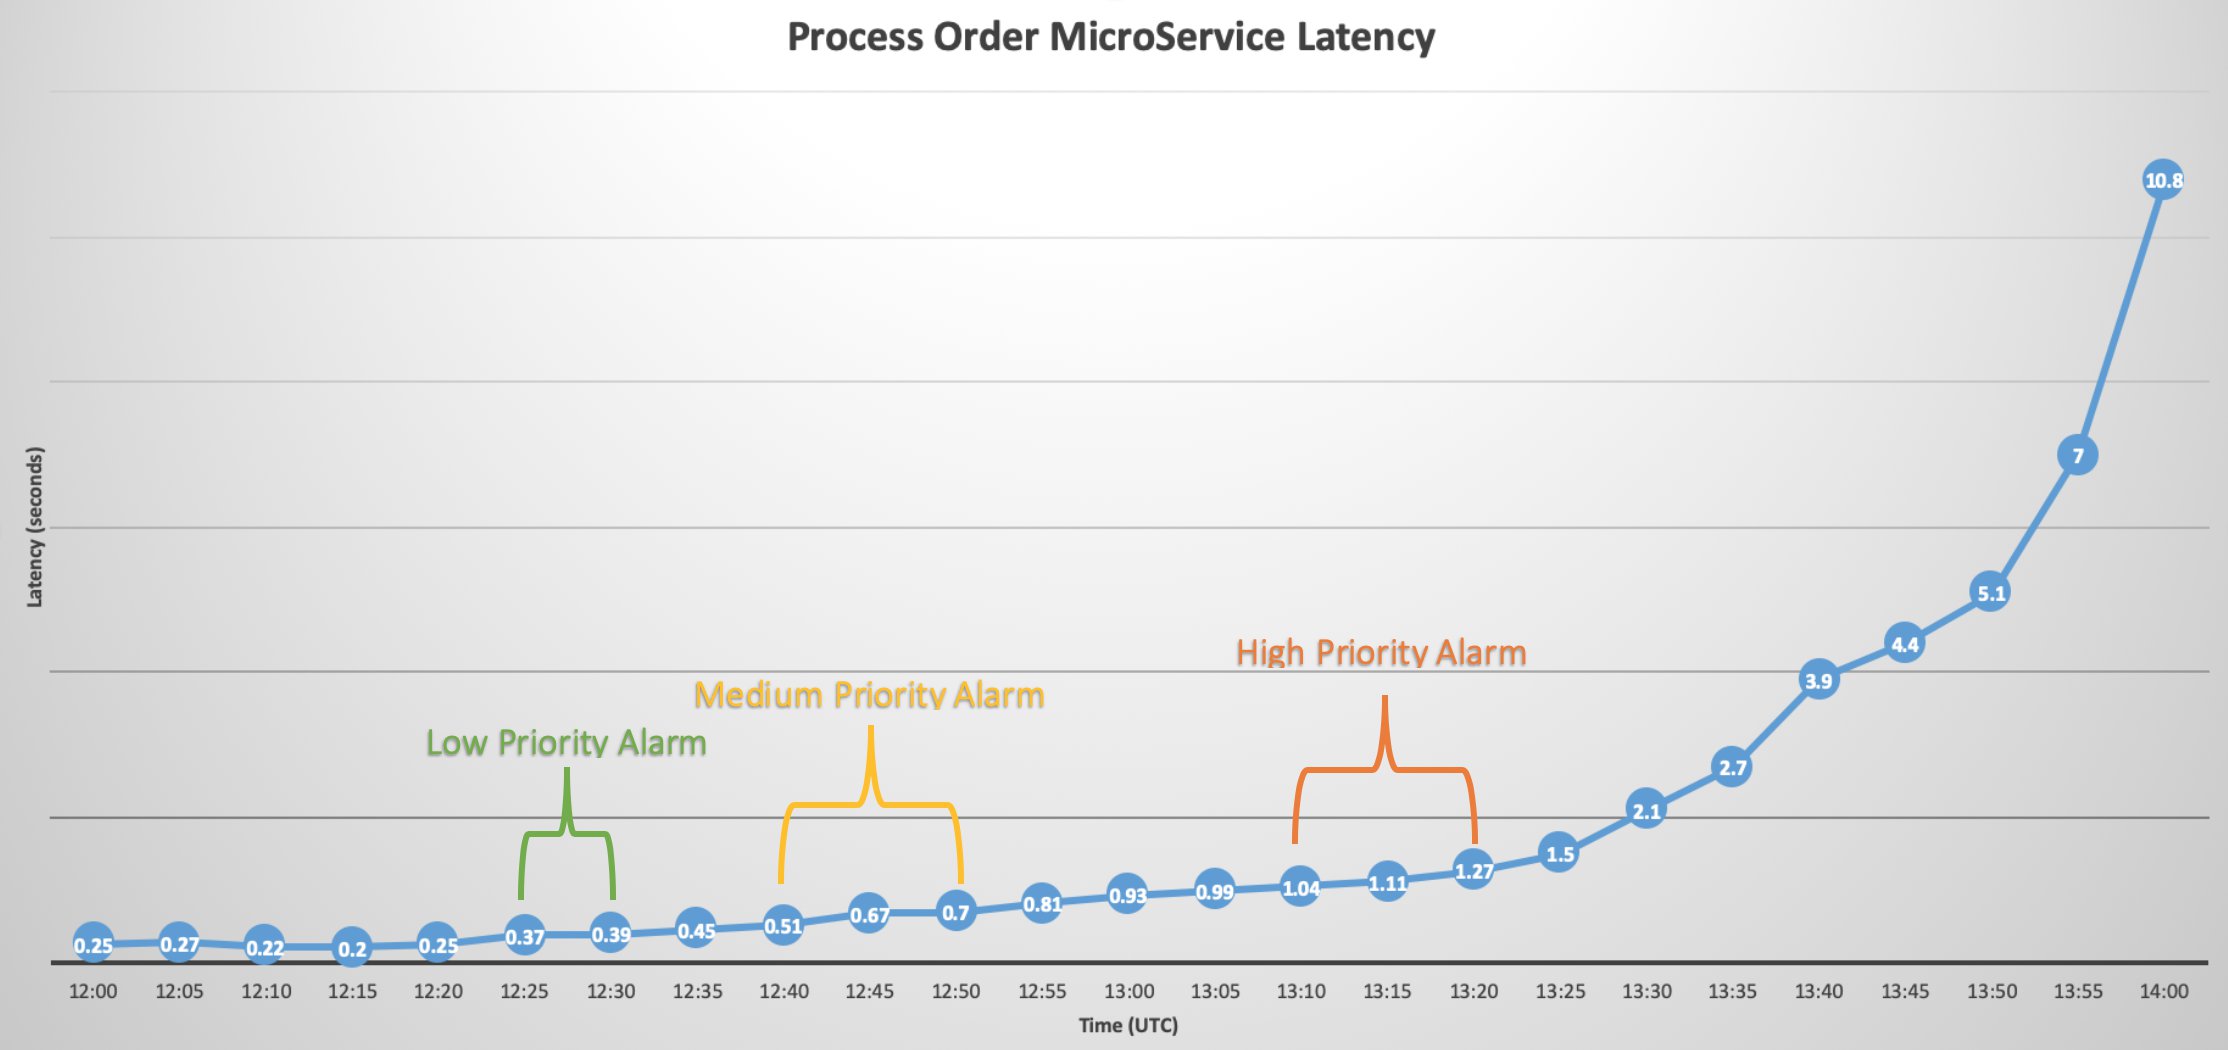
However, because each alarm’s threshold of the same metric is set distinct from the others, you will continue to receive lower-priority alerts during an outage even after the medium or higher alerts are triggered, because the threshold for the lower alarm is still being met (a medium alert of 500 milliseconds for 15 minutes is still greater than the threshold of 300 milliseconds for 10 minutes).
In this graphic however, you can see that if the rising latency isn’t mitigated when the lowest-priority alarm is triggered, the medium-priority alarm is triggered. Again, if the service disruption isn’t mitigated by the actions taken by the medium-priority alarm and latency continues to rise, the high-priority alarm is triggered with notifications and a call to action from senior leadership.
Summary
As you begin workload migration to the cloud, monitoring and operational excellence can be a key factor in determining your workload’s success. You can use CloudWatch to create custom metrics and alarms on metrics to help illustrate things like access patterns, performance patterns, scale-out and scale-in thresholds, and response to incidents. CloudWatch offers integrations to keep your DevOps teams informed via email, SMS text messages, and their accustomed collaborative tools such as Slack or Amazon Chime. You can set alarms at different levels to allow different actions based on different levels of alerting priority (e.g., informative only, automated remediation, and executive notification).
About the Author

Eric Scholz is a Principal Solutions Architect at Amazon Web Services. He enjoys helping customers build solutions to overcome technical challenges and in his off time, you can usually find Eric doing outdoors activities with his family while also dabbling on personal projects like building cars and 3d printing.