AWS Cloud Operations Blog
Announcing Amazon CloudWatch Container Insights for Amazon EKS Windows Workloads Monitoring
Monitoring containerized applications requires precision and efficiency. As your applications scale, collecting and summarizing application and infrastructure metrics from your applications can be challenging. One way to handle this challenge is using Amazon CloudWatch Container Insights which is a single-click native monitoring tool provided by AWS. Amazon CloudWatch Container Insights helps customers collect, aggregate, and summarize metrics and logs from applications running on an Amazon Elastic Kubernetes Service cluster (Amazon EKS). On November 6, 2023, AWS announced an enhanced version of Container Insights that collects granular health, performance, and status metrics up to the container level, and also control plane metrics. Today, AWS is happy to launch Amazon CloudWatch Container Insights for Amazon EKS Windows workloads.
Customers can now collect metrics such as container_cpu_utilization, pod_cpu_requested, pod_cpu_limit for Windows application. Customers will be able to understand the application’s health using out of the box performance metrics dashboard and efficiently debug issues of containerized windows application on Amazon EKS. With CloudWatch Container Insights, metrics data is collected as performance log events using the embedded metric format. From this data, Amazon CloudWatch creates aggregated metrics at the cluster, node, pod, and service level as CloudWatch metrics. The metrics that Container Insights collects are available in CloudWatch automatic dashboards. The metrics collection is handled by CloudWatch Agent while the log collection is handled by Fluent Bit. Both these components can be deployed when you enable the Amazon CloudWatch Observability EKS Add-on.
In this launch post, we will walk you through the process of enabling Container Insights for your Amazon EKS Windows cluster.
Setting up Container Insights for Amazon EKS Windows Cluster
Prerequisites
· Kubectl
· eksctl
· AWS Command Line Interface (AWS CLI) version 2
· Configure the credentials in AWS CLI
Creating the Amazon EKS Windows Cluster
Let’s start with creating the Amazon EKS Windows cluster. The simplest way to get a cluster set up is to use eksctl, the official CLI tool for Amazon EKS. The command below creates a cluster called eks-windows-ci and adds two Linux nodes to the cluster. Currently, at least one Linux node is required to support Windows node and pod networking. However, in this example, we have selected two for high availability and recommend that you do the same.
Please note that the latest version of Amazon EKS supported at the time of writing this blog post is 1.29 and you can choose any of the supported Amazon EKS version.
eksctl create cluster \
--name eks-windows-ci \
--version 1.29 \
--nodegroup-name linux-ng \
--node-type m5.large \
--region us-east-1 \
--nodes 2 \
--nodes-min 1 \
--nodes-max 3 \
--node-ami-family AmazonLinux2 \
--disable-pod-imds true
Next, we will need to add some Windows Nodes to our cluster. If you use eksctl to create the cluster then the command below will work. If you are working with an existing cluster, check out the documentation for instructions on how to create a Windows node group and connect it to your cluster
The most up to date Windows AMI ID for your region can be found by querying the AWS SSM Parameter Store. Instructions to do this can be found in the Amazon EKS documentation.
eksctl create nodegroup \
--region us-east-1 \
--cluster eks-windows-ci \
--name windows-ng \
--node-type m5.large \
--nodes-min 2 \
--node-ami-family WindowsServer2022FullContainer \
--disable-pod-imds true
Next, let’s modify the amazon-vpc-cni configmap to enable IP address management (IPAM).
cat << EOF > amazon-vpc-cni.yaml
---
apiVersion: v1
kind: ConfigMap
metadata:
name: amazon-vpc-cni
namespace: kube-system
data:
enable-windows-ipam: "true"
---
EOF
kubectl apply -f amazon-vpc-cni.yamlLet’s use the kubectl command to ensure cluster is up and running
nht-admin:~/environment $ kubectl get nodes -o wide
NAME                             STATUS   ROLES    AGE     VERSION               INTERNAL-IP      EXTERNAL-IP      OS-IMAGE                         KERNEL-VERSION                  CONTAINER-RUNTIME
ip-192-168-10-132.ec2.internal   Ready    <none>   2d11h   v1.28.5-eks-5e0fdde   192.168.10.132   107.23.236.165   Windows Server 2022 Datacenter   10.0.20348.2227                 containerd://1.6.18
ip-192-168-14-178.ec2.internal   Ready    <none>   2d      v1.28.5-eks-5e0fdde   192.168.14.178   54.80.175.223    Windows Server 2022 Datacenter   10.0.20348.2227                 containerd://1.6.18
ip-192-168-29-193.ec2.internal   Ready    <none>   2d11h   v1.28.5-eks-5e0fdde   192.168.29.193   3.90.176.199     Amazon Linux 2                   5.10.205-195.807.amzn2.x86_64   containerd://1.7.11
ip-192-168-33-121.ec2.internal   Ready    <none>   2d11h   v1.28.5-eks-5e0fdde   192.168.33.121   18.207.151.28    Amazon Linux 2                   5.10.205-195.807.amzn2.x86_64   containerd://1.7.11
ip-192-168-46-41.ec2.internal    Ready    <none>   2d11h   v1.28.5-eks-5e0fdde   192.168.46.41    52.90.145.146    Windows Server 2022 Datacenter   10.0.20348.2227                 containerd://1.6.18
Install the Amazon CloudWatch Observability EKS Add-on
The easiest way to enable Container Insights is by deploying the Amazon CloudWatch Observability EKS Add-on. The Amazon CloudWatch Observability EKS add-on installs the CloudWatch Agent and the Fluent-bit agent on an Amazon EKS cluster, with Container Insights enhanced observability for Amazon EKS and CloudWatch Application Signals enabled by default. Please note that the CloudWatch Application signals is currently not supported on Windows. Using the add-on, you can collect infrastructure metrics, application performance telemetry, and container logs from the Amazon EKS cluster. Fluent Bit ships container logs from the cluster to CloudWatch Logs. This gives you insights into application and system logs from your containers. To use the Amazon EKS add-on, set up the necessary IAM permissions in the IAM role used by your worker nodes in the cluster. For Windows worker nodes, we will associate the IAM policy to the instance role.
Replace the my-windows-worker-node-role with the Windows node group IAM role.
aws iam attach-role-policy --role-name <<my-windows-worker-node-role>> --policy-arn arn:aws:iam::aws:policy/CloudWatchAgentServerPolicyFor Linux worker nodes, we will leverage the EKS Pod Identities add-on.
Let’s deploy the EKS add-on. Notice we have configured a nodeSelector to have the EKS pod identities agent Daemonset deployed in Linux nodes only. At the time of writing this blog post, EKS Pod Identities agent is not supported in Windows worker nodes.By specifying the nodeSelector, we are making sure that the daemonset does not gets deployed on the Windows worker nodes.
aws eks create-addon --cluster-name eks-windows-ci --addon-name eks-pod-identity-agent --addon-version v1.1.0-eksbuild.1 --configuration-values $'nodeSelector: \n \"kubernetes.io/os\": \"linux\"' --resolve-conflicts OVERWRITEeksctl create podidentityassociation --cluster eks-windows-ci --namespace amazon-cloudwatch --service-account-name cloudwatch-agent --role-name eks-cw-role --permission-policy-arns arn:aws:iam::aws:policy/CloudWatchAgentServerPolicy --region us-east-1Next, install the Amazon Cloudwatch Observability add-on as below.
aws eks create-addon --cluster-name eks-windows-ci --addon-name amazon-cloudwatch-observabilityAmazon CloudWatch Container Insights will now be enabled for your EKS cluster. To enable easy onboarding, same add-on is also available on EKS console under the add-ons tab which you can access on your Cluster Info view. You’ll start seeing enhanced metrics and logs in the CloudWatch console. Let’s confirm the successful deployment of CloudWatch Container Insights using the below command.
$ kubectl get pods -n amazon-cloudwatch
NAME                                                              READY   STATUS    RESTARTS      AGE
amazon-cloudwatch-observability-controller-manager-6d5954fcttgw   1/1     Running   0             44h
cloudwatch-agent-9fvj6                                            1/1     Running   0             44h
cloudwatch-agent-cfzmb                                            1/1     Running   0             44h
cloudwatch-agent-windows-fmlbt                                    1/1     Running   0             44h
cloudwatch-agent-windows-g298d                                    1/1     Running   0             44h
cloudwatch-agent-windows-pw9pl                                    1/1     Running   0             44h
fluent-bit-ctls2                                                  1/1     Running   0             44h
fluent-bit-windows-5t57v                                          1/1     Running   5 (44h ago)   44h
fluent-bit-windows-6qhm4                                          1/1     Running   8 (43h ago)   44h
fluent-bit-windows-mcdrm                                          1/1     Running   6 (19h ago)   44h
fluent-bit-wmgp6                                                  1/1     Running   0             44h
Note: On Windows, network metrics like pod_network_rx_bytes and pod_network_tx_bytes are not collected for host process containers.
Let’s also check the CloudWatch log groups console to verify if the Fluent Bit agent has started pushing logs. You should see Windows EC2 instance in following log groups
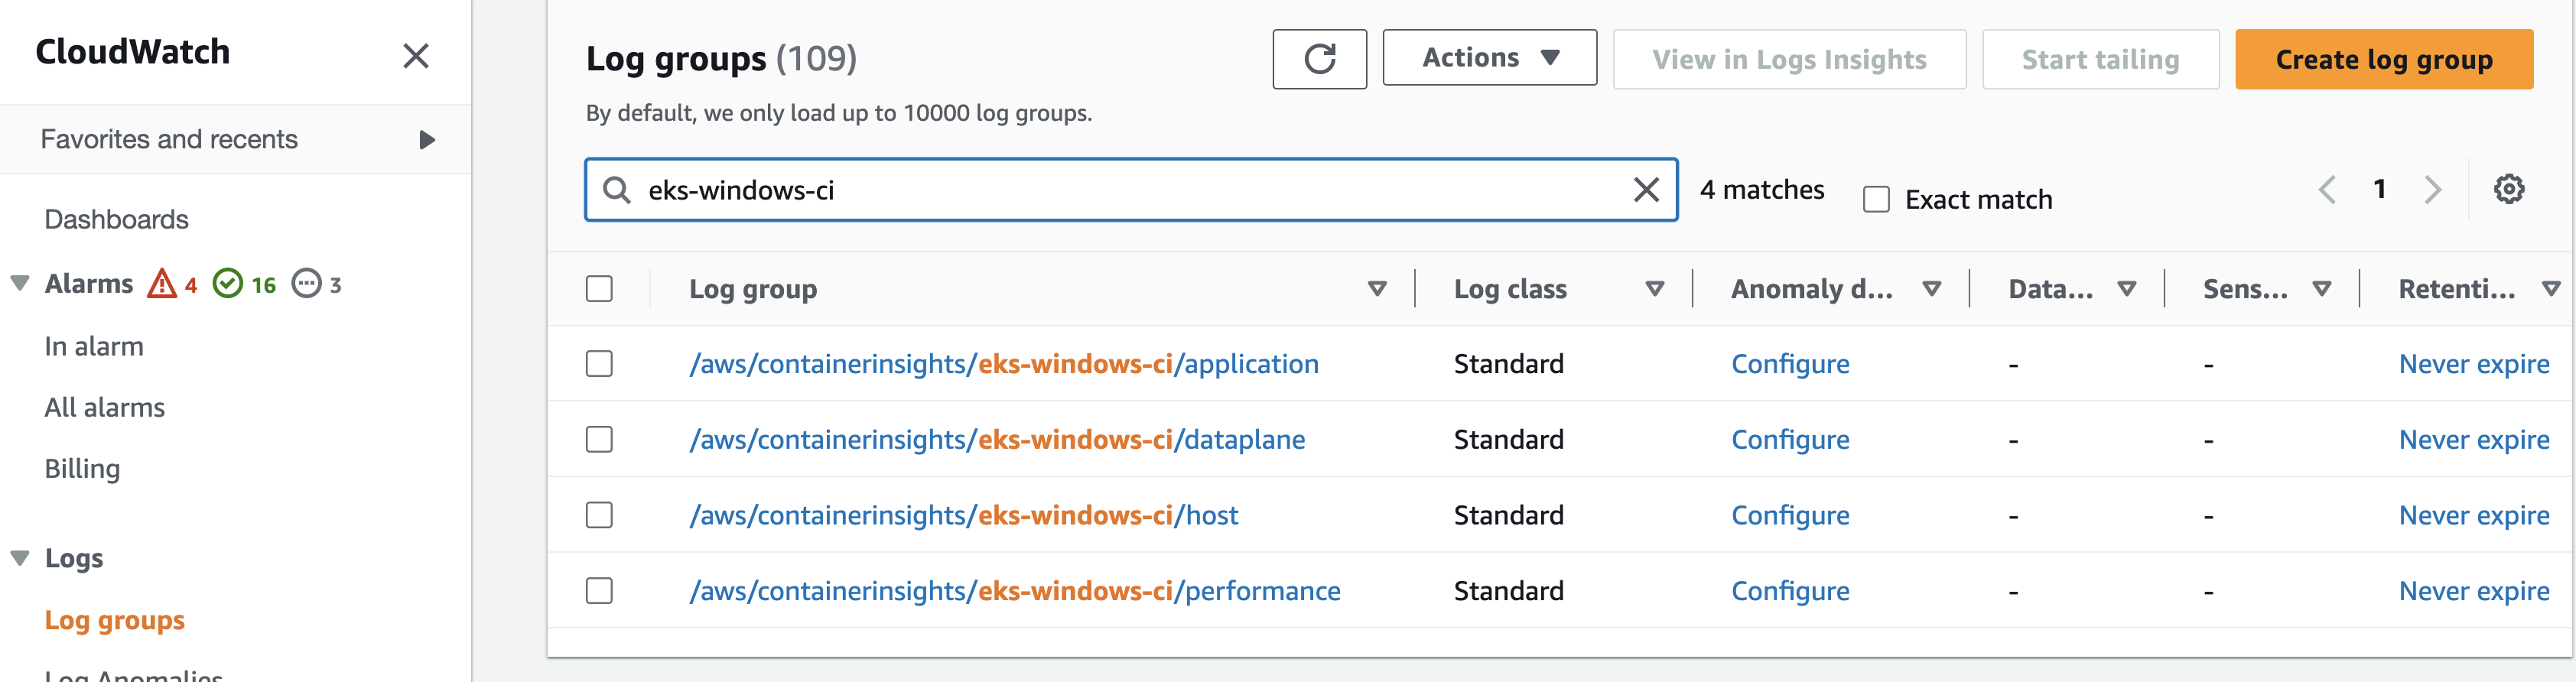
CloudWatch Log groups Console
Deploy sample application and explore the CloudWatch Container Insights dashboard
To understand the various out of the box dashboards provided by Container Insights, let’s deploy a sample Windows application. The application runs a basic Windows IIS server.
cat << EOF > windows-workloads.yaml
---
apiVersion: apps/v1
kind: Deployment
metadata:
name: multiple-containers
namespace: multiple-containers
spec:
selector:
matchLabels:
app: multiple-containers
tier: backend
track: stable
replicas: 1
template:
metadata:
labels:
app: multiple-containers
tier: backend
track: stable
spec:
containers:
- name: multiple-containers-container-1
image: mcr.microsoft.com/windows/servercore/iis:windowsservercore-ltsc2022
command:
- powershell.exe
- -command
- " ping -t google.com "
- name: multiple-containers-container-2
image: mcr.microsoft.com/windows/servercore/iis:windowsservercore-ltsc2022
command:
- powershell.exe
- -command
- " ping -t amazon.com "
nodeSelector:
kubernetes.io/os: windows
---
apiVersion: apps/v1
kind: Deployment
metadata:
name: standard-2022-deployment
spec:
selector:
matchLabels:
app: standard-2022-deployment
tier: backend
track: stable
replicas: 1
template:
metadata:
labels:
app: standard-2022-deployment
tier: backend
track: stable
spec:
containers:
- name: standard-2022-deployment
image: mcr.microsoft.com/windows/servercore/iis:windowsservercore-ltsc2022
command:
- powershell.exe
- -command
- " ping -t google.com "
nodeSelector:
kubernetes.io/os: windows
---
apiVersion: apps/v1
kind: Deployment
metadata:
name: deployment-web-service
namespace: web-service
spec:
selector:
matchLabels:
app: deployment-web-service
tier: backend
track: stable
replicas: 1
template:
metadata:
labels:
app: deployment-web-service
tier: backend
track: stable
spec:
containers:
- name: deployment-web-service
image: mcr.microsoft.com/windows/servercore/iis:windowsservercore-ltsc2022
command:
- powershell.exe
- -command
- "Add-WindowsFeature Web-Server; Invoke-WebRequest -UseBasicParsing -Uri 'https://dotnetbinaries.blob.core.windows.net/servicemonitor/2.0.1.6/ServiceMonitor.exe' -OutFile 'C:\\ServiceMonitor.exe'; echo '<html><body><br/><br/><H1>Windows Container Workshop - Windows LTSC2019!!!<H1></body><html>' > C:\\inetpub\\wwwroot\\iisstart.htm; C:\\ServiceMonitor.exe 'w3svc'; "
nodeSelector:
kubernetes.io/os: windows
---
apiVersion: v1
kind: Service
metadata:
name: standard-2022-service
namespace: web-service
spec:
ports:
- port: 80
protocol: TCP
targetPort: 80
selector:
app: deployment-web-service
tier: backend
track: stable
sessionAffinity: None
type: LoadBalancer
---
EOF

kubectl apply -f windows-workloads.yaml
Once deployed, enhanced container insights page looks like below from AWS console, with the high level summary of your clusters, kube-state and control-plane metrics. The Container Insights dashboard shows cluster status and alarms. It uses predefined thresholds for CPU and memory to quickly identify which resources are having higher consumption, and enabling proactive actions to avoid performance impact.
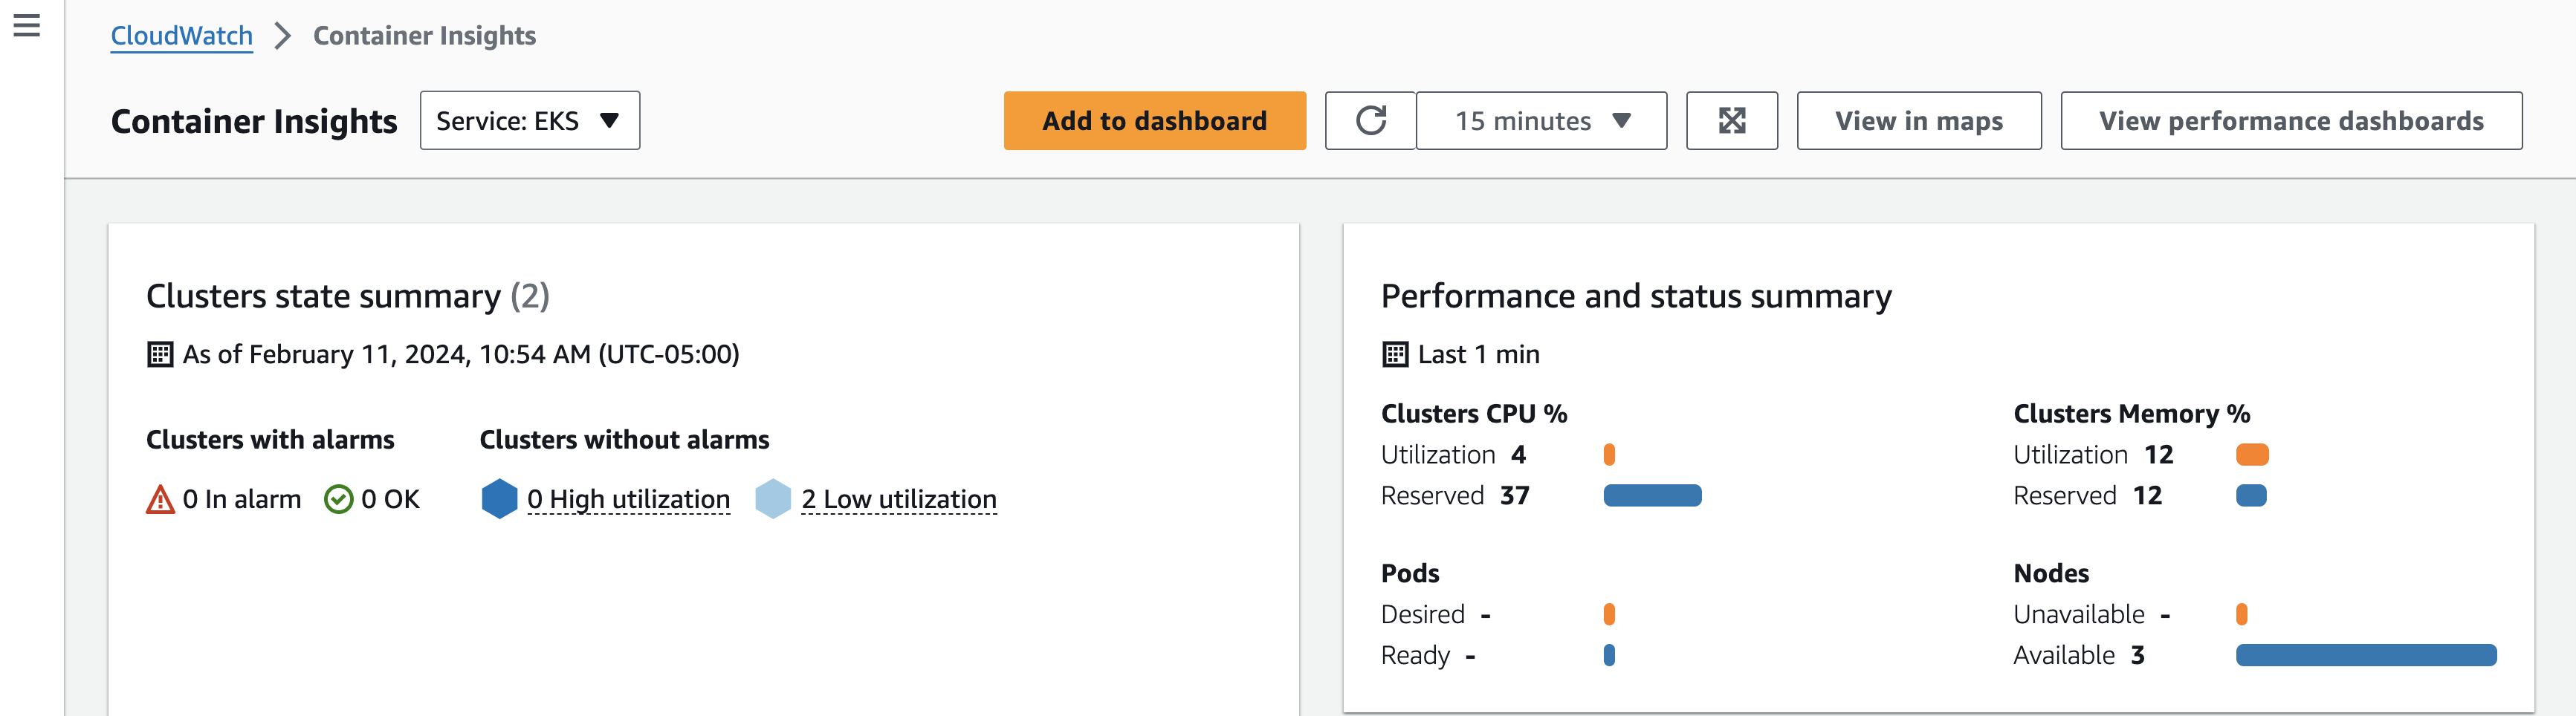
Overview of Container Insights
Additionally, you can find the top 10 list by clusters, nodes, workloads, pods and containers for some of the key metrics like CPU and memory utilization. The ability to provide the information up to containers level, can help the Site Reliability Engineer in reducing the mean time to identify the performance issue.

Top 10 list
We can dive into more details by clicking on the cluster name, which opens the Performance monitoring dashboard. This monitoring dashboard provides various views to analyze performance, including:
· Cluster-wide performance dashboard view for an overview of resource utilization across the entire cluster.
· Node performance view to visualize metrics at the individual node level.
· Pod performance view to focus on pod-level metrics for CPU, memory, network, etc.
· Container performance view to drill down into utilization metrics for individual containers.
For example, we could start with the cluster-wide performance dashboard to get a high-level perspective. The different views allow methodically narrowing down to find the root cause, from cluster to node to pod to container.

Performance dashboard
In a multi-tenant environment, it is important to understand the performance of each application to avoid noisy neighbor situation. In such scenarios, the namespaces summary dashboard can easily help us identify the application that is consuming more resource and take pro-active measures. The below dashboard shows the namespace summary of the multiple-containers namespace and provides holistic view of the resource utilization.

Performance dashboard by Namespace
The service dashboard view in Amazon CloudWatch Container Insights provides metrics for CPU, memory, and network performance of the pods of your Kubernetes service. With these insights, you can better optimize resource utilization and troubleshoot problems with your containerized services.
The performance metrics dashboard provides an overview of application health using key metrics like CPU, memory, and network utilization. The dashboard is integrated with CloudWatch metrics and CloudWatch log groups, enabling you to easily navigate and identify the root cause of an issue without spending much time. Simply click the three dots in the dashboard panel and select View logs to access relevant logs. Logs Insights comes with pre-populated queries, making it easy to analyze and gain insights from your log data.

Performance dashboard by Services
You can select the view in metrics to navigate to the respective metrics and create alarms present under the Actions column and send notifications when the values exceed the threshold specified. The dashboard shows the alarm creation process for Amazon EKS service standard-2022-service using the pod_cpu_utilization metric.

Navigating to Metrics console

Alarm Creation
All the metrics collected are available under the ContainerInsights namespace. If you are interested in creating alarms for specific metrics, you can leverage the namespace to access the metrics and create the respective alarms.

ContainerInsights CloudWatch Namespace
Cleanup
To delete the resources provisioned in the blog, please execute the following commands.
eksctl delete cluster –name eks-windows-ciConclusion
In this blog post, we showed you the process of enabling Container Insights for the Amazon EKS Windows cluster. Within a few clicks, you will be able to enable and collect detailed metrics of both control plane and data plane. You will be able to reduce the mean time to identify and mean time to resolve the performance issues of your windows workloads using the out of the box dashboard. Use the link, to get started with enabling enhanced CloudWatch Container Insights on the Amazon EKS cluster and troubelshoot the Windows workloads running on Amazon EKS cluster efficiently.