AWS Cloud Operations Blog
Dynamically adjusting X-Ray sampling rules
In a distributed system environment, tracing service-to-service interactions is essential to easily identify service bottlenecks, faults, and errors. AWS X-Ray allows you to set up tracing on your applications hosted on a variety of compute environments, such as Amazon Elastic Compute Cloud (Amazon EC2), AWS Elastic Beanstalk, Amazon Elastic Kubernetes Service (Amazon EKS), Amazon Elastic Container Service (Amazon ECS), AWS Fargate, AWS Lambda, and applications hosted outside of AWS.
What is trace sampling?
X-Ray uses sampling rules to improve performance efficiency and reduce costs. Sampling rules essentially allow you to define rate limits on the number of requests that should be traced on a per second basis. You can customize the trace collection mechanism to suit your workload and tracing requirements. For more information about sampling rules, see Configuring sampling rules in the X-Ray console.
How do X-Ray sampling rules work?
The X-Ray SDK and AWS services that support active tracing with sampling configuration use sampling rules to determine which requests to record. Services that support active tracing can actively sample and instrument incoming requests.
You can set up the sampling rules on the client side (within the application) as a JSON document and load that in your code using the X-Ray SDK. But this could result in more requests getting sampled than intended because each application applies sampling rules individually. We recommend configuring sampling rules on the X-Ray console, which provides greater flexibility in managing the rules and updating them on a regular basis as needed.
All services that support active tracing can use sampling rules configured on the X-Ray console. Those services include Amazon API Gateway, AWS App Mesh, AWS AppSync, and applications hosted on Amazon EC2, Amazon ECS, Amazon EKS, and Elastic Beanstalk. For more information, see Integrating AWS X-Ray with other AWS services.
The X-Ray agent on these environments reaches out to the X-Ray service using X-Ray API operations, fetches the rules, and applies them based on priority and filter conditions specified in the sampling rule.
Use case
Developers generally set a low sampling rate to trace requests in order to save costs and improve efficiency. Although this is the right approach in general, it might also be easier to troubleshoot service issues with an increased amount of trace data to perform deeper analysis and identify the root cause quickly, because you can work with a larger trace sample set during the investigation period.
Setting sampling rules for applications is specific to the nature of the application. Consider parameters such as request patterns, service load, business needs, and criticality of the application before setting up the sampling rule.
Solution overview
On X-Ray, you can maintain various sampling rules with varied sampling rates on the X-Ray console, which different applications and services can use. Additionally, you can dynamically adjust a sampling rate temporarily based on an external event in the environment automatically, or adjust it manually on the console. For example, it could be beneficial to temporarily trace a higher number of requests during an incident to help troubleshoot a problem, while maintaining a lower trace rate during normal operations in order to be cost-efficient.
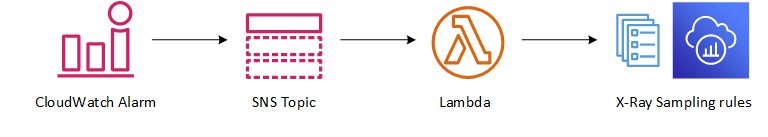
The following diagram shows the generic pattern of a dynamic sampling rule adjustment. You use an Amazon CloudWatch alarm to trigger the X-Ray sampling rule adjustment process. You can configure the alarm based on applications needs, for example high CPU utilization, number of Lambda function failures, or rate of 5xx errors in API Gateway.
You can apply this pattern to several architectures. For this post, we use a simple web application that contains an API Gateway and backend Lambda function.
You can devise your own approach based on your use case—the core idea is that you trigger a CloudWatch alarm when the application experiences issues.
The following diagram illustrates the solution workflow.
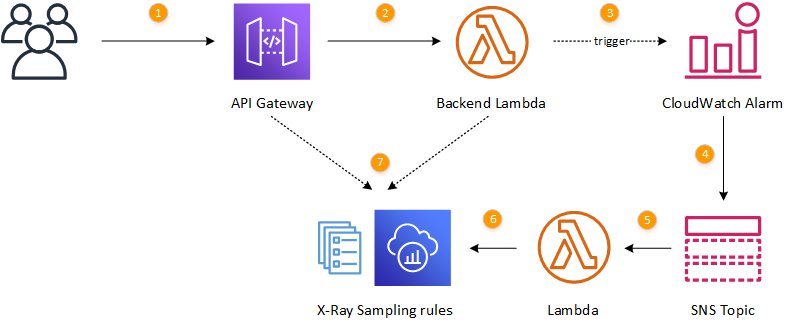
The workflow contains the following steps:
- Clients access API Gateway using HTTP requests.
- API Gateway forwards requests to the Lambda function for processing.
- Errors in the function trigger a CloudWatch alarm state change.
- A message about the changed alarm state is posted in an Amazon Simple Notification Service (Amazon SNS) topic.
- A Lambda function is triggered in response to the Amazon SNS message.
- Based on the alarm state, X-Ray sampling rules are adjusted.
- Incoming requests are traced based on the updated rules.
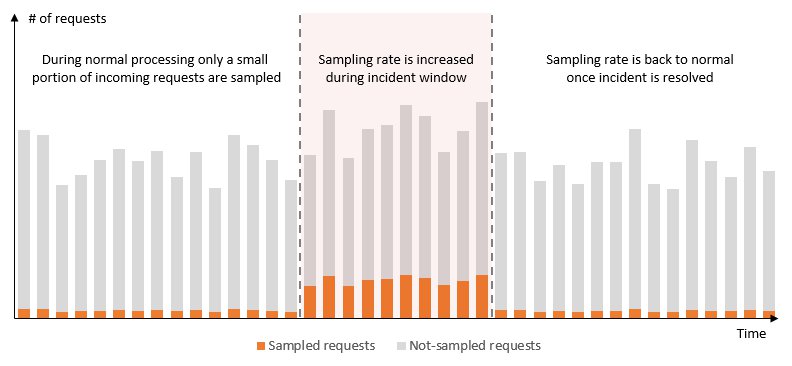
The following screenshot shows how a trace sampling rate changes based on different rule settings. The graph on the left shows fewer requests sampled than the graph on the right, where the sampling rate is higher.

The following graph shows how changes in trace sampling rates through an X-Ray sampling rule affects traces getting recorded.
Deploying the solution
A complete solution that demonstrates the technique described in this post is on GitHub. To deploy it, clone the repository to have a local version of the project:
git clone https://github.com/aws-samples/dynamically-adjust-aws-xray-sampling-rulesYou must have the AWS Serverless Application Model (AWS SAM) command line interface installed to proceed with the deployment.
Switch to the project folder and run the following command to build the deployment package:
sam buildRun another command to deploy the AWS CloudFormation stack to your AWS account:
sam deploy --stack-name <stack-name> --s3-bucket <deployment-bucket> --capabilities CAPABILITY_IAM
You can also use the samdeploy —guided command instead to provide the required parameters interactively.
After deploying the stack, you see the API Gateway endpoint as an output value:
CloudFormation outputs from deployed stack
-----------------------------------------------------------------------------------
Outputs
-----------------------------------------------------------------------------------
Key                 WebApi
Description         API Gateway endpoint URL for Prod stage for WebApi function
Value               https://xxxxxxxxxx.execute-api.eu-west-1.amazonaws.com/Prod/
-----------------------------------------------------------------------------------
Testing the solution
For this post, we test the API using an open source regression test and benchmark utility called siege.
To install siege on macOS through homebrew, enter the following command:
brew install siegeTo install siege on a Linux terminal or WSL on Windows 10, enter the following command:
sudo yum install siege -yAfter you install it on your local machine, run the following command to access the API Gateway URL. Remember to replace the API Gateway URL with your own. Notice the error=false querystring. The Lambda function returns a 200 response when it sees this parameter value, indicating a successful response.
This command makes 100 concurrent requests for 45 seconds. This doesn’t trigger the CloudWatch alarm, so there’s no sampling rule change
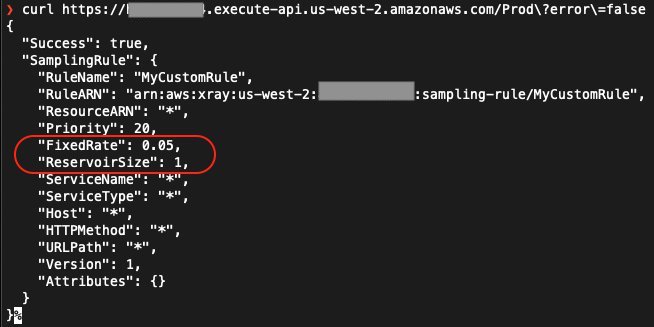
siege -t 45S -c 100 -i https://hpxxxxxxx.execute-api.us-west-2.amazonaws.com/Prod?error=falseTo verify this, check the sampling rule by running the following command:
curl https://hpxxxxxxx.execute-api.us-west-2.amazonaws.com/Prod?error=falseThe following screenshot shows the output. The sampling rule has a FixedRate of 0.05 and ReservoirSize of 1.
Now run the following command to make 100 concurrent requests for 45 seconds with the error=true parameter:
siege -t 45S -c 100 -i https://hpxxxxxxx.execute-api.us-west-2.amazonaws.com/Prod?error=trueThis results in the Lambda function returning an HTTP status code 500 to the API Gateway, which triggers the CloudWatch alarm to invoke the Lambda function that modifies the X-Ray sampling rule.
Wait for a few seconds and run the following command again:
curl https://hpxxxxxxx.execute-api.us-west-2.amazonaws.com/Prod?error=trueThe following screenshot shows the output. Take notice of the change in sampling rule by the Lambda function triggered by the CloudWatch alarm: the rule now has a FixedRate of 0.1 and ReservoirSize of 15.
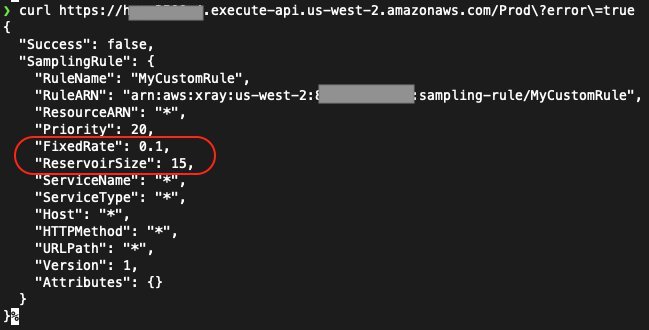
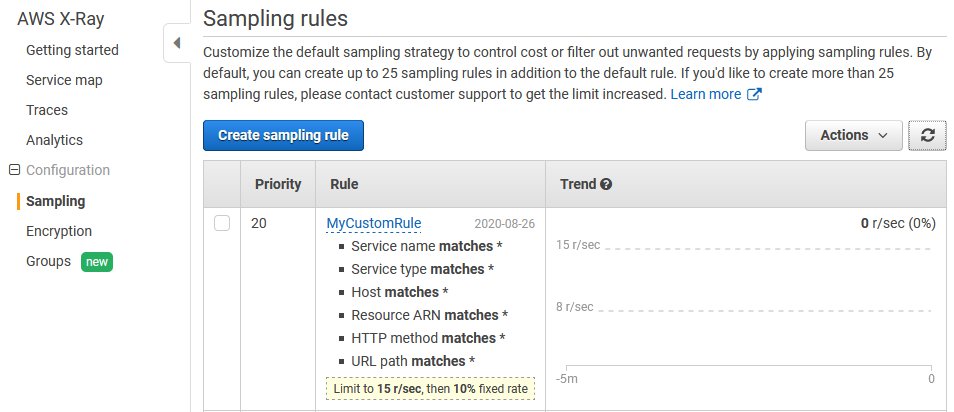
You can also validate the sampling rule change on the X-Ray console. See the following screenshot.
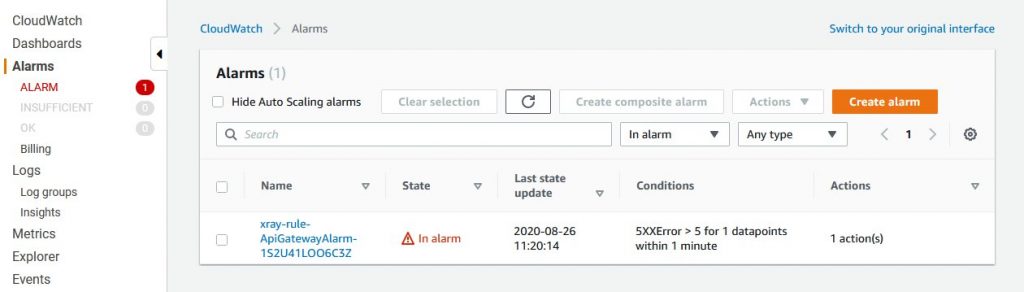
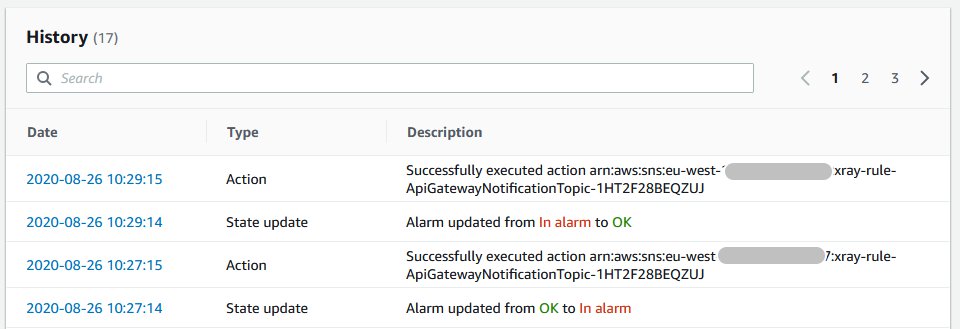
Navigate to the CloudWatch console to see the alarm state details. There may be a small delay between you hitting five errors per minute and the change of the alarm state.
Run the following command to make requests to API Gateway while the new sampling rate is on. This results in a higher number of requests getting sampled per the updated sampling rate.
siege -t 45S -c 100 -i https://hpxxxxxxx.execute-api.us-west-2.amazonaws.com/Prod?error=true
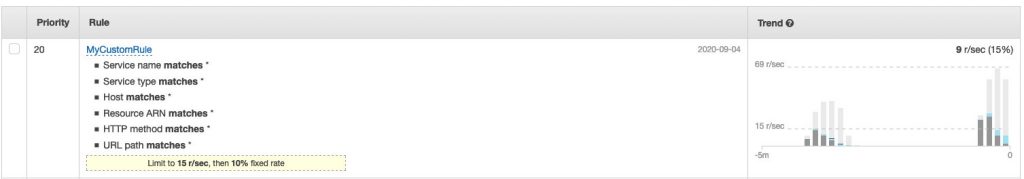
You can verify the change in sampling rate on the X-Ray console to see the Trend graph, which shows changes in sampling rate. See the following screenshot.
You can see the alarm status changes on the CloudWatch console.
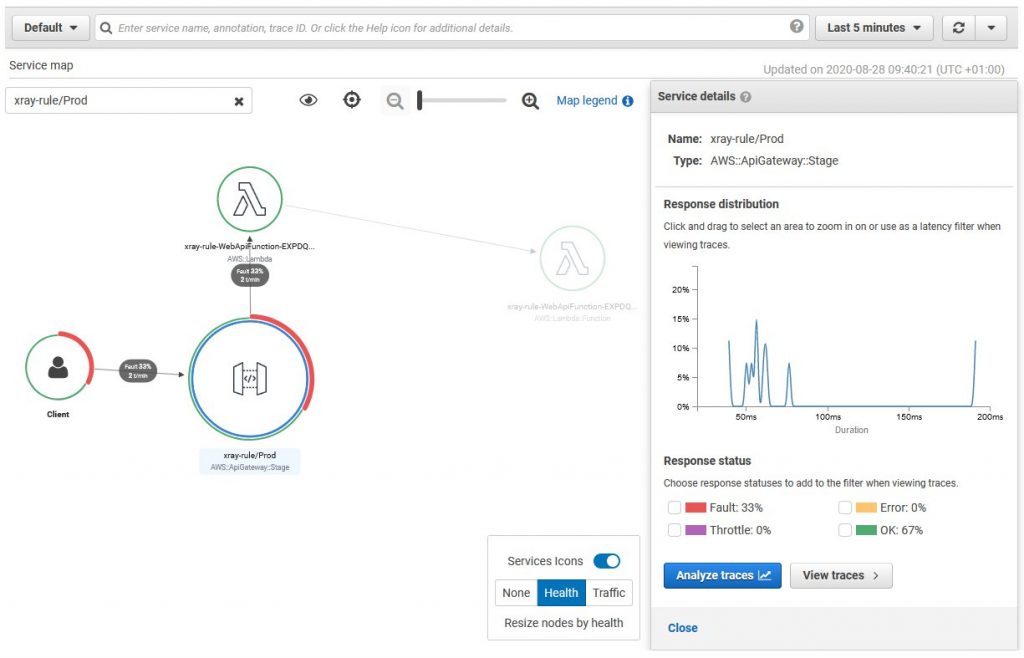
On the X-Ray console, you can also see the Service map for the application, which shows errors from API Gateway.
Cleaning up
To remove all the resources created when deploying the test application, complete the following steps:
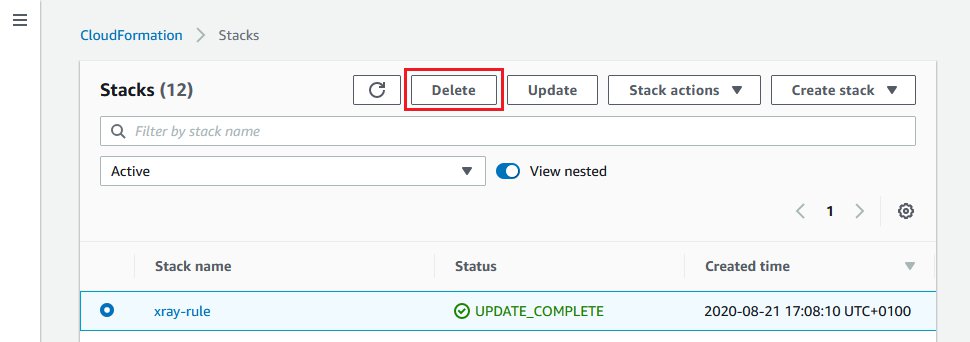
- On the AWS CloudFormation console, choose Stacks.
- Select the stack for this application.
- Choose Delete.
Conclusion
In this post, we showed you how to use X-Ray sampling rules to dynamically adjust your sampling rate for troubleshooting purposes. For the complete solution, see the GitHub repo.
You can also use X-Ray Analytics to easily identify the root cause of the issue with powerful filtering and analysis capabilities. We also recommend exploring CloudWatch Service Lens which provides observability features by correlating traces, metrics, and logs, resulting in lower mean time to detection (MTTD) for your application issues.
About the Authors

Imaya Kumar Jagannathan
Imaya is a Senior Solution Architect focused on Amazon CloudWatch and AWS X-Ray. He is passionate about Monitoring and Observability and has a strong application development and architecture background. He likes working on distributed systems and is excited to talk about micro-service architecture design. He loves programming on C#, working with Containers and Serverless technologies.

Dmitry Kolomiets
Dmitry is a Professional Services consultant who helps customers adopt DevOps culture and best practices. He is especially interested in resilient patterns and architectures and constantly in search for better ways of applying them to customer problems. In his free time Dmitry enjoys running, reading history books and soldering mechanical keyboards.