AWS Cloud Operations Blog
How Amazon CloudWatch Logs Data Protection can help detect and protect sensitive log data
Customer applications running on Amazon Web Services (AWS) often require handling sensitive data such as personally identifiable information (PII) or protected health information (PHI). As a result, sensitive log data can be intentionally or unintentionally logged as part of an application’s observability data. While comprehensive logging is important for application troubleshooting, monitoring and forensics, any confidential information logged can pose a significant data security and compliance risk.
Customers in highly regulated industries typically have requirements to comply with numerous stringent data protection regulations including GDPR, CCPA, HIPAA, SOX, GLBA, PCI DSS, ISO/IEC 27001, SEC Cybersecurity Guidance, state privacy laws, and FTC consumer protection statutes. Data breaches and non-compliance can lead to massive fines, lawsuits, reputational damage, business disruption, systems downtime and loss of customers.
In this blog post, you will learn how to detect and protect sensitive data in your logs using Amazon CloudWatch Logs Data Protection, verify data protection, and collect and report non-compliant findings. You will also learn how to create Amazon CloudWatch alarms, notifications and further remediation actions to help align to your compliance requirements.
Solution overview
Amazon CloudWatch Logs offers a data protection capability, Amazon CloudWatch Logs data protection, that can automatically mask sensitive data when it is logged. When enabled, pattern matching and machine learning (ML) based masks are applied to match and replace sensitive data types like credit card numbers, social security numbers, and others with asterisks (*). Currently there are many pre-built managed data identifiers that can be used out of the box and easily applied at scale. In addition to this, CloudWatch Logs Data Protection offers the capability to define custom data identifiers to fit your business specific needs. Managed data identifiers can detect credentials, financial information, PII, PHI and device identifiers. The data protection masking feature can be enabled at the log group level for more granularity or at the account level to apply to all logs in that account at scale.
Enabling CloudWatch Logs data protection helps customers to align with their compliance requirements for data protection regulations in three key ways:
- Sensitive customer data is obfuscated before reaching the logging system. This reduces the risk of leaks or unauthorized access to plain text data and help protect sensitive data from your:
- Company’s internal employees, who may have access to logs for general information but unauthorized to view sensitive information (aligning to your zero-trust policies)
- Downstream systems owned by vendors or third-party systems
- Masking simplifies auditing for compliance. Logs provide evidence that sensitive data is protected, without having to store and secure unmasked original values.
- Masks can be defined once and easily be applied at scale.
Implementation
When creating a data protection policy in CloudWatch Logs you can create it at the account level or for a specific log group. An account-level data protection policy is applied to all existing and future log groups within an account, whereas a log group-level data protection policy applies to a specific log group. Account-level and log group-level log data protection policies work in combination to support data identifiers for specific use cases.
Enable CloudWatch Logs data protection at log group level
Based on your business needs and how your applications are designed, there may be situations where you would like to enable data protection on a specific log group level for more fine-grained control.
- From the CloudWatch console, navigate to Logs > Log Groups
- Choose your log group and create data protection policy either from Actions menu or Data protection tab
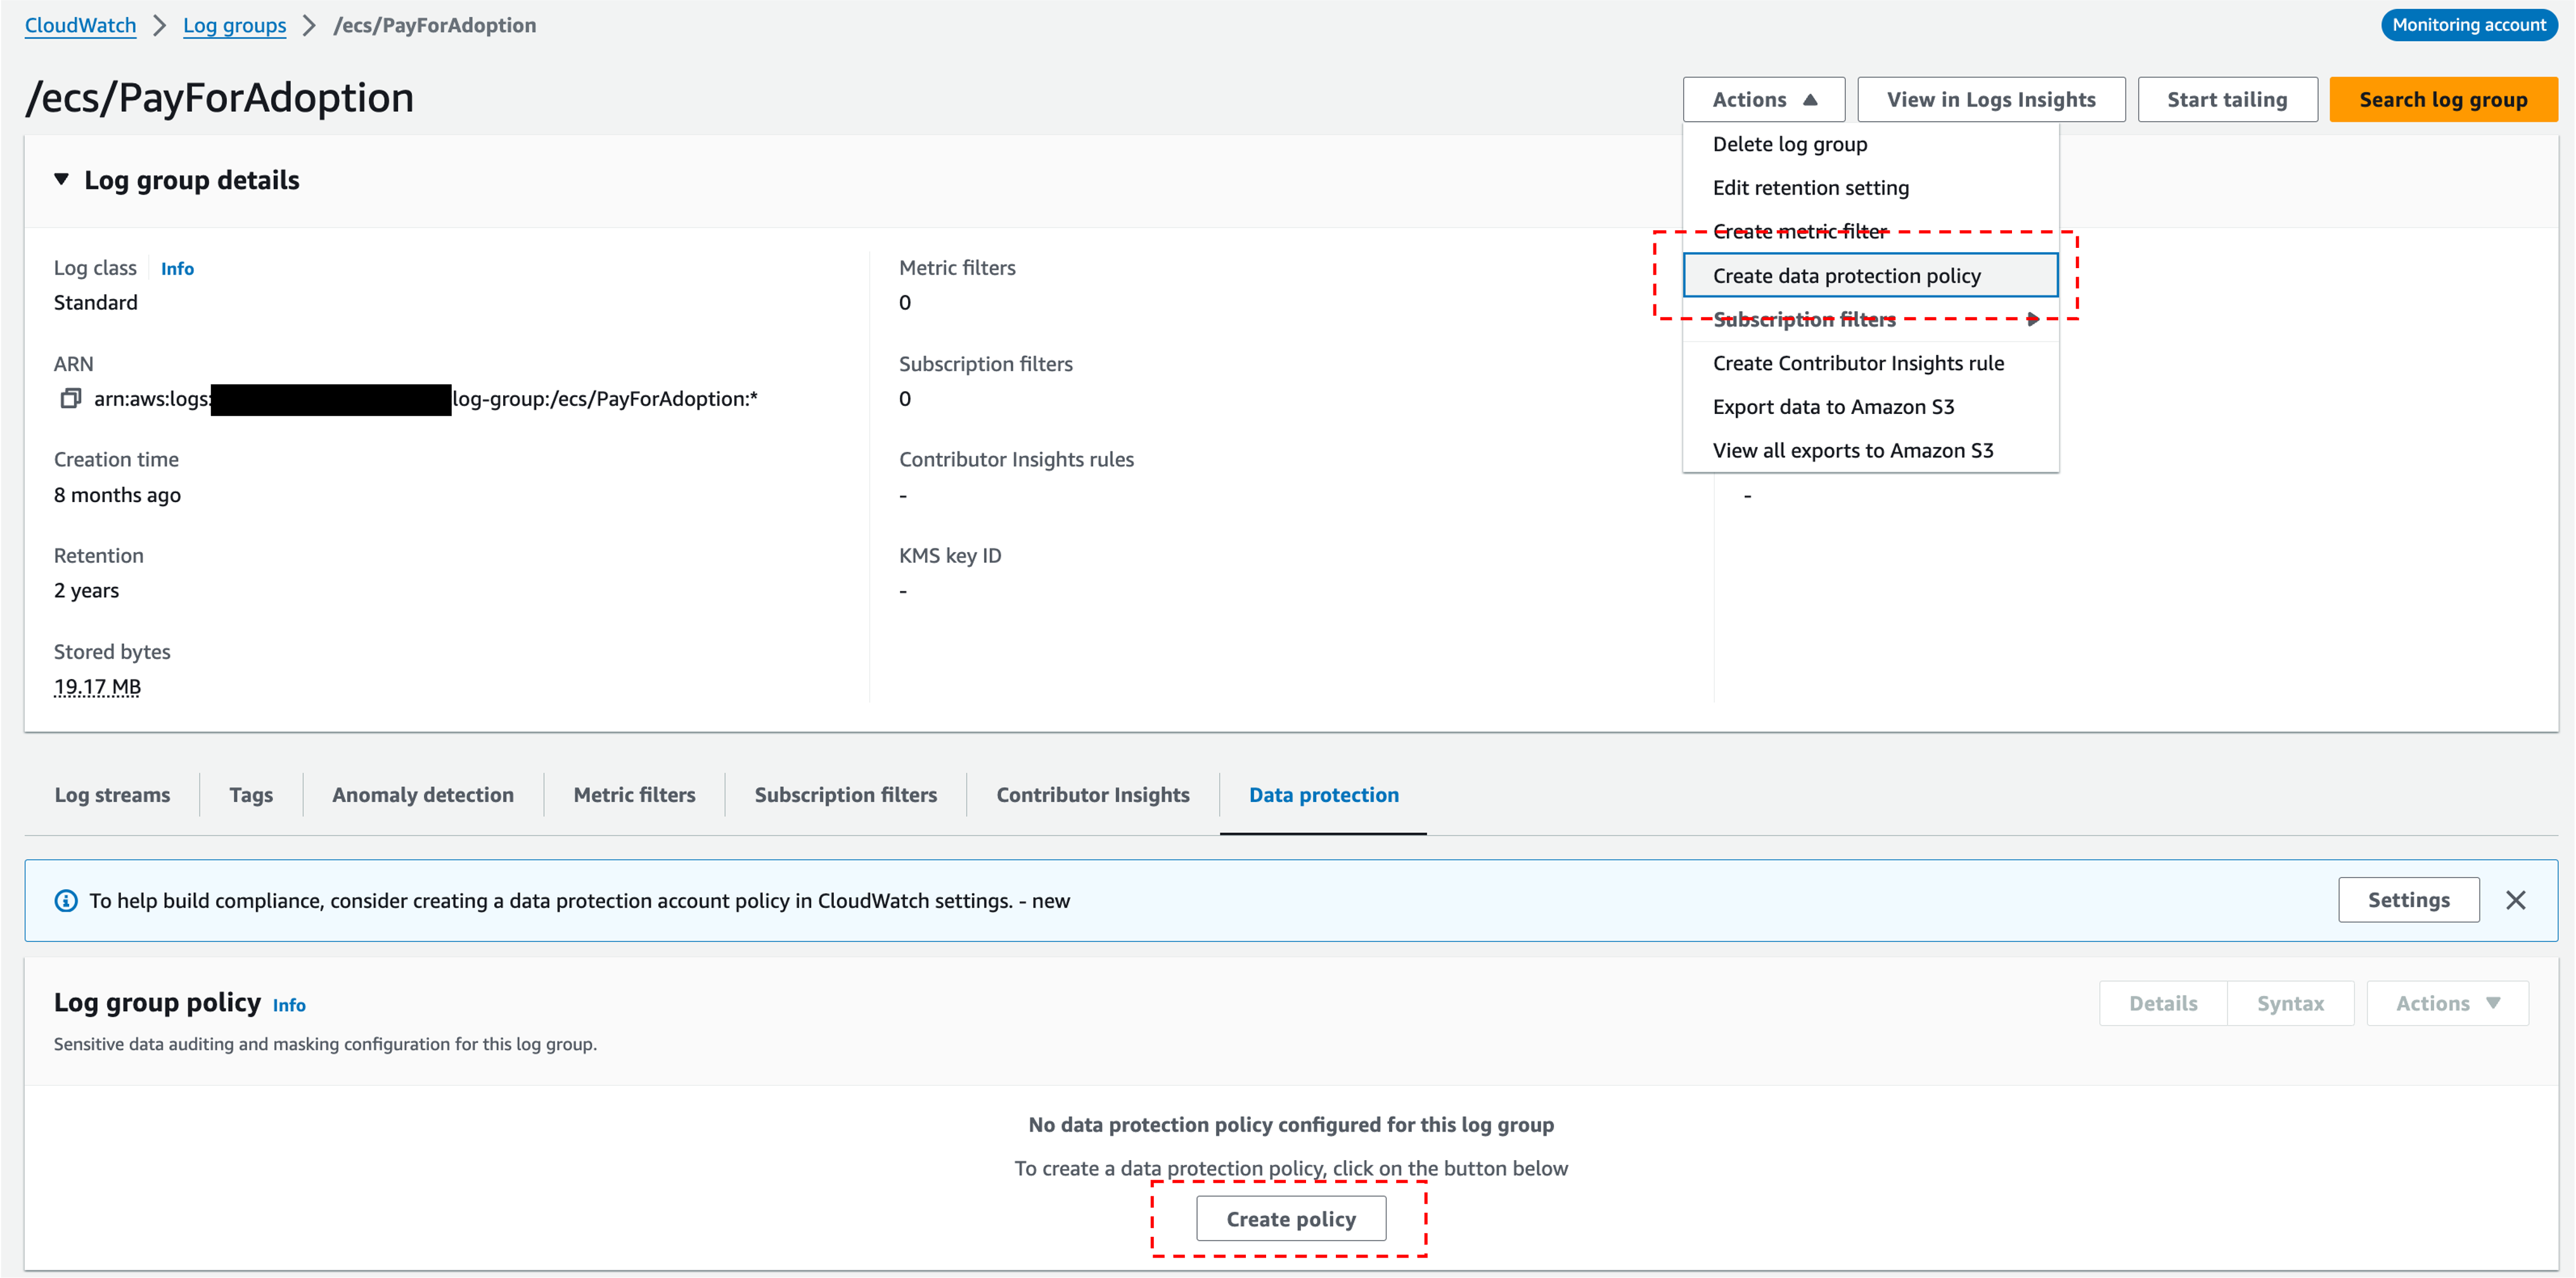
Figure 1: Create data protection policy in CloudWatch console
- Choose the managed data identifiers as per your business needs
- Create a new log group or select an existing log group where audit findings can be sent
- Choosing an audit destination is optional but we highly recommend for auditing and reporting
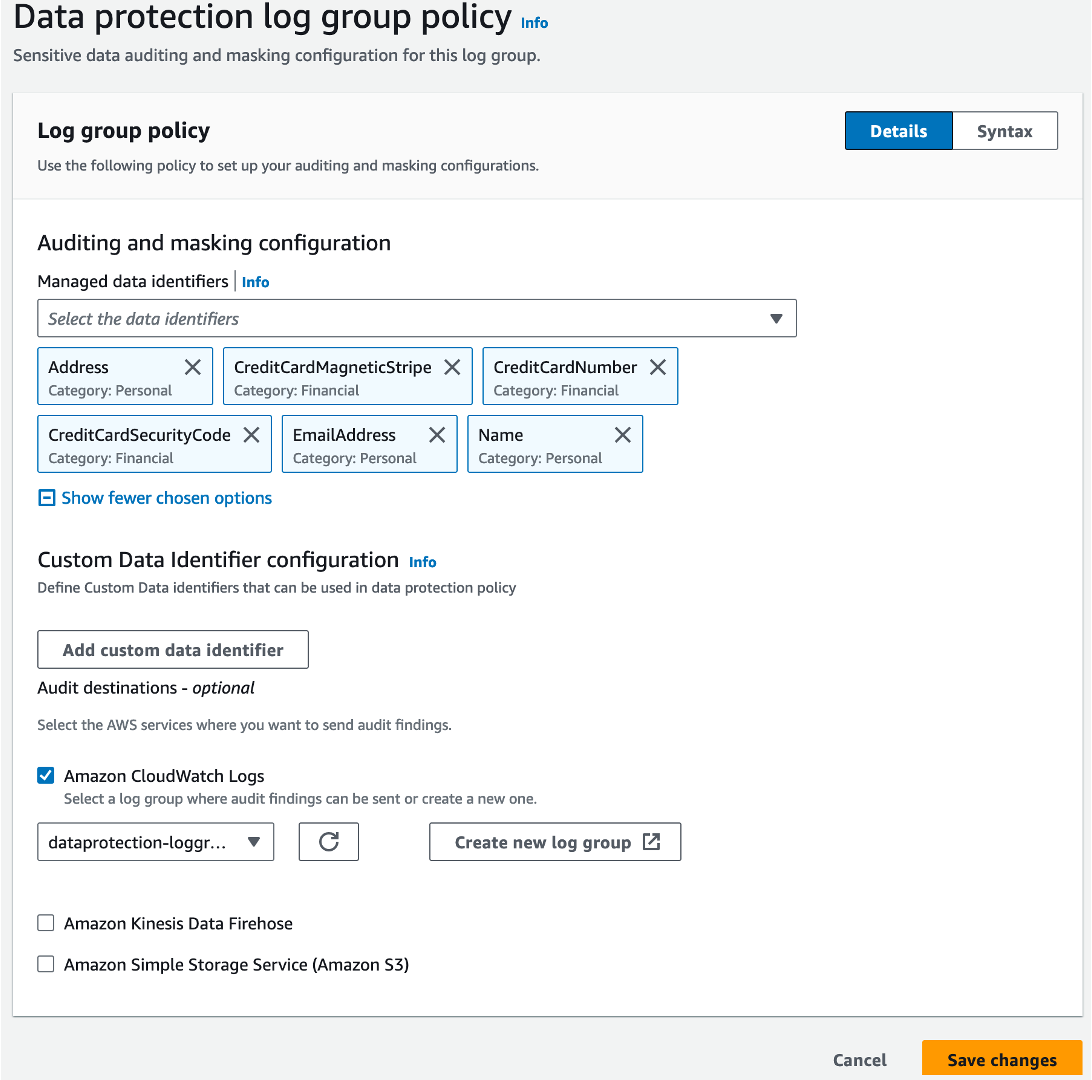
Figure 2: Save data protection policy configuration
Enable CloudWatch Logs data protection at Account level
You can conveniently enable data protection policy at account level to apply to all the log groups in your account. This will be applied to current logs groups and any future log groups that may be created under this account.
- Navigate to Settings at the bottom left, choose Logs tab and choose Configure
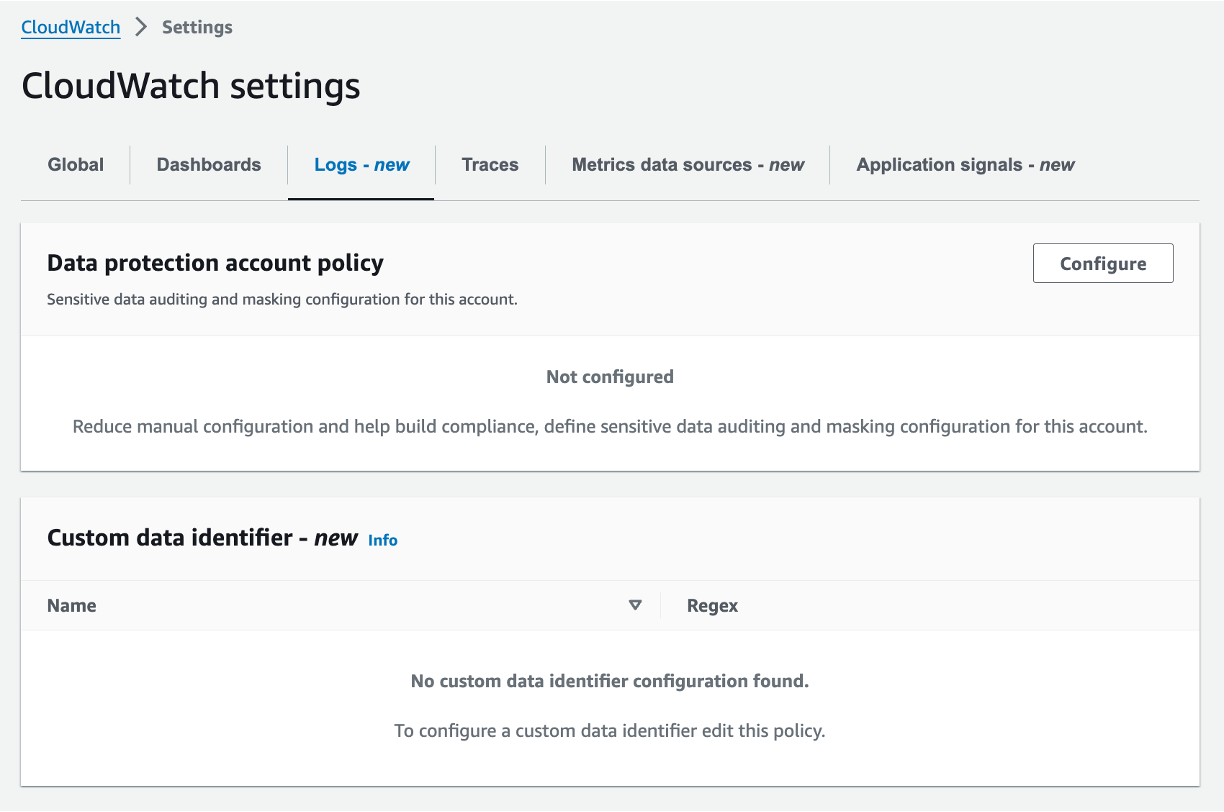
Figure 3: Create data protection account policy
- Select all the Managed data identifiers that are relevant to your business needs, choose destination for audit findings and Activate data protection.
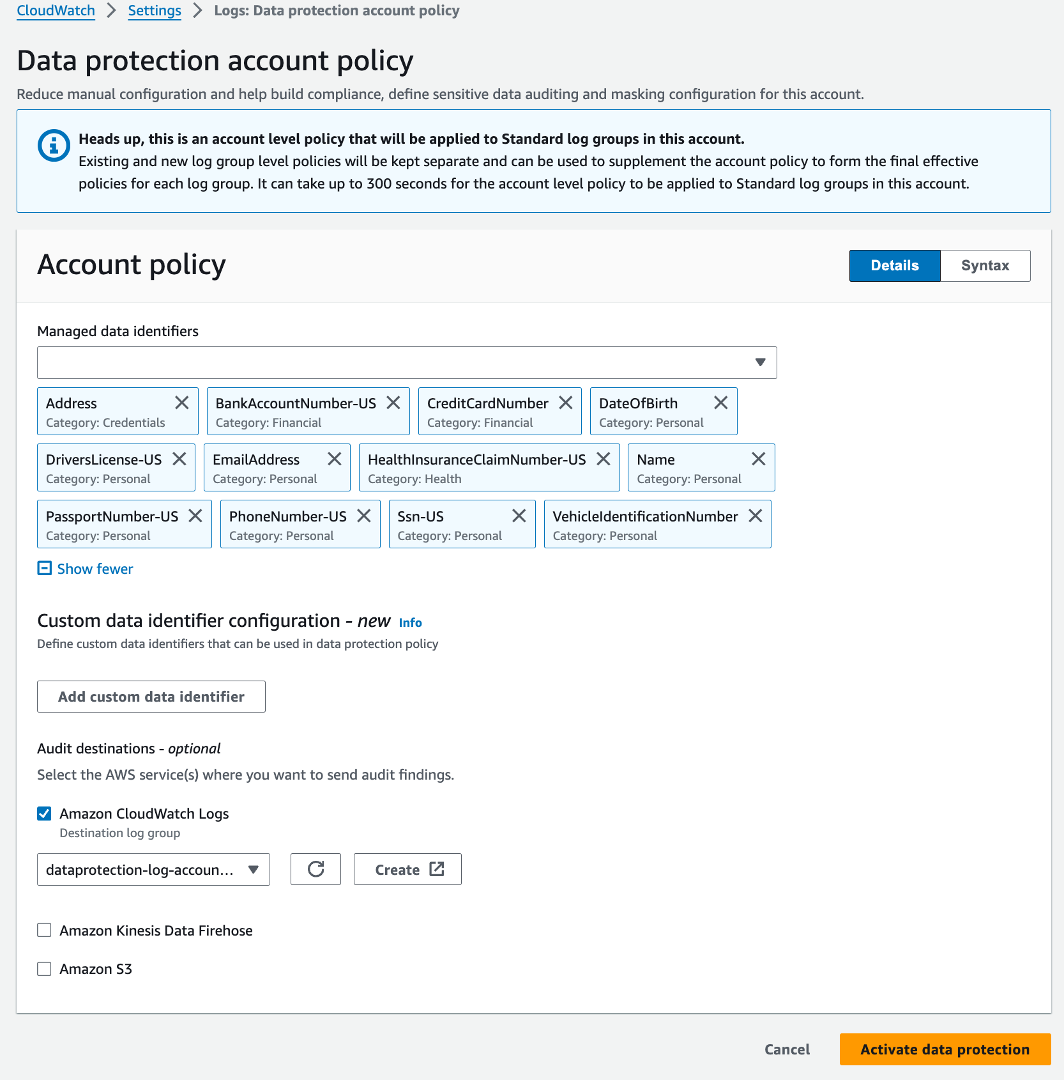
Figure 4: Save data protection account policy
Custom data identifier configuration
You can use custom data identifiers (CDIs) to define your own custom regular expressions to address use cases where managed data identifiers are not available. A common example for financial institutions is the SWIFT code, also known as the Business Identifier Code (BIC). SWIFT code is an international standard for routing business transactions and identifying business parties. SWIFT code is an 8 to11 character code that identifies a financial institution’s name, country, location and branch. While SWIFT code by itself is not considered sensitive, you may choose to protect it in transaction logs as per your business needs. You can use custom data identifiers in combination with managed data identifiers as well. You can also send audit findings to an Amazon Simple Storage Service (Amazon S3) bucket for longer retention needs or Amazon Data Firehose for real-time streaming.
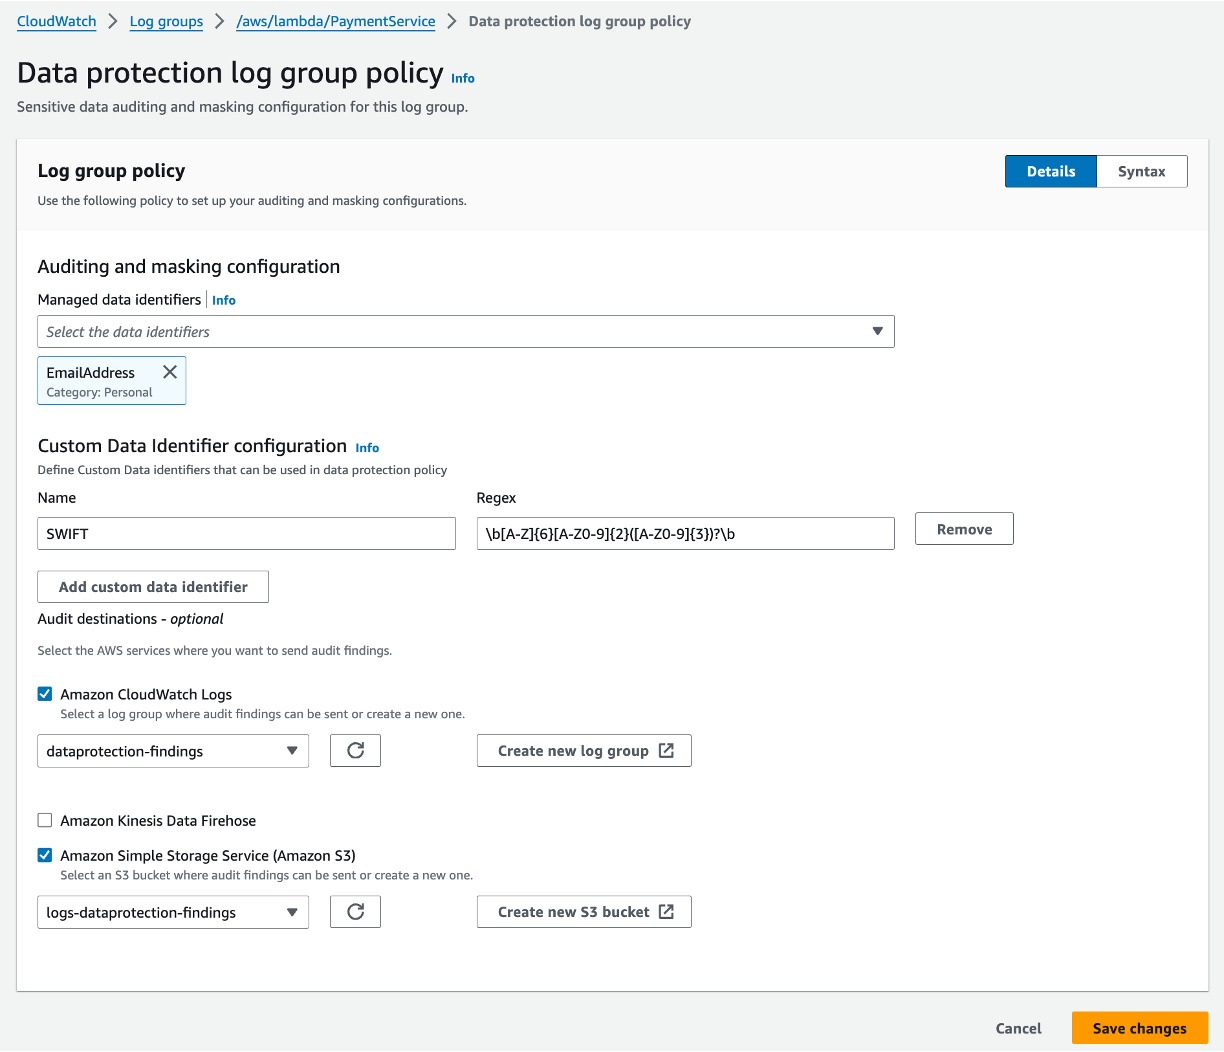
Figure 5: Define custom data identifier configuration
Verify masked sensitive data in logs
You can verify that sensitive data is being masked by viewing the logs in your log group. This can be done in near real time with CloudWatch Live Tail, or you can use CloudWatch Logs Insights to query your log data.
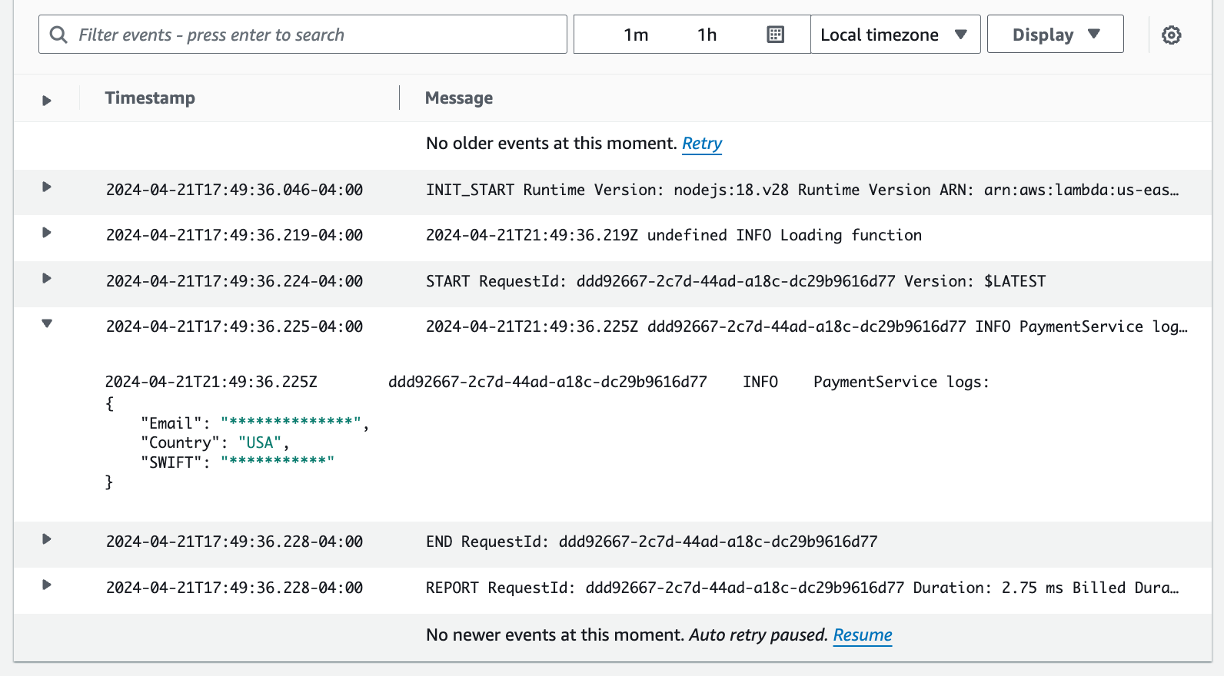
Figure 6: Verify sensitive data masking in logs
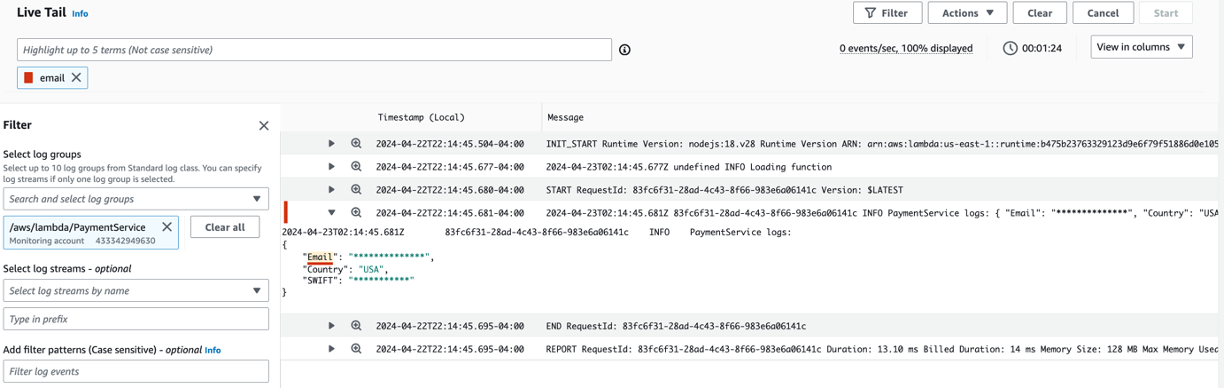
Figure 7: Verify sensitive data masking in Live Tail
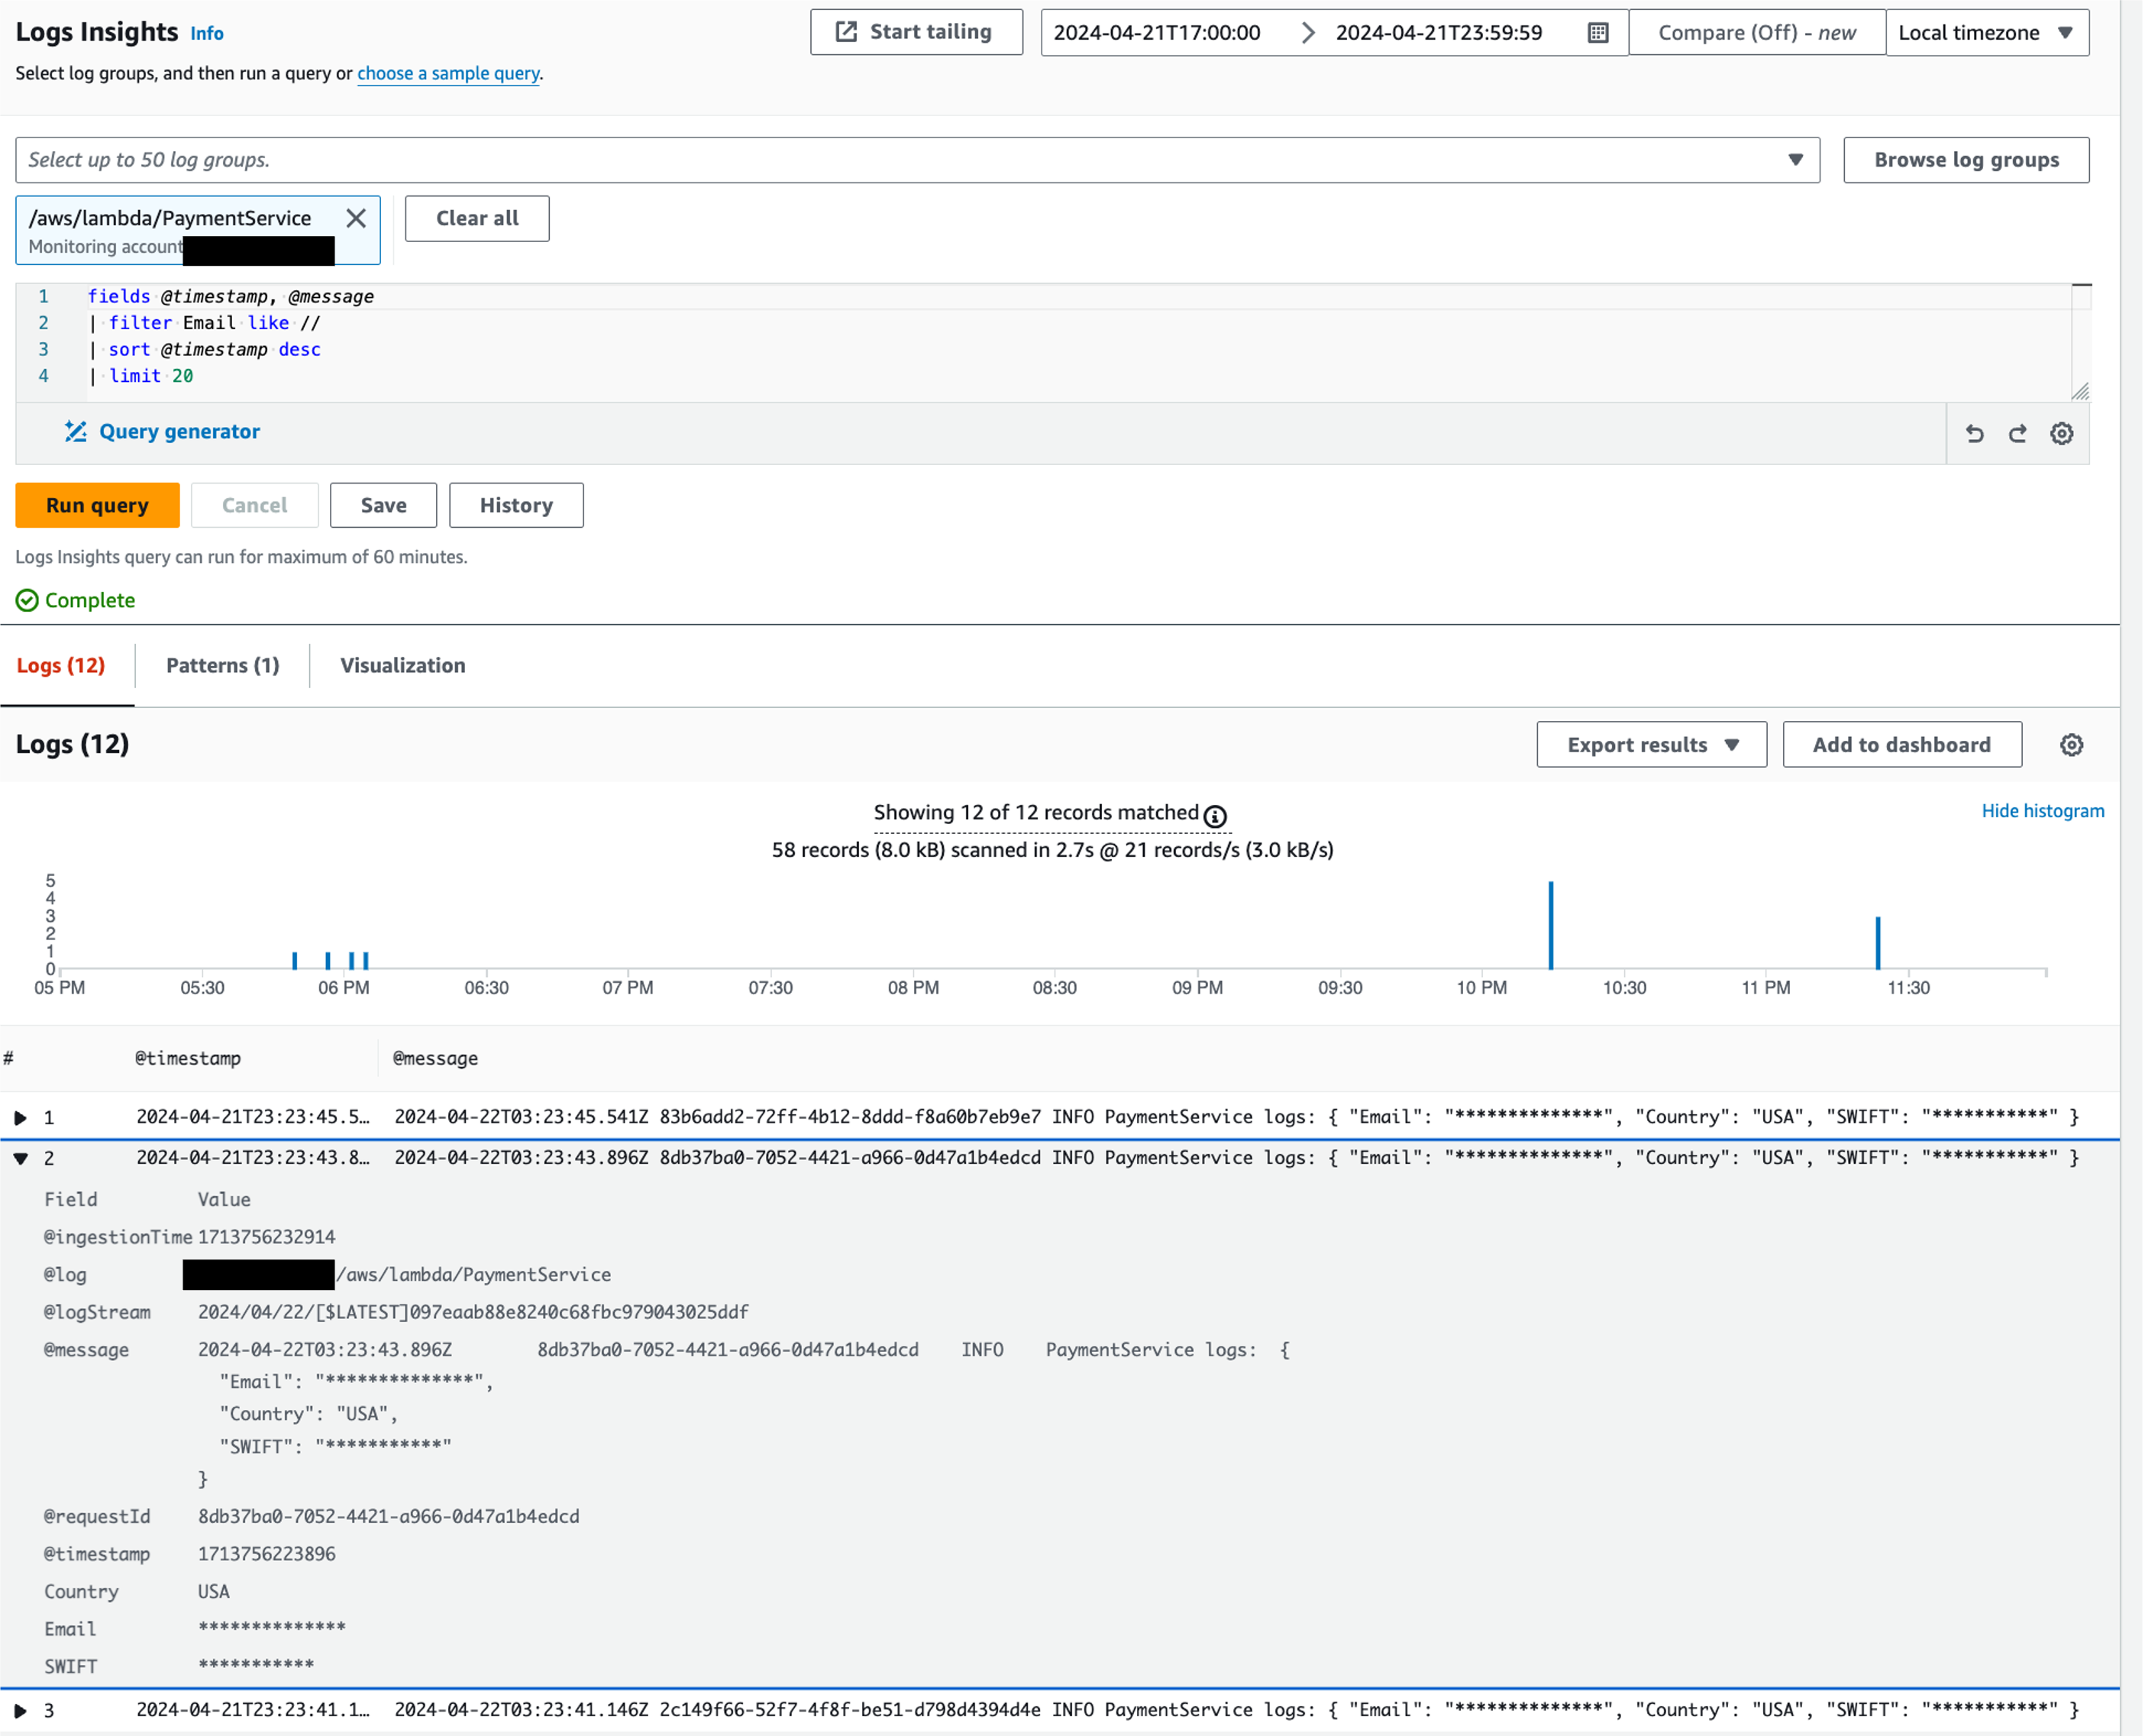
Figure 8: Verify sensitive data masking in Logs Insights
View unmasked data with elevated privileges
To view unmasked data, you must have the logs:Unmask permission. You can use the following example CloudWatch Logs Insights query to see the logs unmasked.
fields @timestamp, @message, unmask(@message)
| sort @timestamp desc
| limit 20
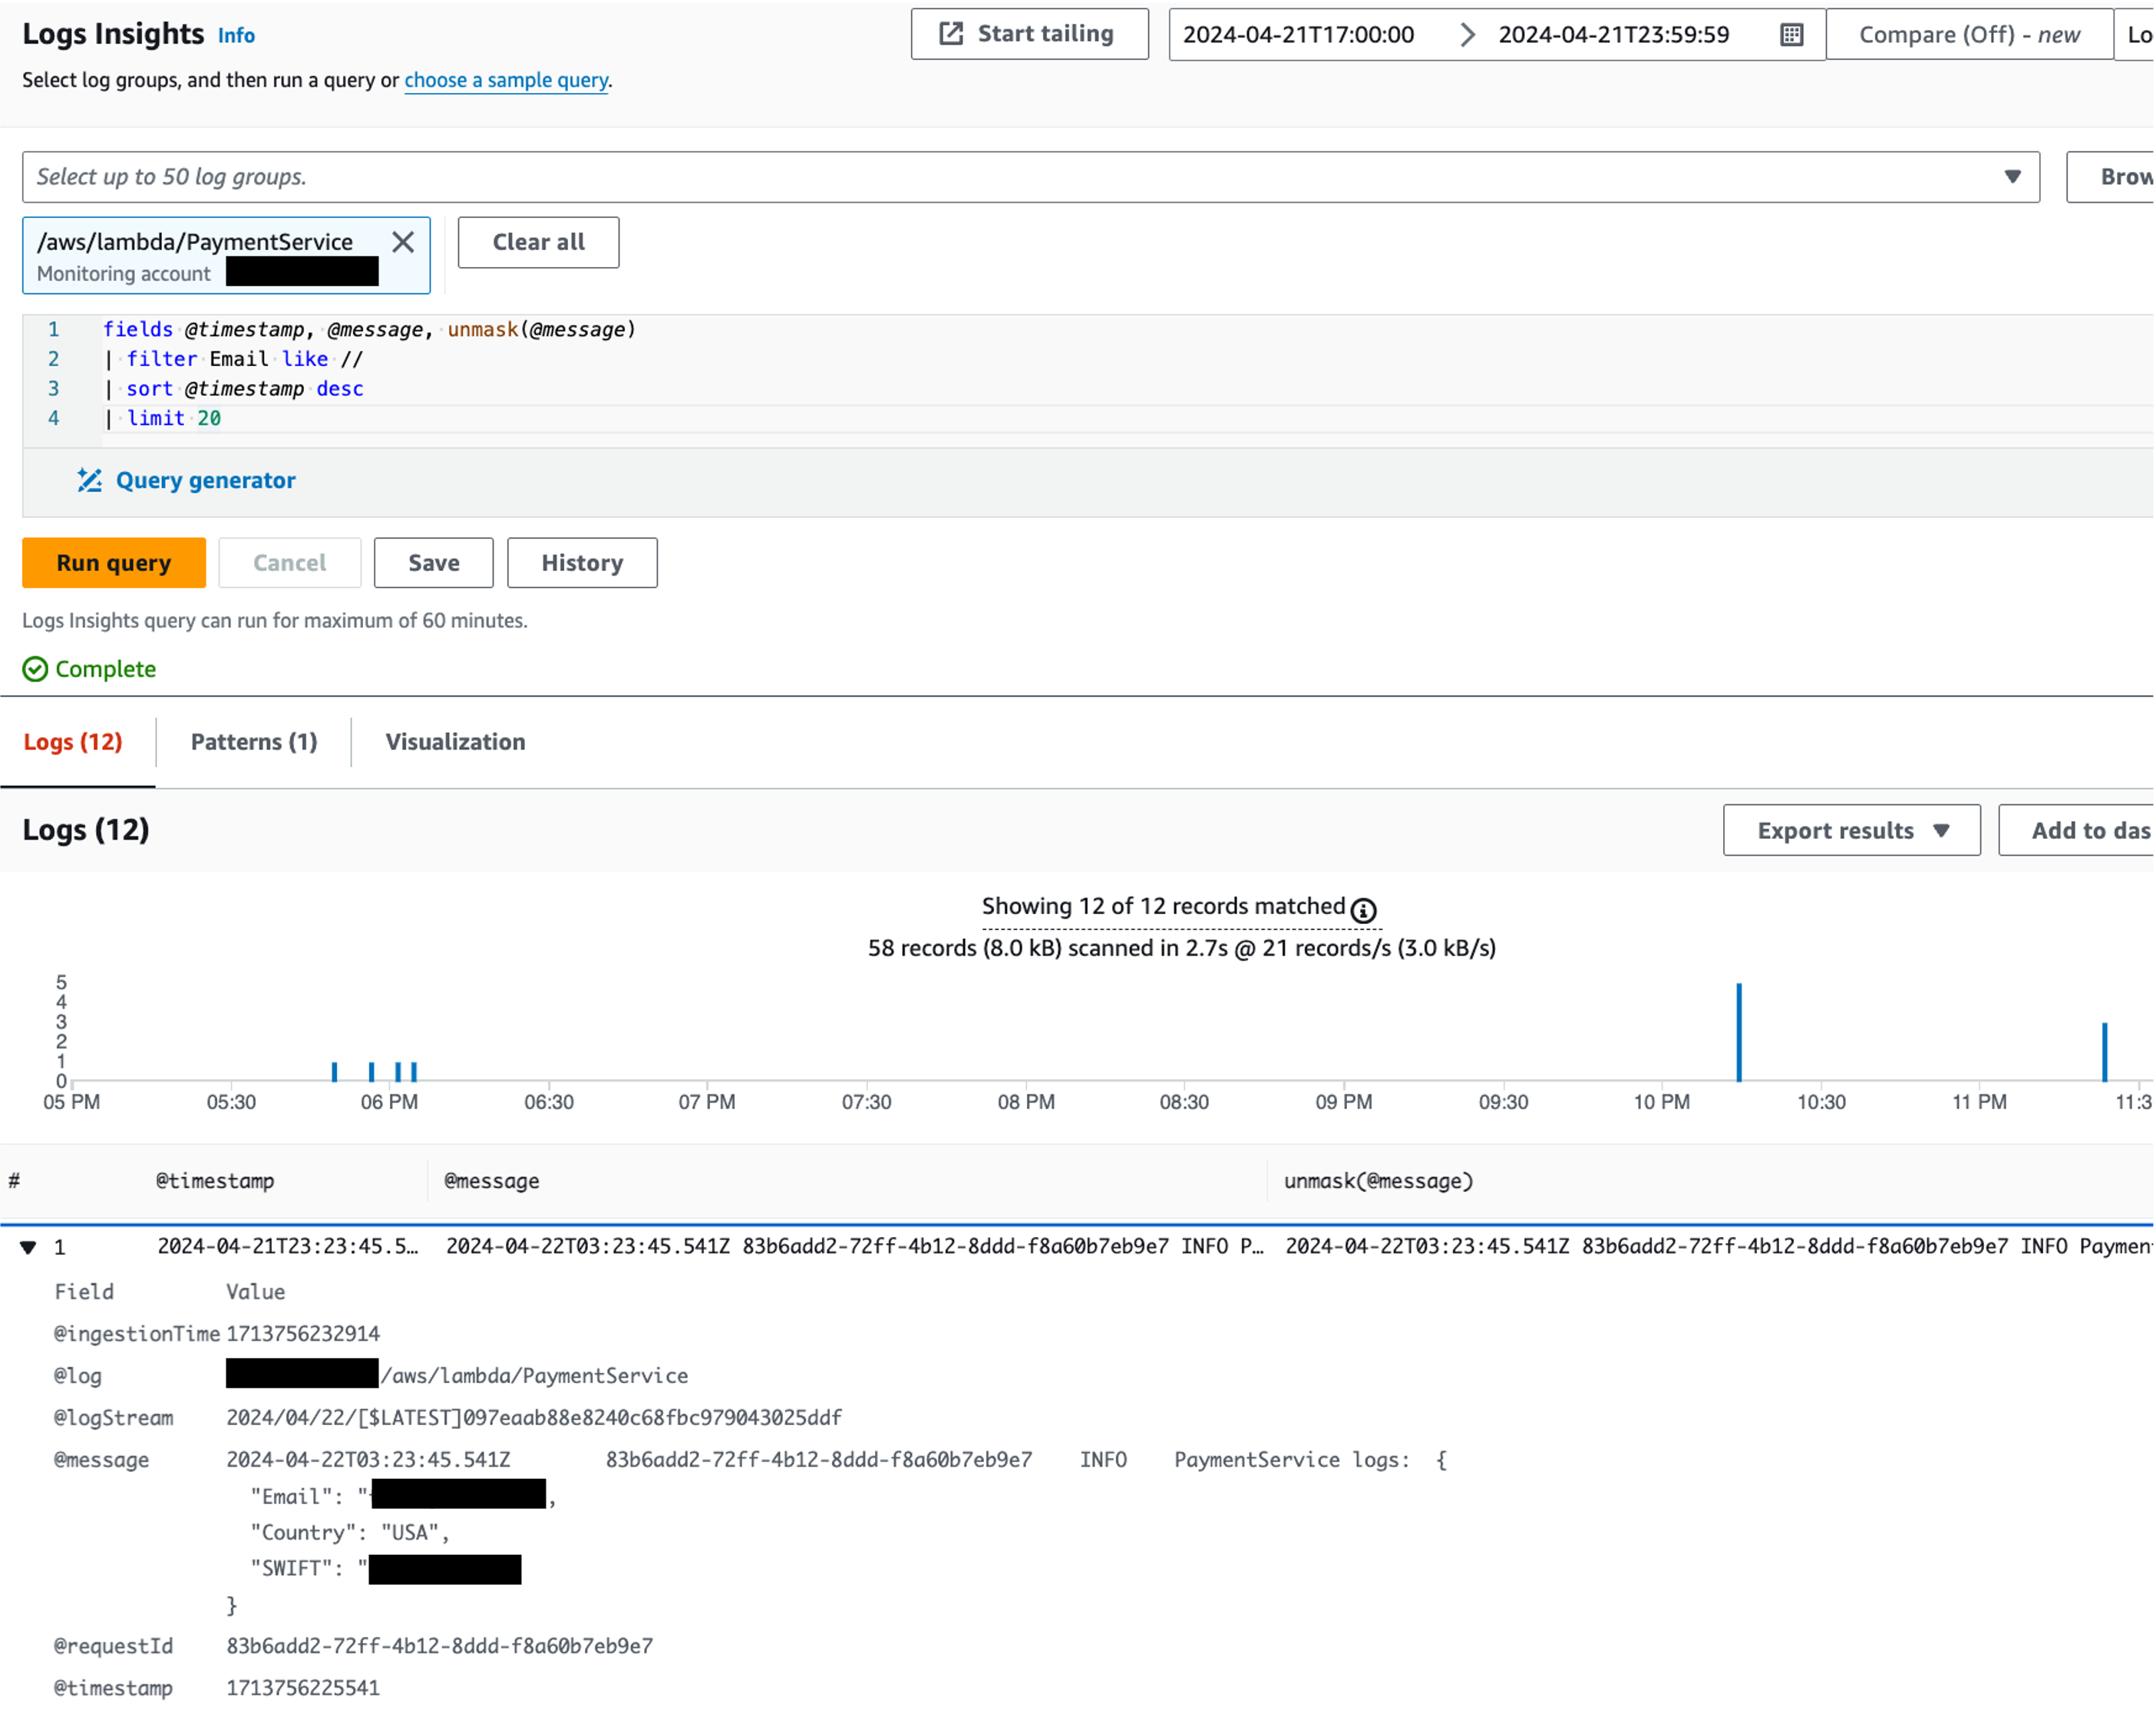
Figure 9: View unmasked data with elevated privileges
Define alarms and notifications on the findings
Out of the box, CloudWatch creates a default metric named LogEventsWithFindings, to count the number of log events that contain sensitive data in a particular log group. You can define CloudWatch alarm around this metric to continuously monitor and get notified when sensitive data is detected for further remediation actions.
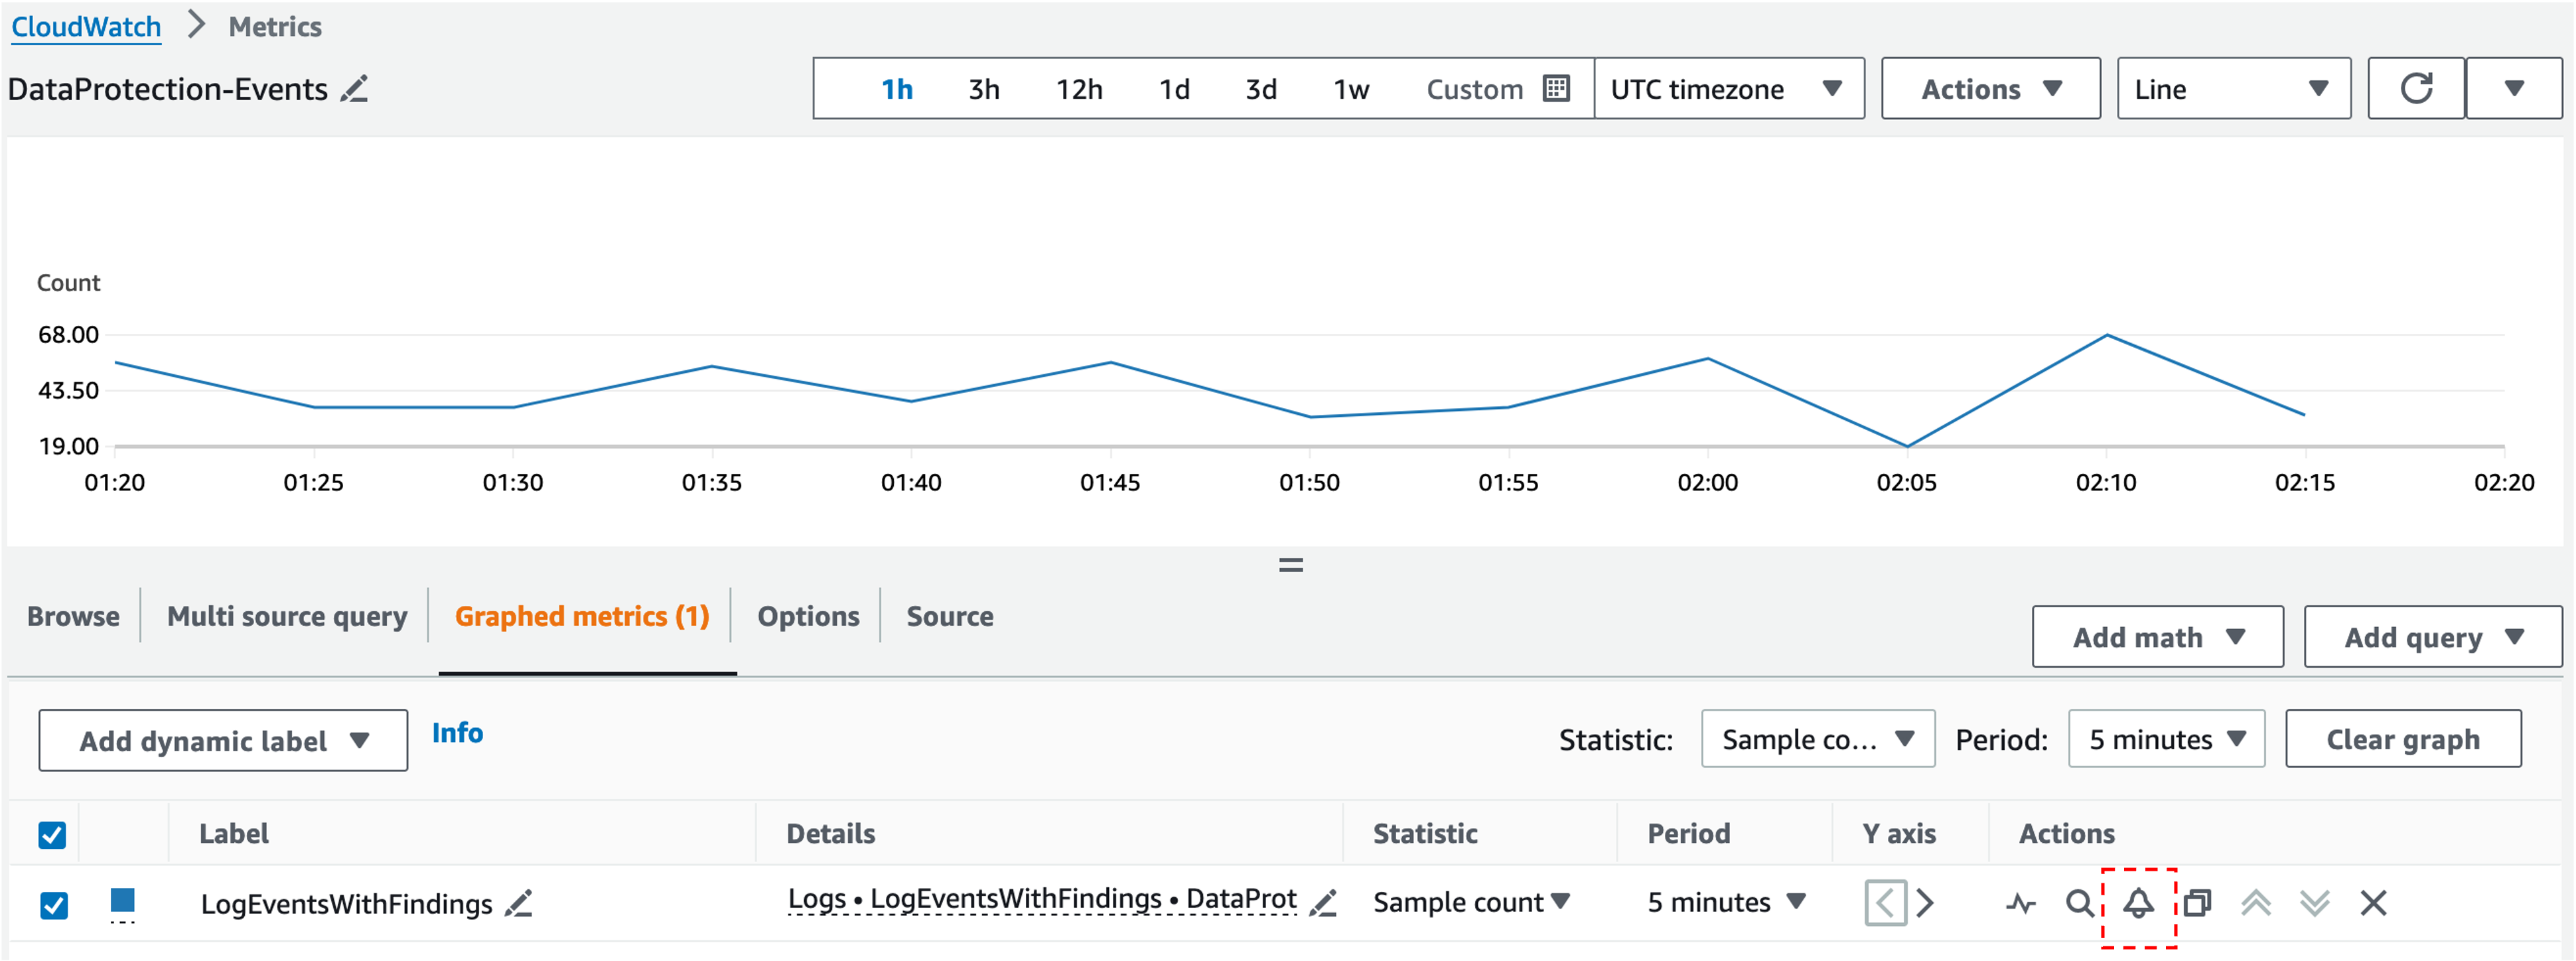
Figure 10: Define an alarm for LogEventsWithFindings default metric
Below is an example Alarm definition. Choose Sample count statistic to collect the number of data points during the period, which increments counter by 1 for every occurrence. Select the Static threshold type, Greater/Equal condition and threshold value of 1. Create or choose an existing Amazon Simple Notification Service (Amazon SNS) topic to send the notification. Configure your preferred email to subscribe to that topic.
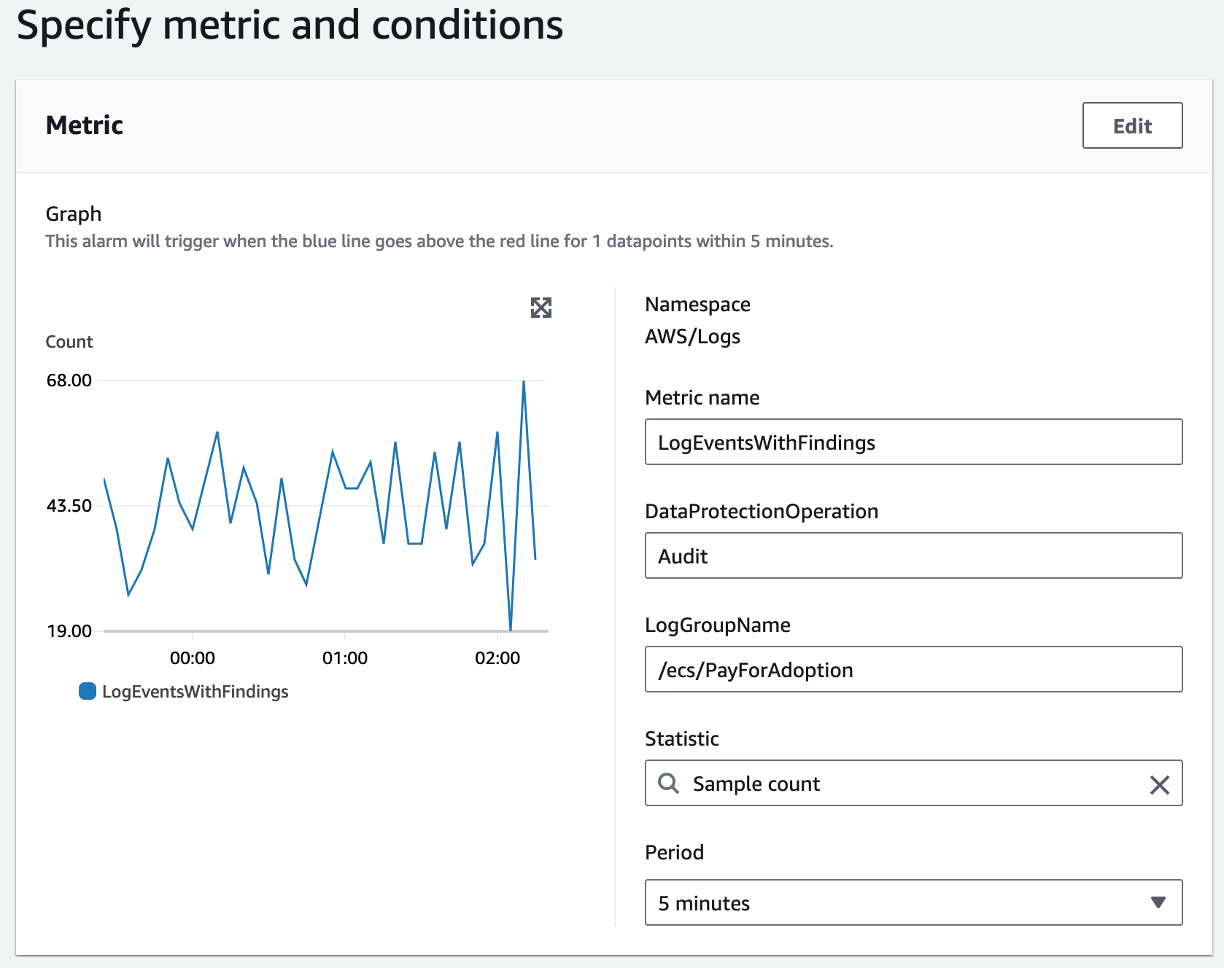
Figure 11: Specify metric settings for the alarm
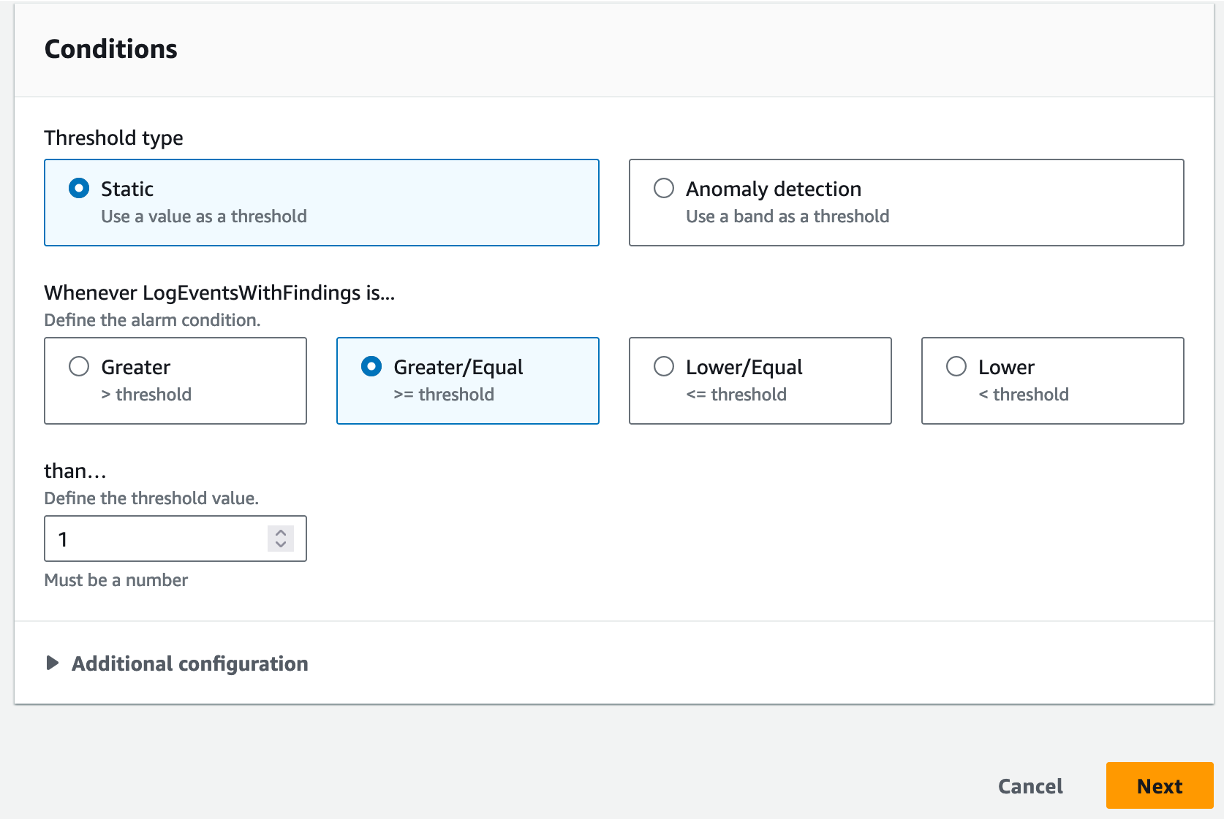
Figure 12: Specify metric conditions for the alarm
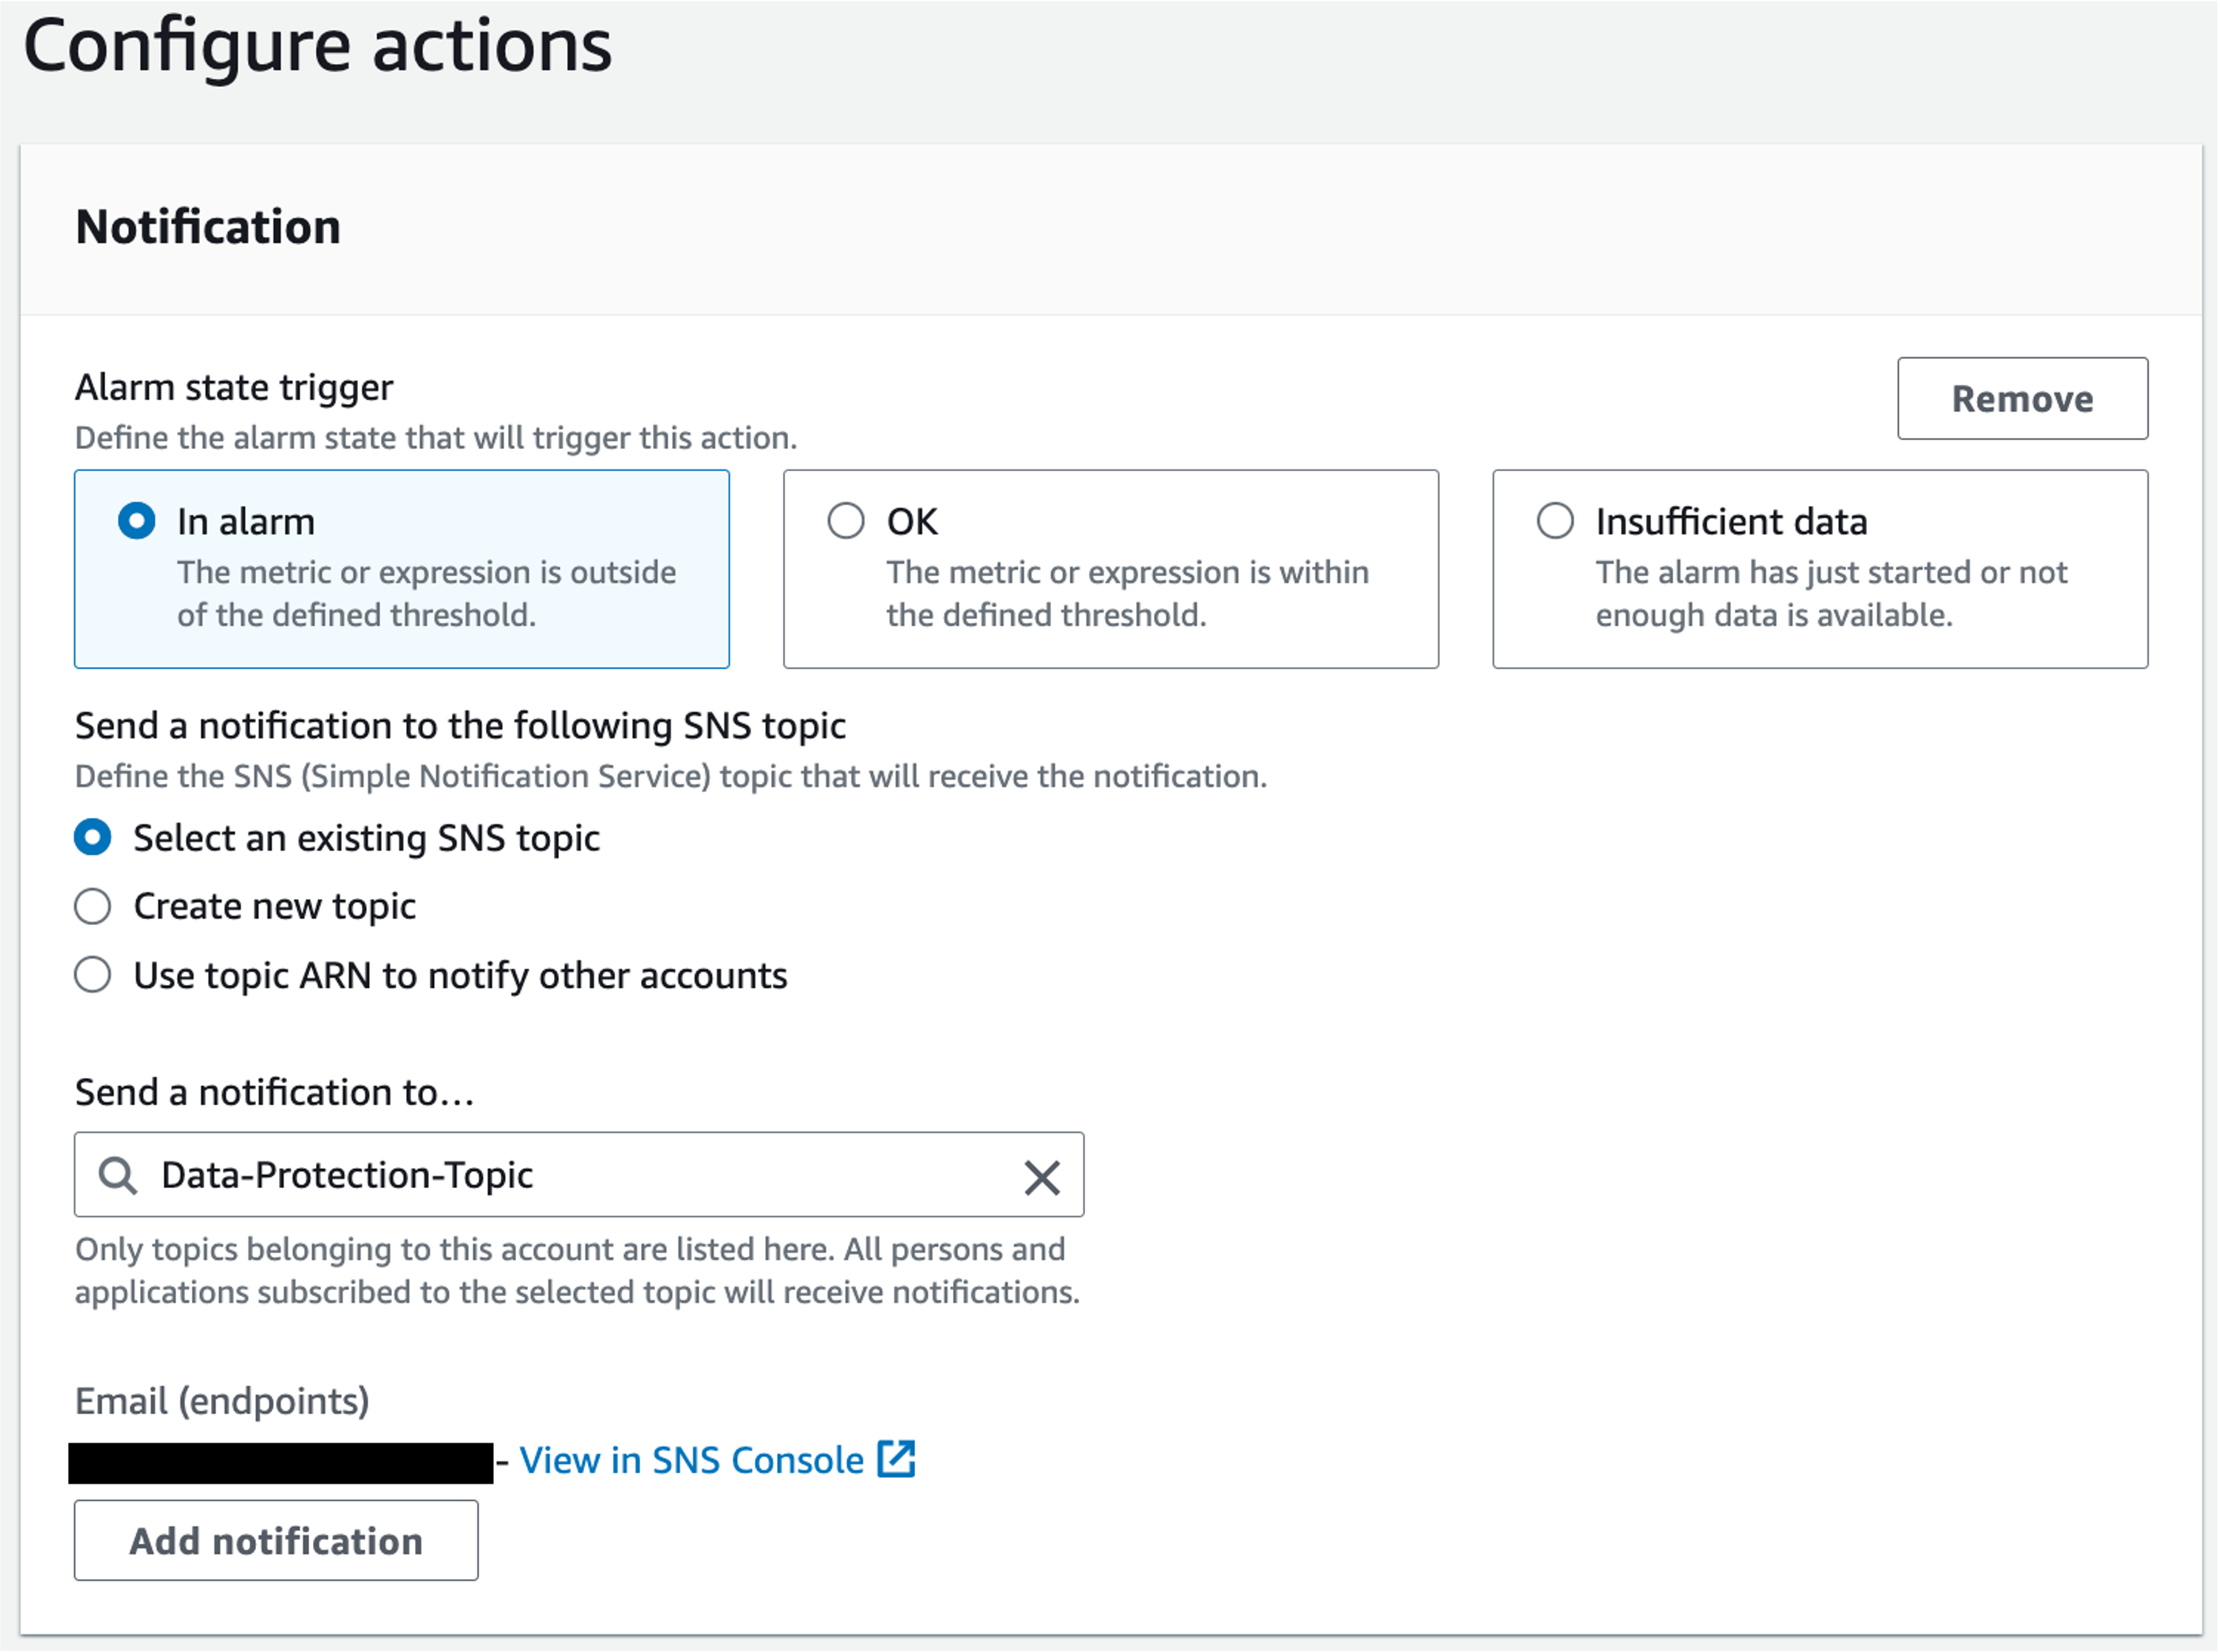
Figure 13: Configure a notification to the SNS topic for the alarm
Sensitive data audit findings and reporting
You can quickly get the sensitive data event count for each log group on the Log Groups page.
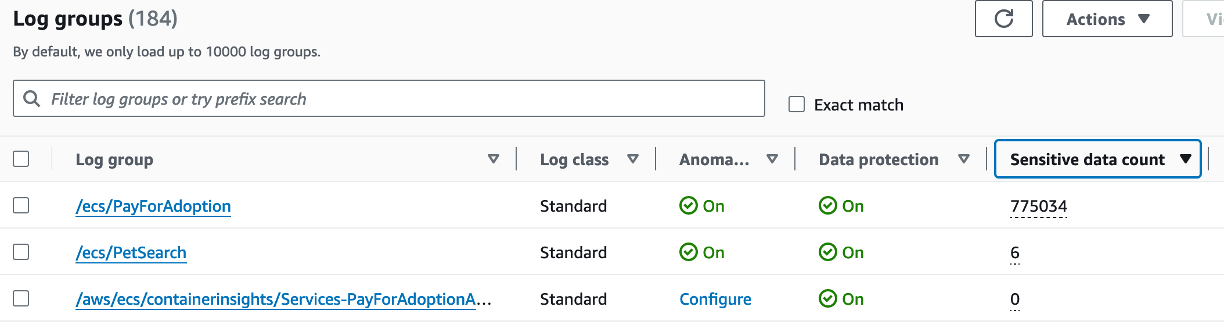
Figure 14: View sensitive data count on the Log groups page
In accordance with your compliance needs, if you chose to send the sensitive data audit findings to CloudWatch Logs, then the audit findings are generated as below for each log event. You can easily identify the event source by looking at the log group resource ARN and data identifiers for which sensitive data is detected. You can also choose to send these audit findings to Amazon S3 or Amazon Data Firehose.
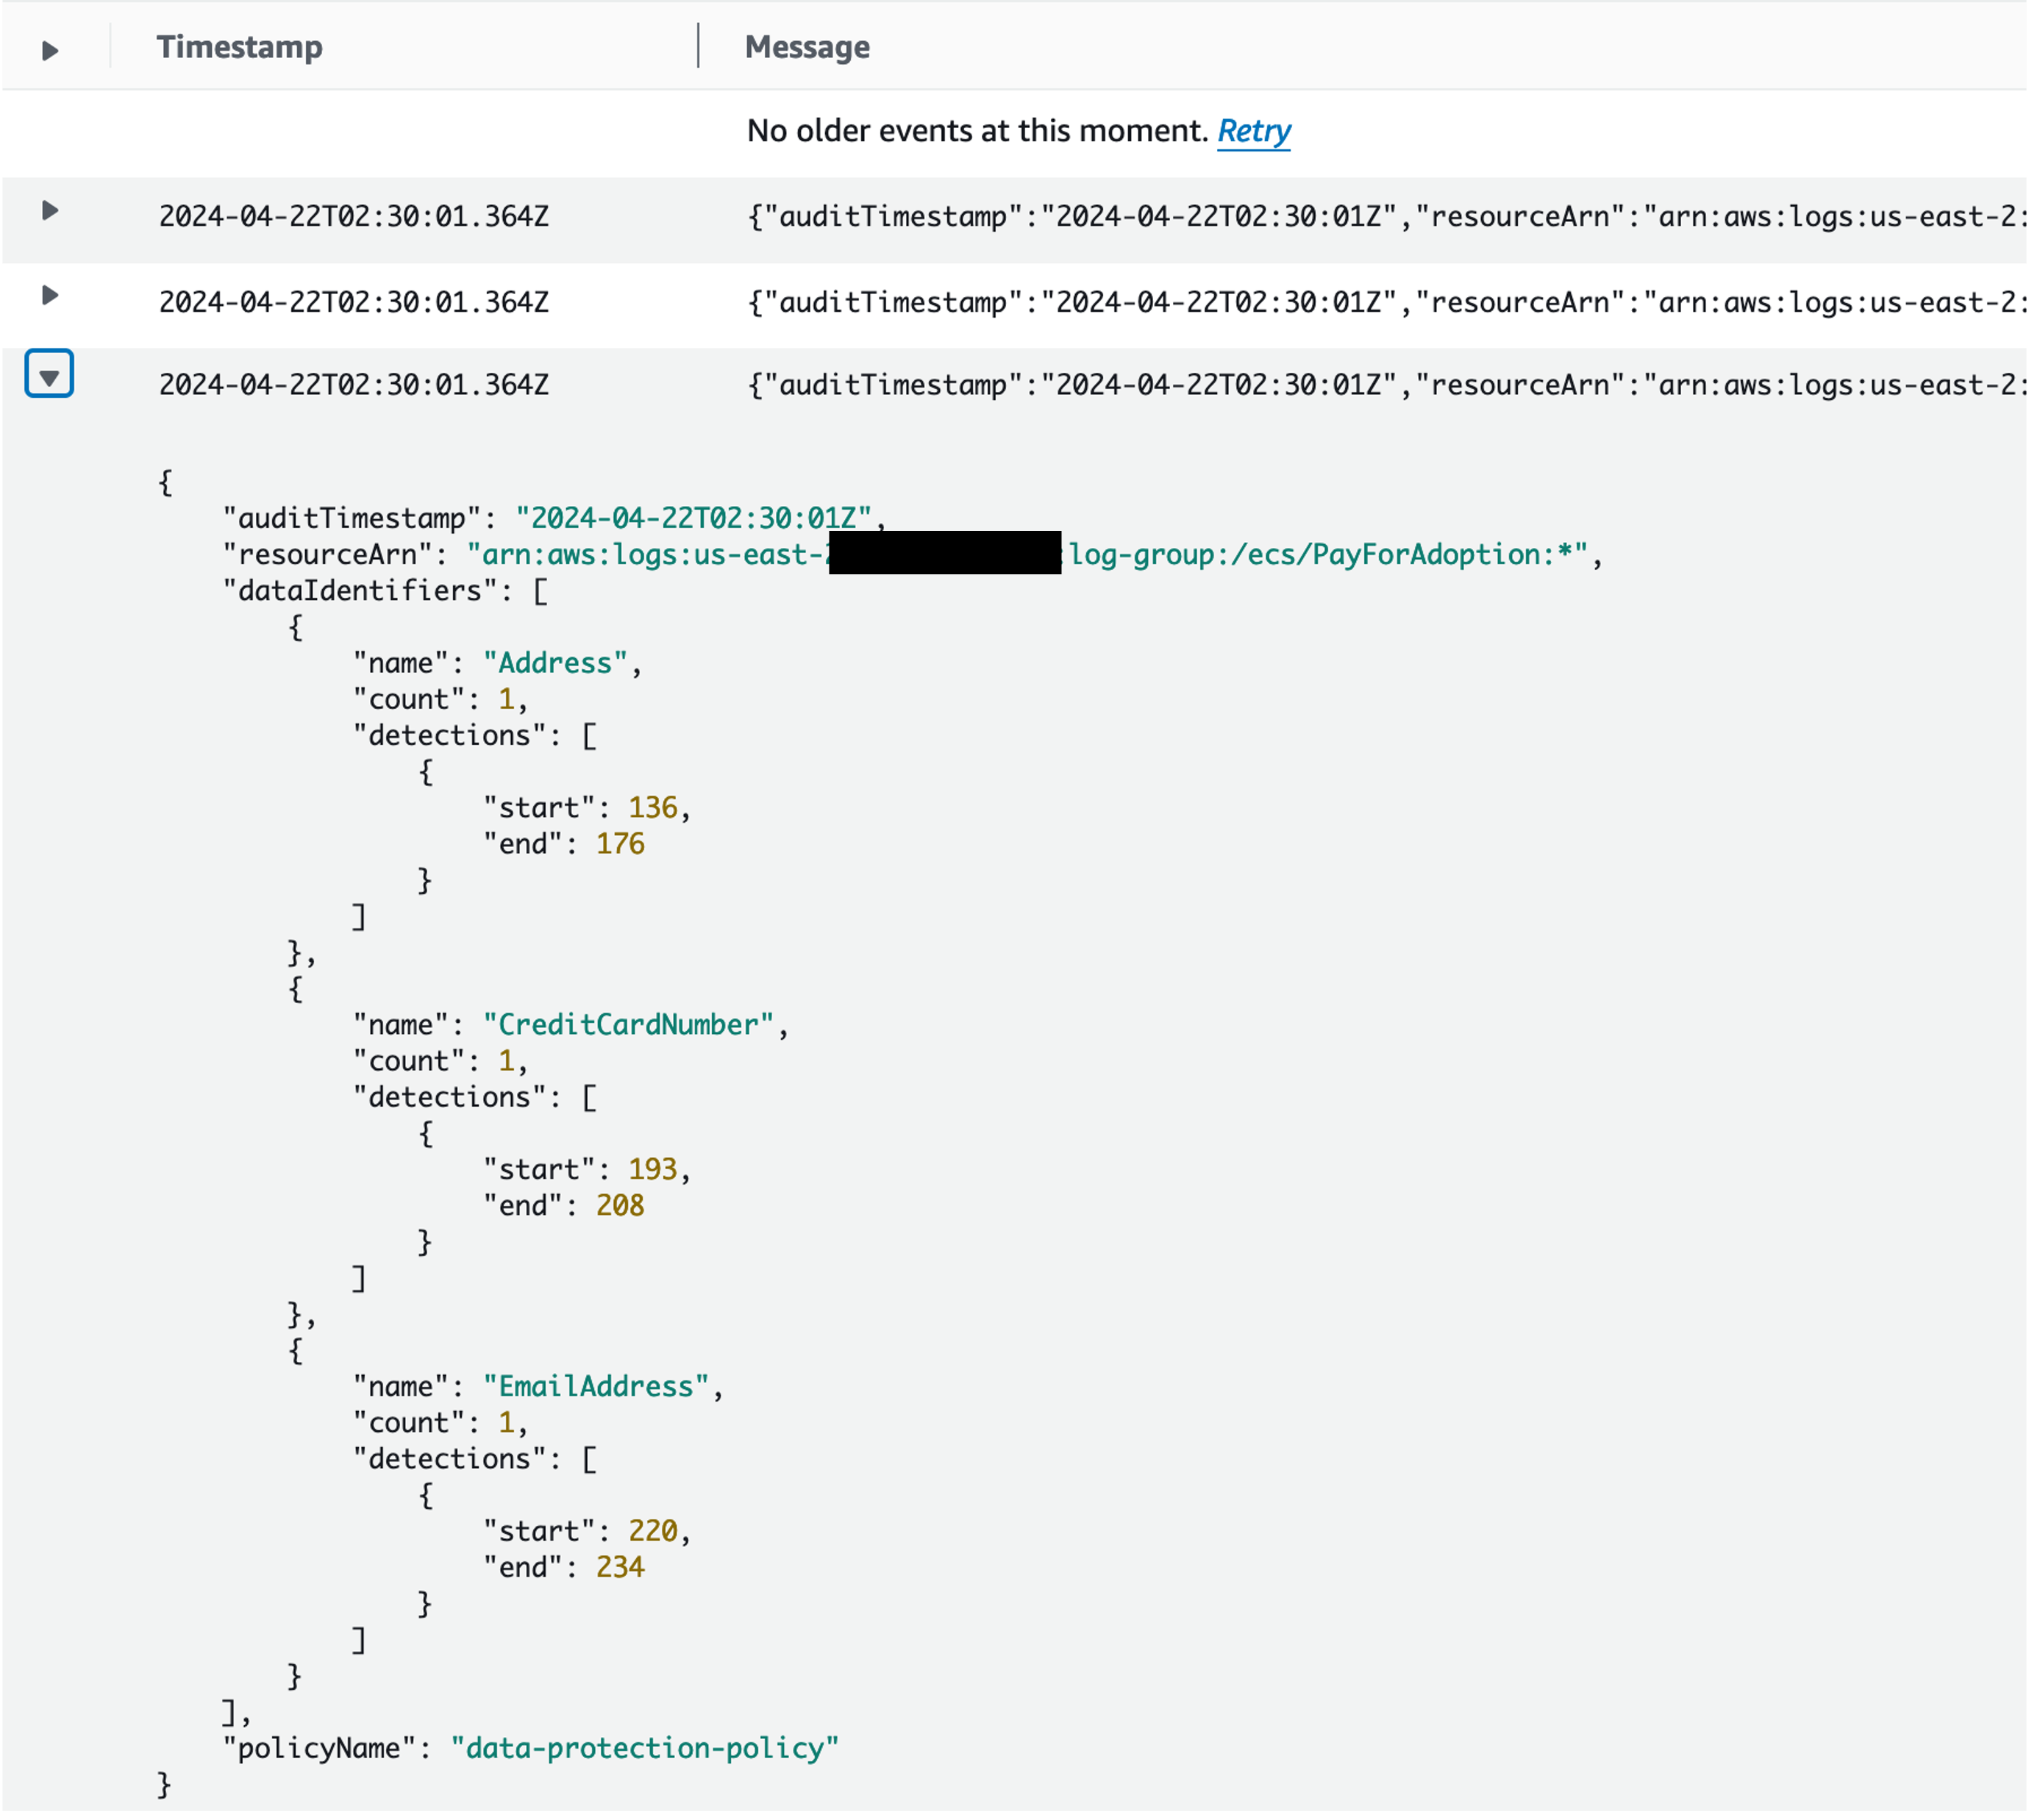
Figure 15: View log event structure for sensitive data audit findings
Conclusion
In this blog post, we explored how customers with applications that handle sensitive data can leverage Amazon CloudWatch Logs data protection capabilities to help detect and protect sensitive data in logs to help meet compliance requirements for data privacy regulations. We also showed you how to enable CloudWatch Logs data protection, verify sensitive data masking, view unmasked data with elevated privileges, collect and report sensitive data audit findings, define alarms and notifications on the findings for further remediation actions. Visit Security in Amazon CloudWatch Logs to learn more about the overall security in CloudWatch Logs.