AWS Cloud Operations Blog
Improved management of Amazon CloudWatch Alarms using AWS Systems Manager OpsCenter
In today’s world of DevOps, continuous deployments, and data-driven decisions, we are gathering more and more data from our applications. From metrics to logs to traces to time series data the volume of information being collected is growing at an exponential rate. This enormous amount of data is causing us to rethink traditional approaches to instrumentation and application monitoring.
Here at AWS, our primary tool for collecting observability details for an application is Amazon CloudWatch. It is used to collect metrics and logs from over 70 services and is available for customers to instrument their applications. With Amazon CloudWatch, you are able to collect metrics and logs; monitor your containers and Lambda functions; query your logs and create alarms. On a monthly basis it collects over 1 quadrillion (1,000 trillion) metrics observations, ingests over 100 petabytes of logs, and triggers 3.9 trillion events.
CloudWatch Alarms
CloudWatch Alarms allow you to monitor a metric and raise an event when a certain threshold is passed. This allows you to automate routine tasks such as scaling of servers or restarting servers that have stopped unexpectedly. For example, you can monitor the incoming number of requests for your web application and scale your Amazon Elastic Compute Cloud (EC2) instances accordingly, or you can have CloudWatch monitor AWS CloudTrail for changes to production Security Groups. When the security group is changed, you can invoke an AWS Lambda function and isolate the affected resources.
CloudWatch also supports composite alarms. These alarms allow you to combine multiple metrics and create an alarm based on multiple conditions. For example, if your CPU is greater than 75% and memory is less than 25% and network traffic is greater than 50% then trigger a CloudWatch alarm. This ability to monitor multiple metrics and take automated actions is a fantastic capability that reduces false positives and increases the efficiency of a DevOps engineer.
Remediating a CloudWatch Alarm
Being able to raise alarms is great, as it provides a mechanism for identifying an anomalous situation and taking actions. You may have a legacy application that can’t be auto-scaled and need to manually scale an instance. You may be troubleshooting an intermittent issue and want to be notified when the issue is about to occur. There might be an issue that is handled automatically, but the occurrence frequency is increasing and you want to investigate the issue. For these types of situations, the alarm typically triggers an Amazon Simple Notification Service notification that feeds into an ITSM system. The resulting issue is then directed to an engineer for investigation. The engineer retrieves details of the issue from the ITSM and login to the AWS Management Console to investigate the alarm and affected resources.
New feature for centralizing CloudWatch Alarms
AWS has released a new feature that integrates CloudWatch alarms with AWS Systems Manager OpsCenter. With OpsCenter, you are able to centrally track issues, see the impacted AWS services, record actions taken, and use automated runbooks to act on the issue. When you create a CloudWatch alarm, you have a new notification action that automatically creates an OpsItem and sends it to OpsCenter. This new feature is available through the console, AWS CLI, or AWS CloudFormation.
This new notification action works in parallel with existing notification. You can continue sending notifications via Amazon SNS and additionally create issues in OpsCenter. This allows you to continue using your existing support mechanisms. OpsCenter also dedupes the alarm events. This can help avoid a “flapping issue” where an alarm going in and out of alarm state could potentially create 100s or 1000s of issues.
How to get started
To show you how to use this new feature, I am creating an alarm to monitor CPU usage of an EC2 instance. This is one of the most popular alarms created by customers and covers a variety of use-cases. You might be self-hosting a database server and there is a long-running query that requires intervention, you might have a processing service that is dealing with a backlog of items and requires scaling of hardware, or CPU utilization drops below an expected threshold and this indicates a problem with an expected workload.
In this case, the CloudWatch alarm triggers when CPU utilization is greater than 75% and will use the new Notification Action to create an OpsItem.
Creating the CloudWatch Alarm with AWS Management Console
If you create the alarm using the AWS Management Console, follow the standard process for creating a metric and setting the threshold. Remember that the new feature appears when you are selecting a notification action and will only be triggered in the alarm state. You can see the new OpsItem Notification Action along with existing Amazon SNS, Auto Scaling, and EC2 actions.
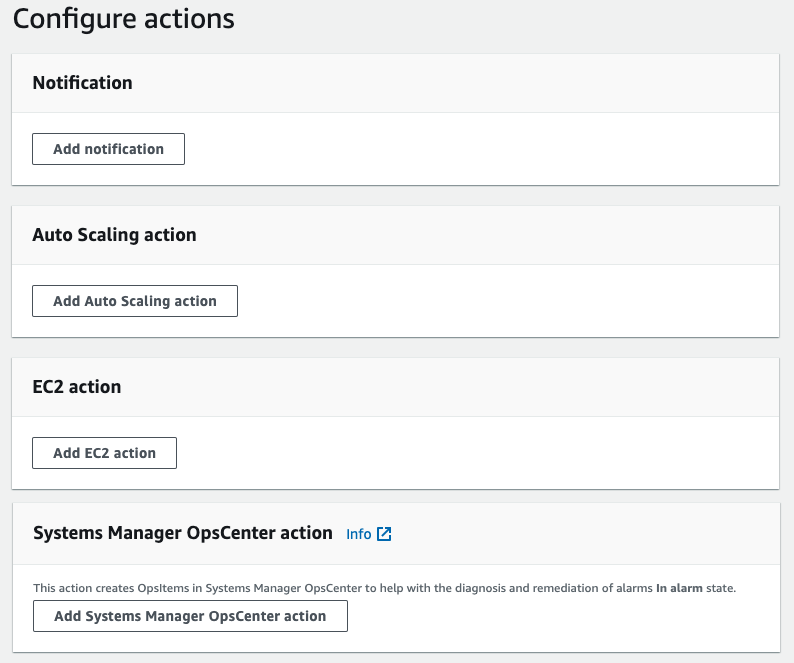
Figure 1 – Selecting Systems Manager Action
You select the Systems Manager OpsCenter action and set a required Severity and an optional Category. The Category is important as it allows you to group together similar CloudWatch alarms. You can use this Action in parallel with any of the other actions. This allows you to update existing alarms with new action and take advantage of centralized viewing of Alarms in OpsCenter.

Figure 2 – Setting parameters for Systems Manager action
Creating the CloudWatch Alarm with AWS CLI
In addition to using the console, you can create the alarm using the AWS CLI. The following command creates an Alarm when CPU > 75% for instance i-123456 and the Ops Item will have Severity 1 and Category of Perf.
aws cloudwatch put-metric-alarm
--alarm-name cpu-mon
--alarm-description "Alarm when CPU exceeds 75%"
--metric-name CPUUtilization
--namespace AWS/EC2
--statistic Average
--period 300
--threshold 75
--comparison-operator GreaterThanThreshold
--dimensions Name=InstanceId,Value=i-123456
--evaluation-periods 2
--alarm-actions arn:aws:ssm:us-east-1:123456789012:opsitem:1#CATEGORY=Perf
--unit Percent
Creating the CloudWatch Alarm with AWS CloudFormation
You can also use AWS CloudFormation to create the alarm:
CPUAlarm:
  Type: AWS::CloudWatch::Alarm
  Properties:
  AlarmDescription: Alarm when CPU exceeds 75%
  AlarmActions: ["arn:aws:ssm:us-east-1:123456789012:opsitem:1#CATEGORY=Perf"]
  MetricName: CPUUtilization
  Namespace: AWS/EC2
  Statistic: Average
  Period: 300
  EvaluationPeriods: 2
  Threshold: 75
  ComparisonOperator: GreaterThanThreshold
  Dimensions:
    - Name: InstanceId
      Value: "i-123456 "
Viewing the OpsItem
You can see that I’ve created the Alarm and it has been set to alarm state due to high CPU utilization.
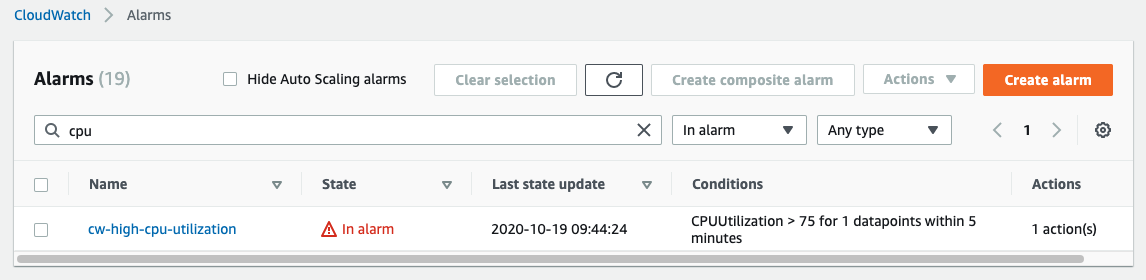
Figure 3 – CloudWatch alarms that are In Alarm state
All of the OpsItems created from alarms have a source of CloudWatch Alarm. This allows you to organize and view them separately from other OpsItems. You can view summary counts for each Category in the AWS Systems Manager Explorer. You can see the newly created OpsItems alongside existing OpsItems from EC2. You can customize widget layout in explorer through the Actions drop-down.

Figure 4 – Open OpsItems grouped by Category
Clicking on the link beside CloudWatch displays the list of OpsItems that were created when the alarm went into alarm state. Select one of the OpsItems to view the details of the Alarm. There is a lot of information in the OpsItem and we will be focusing on the Related Resources and Runbooks areas. For more information on other aspects, consult the OpsItem documentation.
The OpsItem has the triggering alarm and the monitored resource related resources. This allows you to click on either resource to investigate why the EC2 is showing high CPU usage.
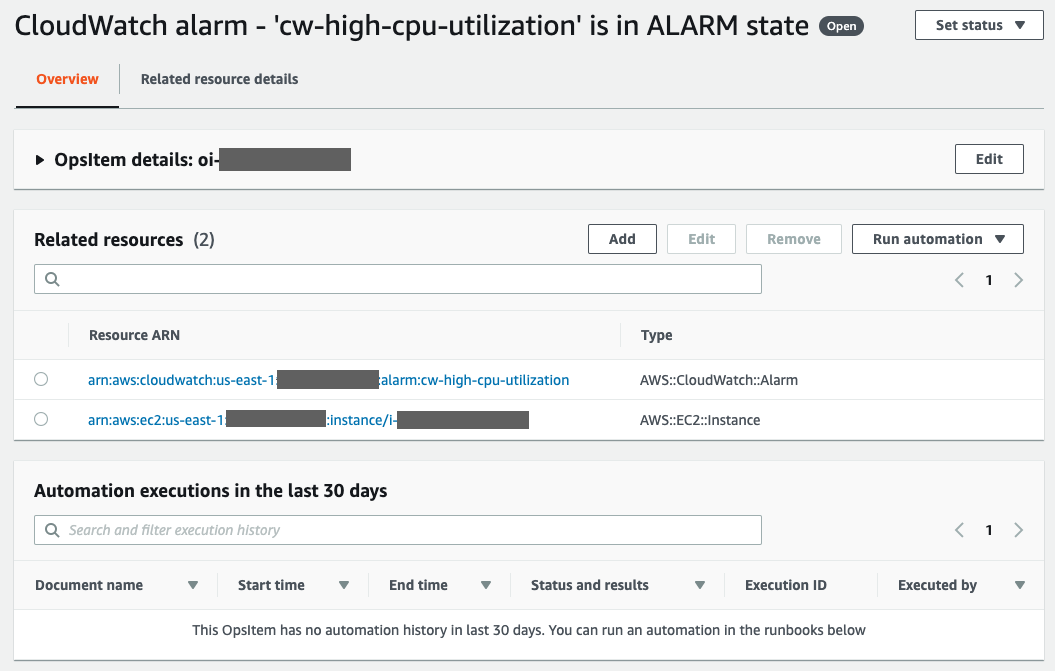
Figure 5 – OpsItem details and related resources
Viewing CloudWatch Alarm through the OpsItem
The OpsItem has included most of the information that is available from the CloudWatch Console and uses many familiar widgets. If you have a composite alarm, then all details of the child alarms will also be included, and if you are using advanced metric features such as anomaly detection of metric math that will also be displayed.
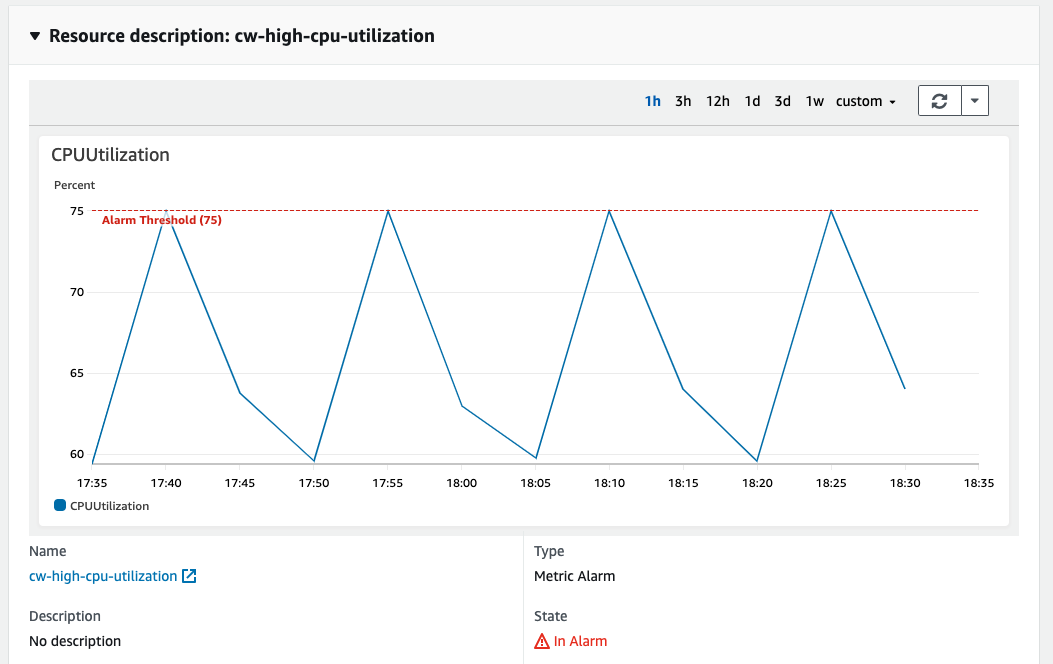
Figure 6 – Viewing CloudWatch Alarm metrics from the OpsItem
You can view the history of the alarm. This is helpful when the alarm is flopping and the dedupe process is combining frequent triggers.
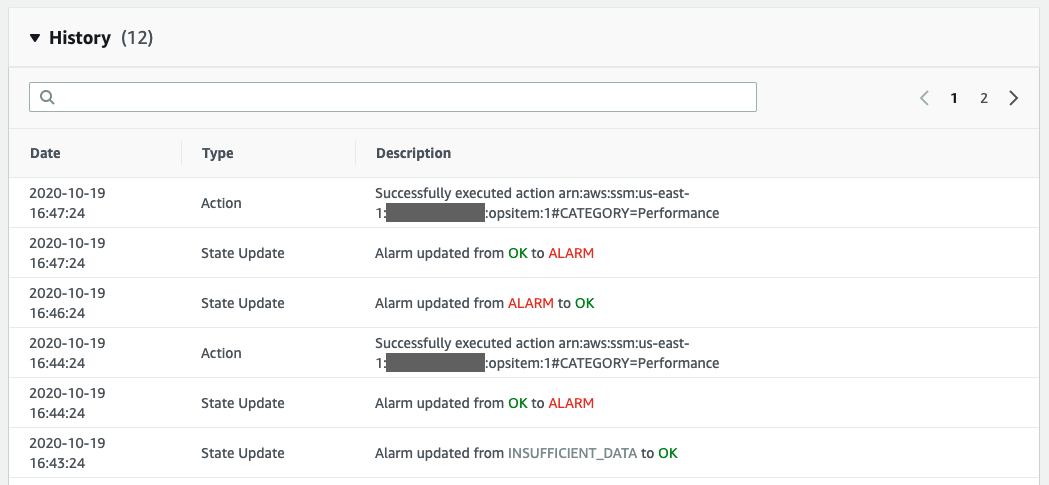
Figure 7 – CloudWatch Alarm History
Remediating the issue
By examining these details, we determine that the EC2 instance has been using a large amount of CPU and we want to vertically scale the instance. We change tabs back to the OpsItem details and can find a runbook for resizing the instance.
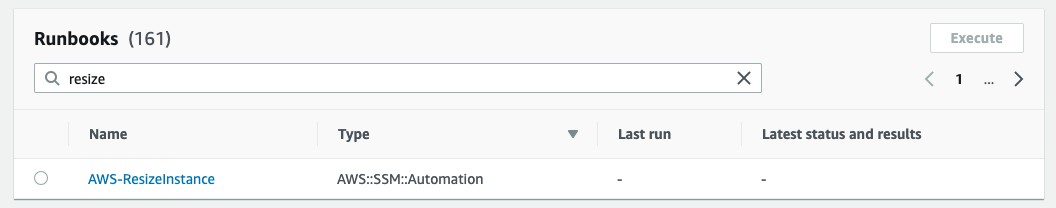
Figure 8 – Selecting a Runbook
Select AWS-ResizeInstance, select Execute, and then enter details for the automation.

Figure 9 – Specify the parameters for a Runbook
The runbook that is running will appear in the OpsItem and you can monitor its progress.
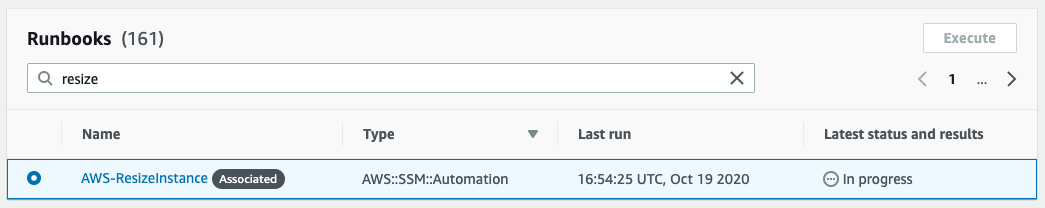
Figure 10 – Runbook automation status
With the runbook completing successfully, you can set the status of the OpsItem to Resolved. If you are interested in investigating other similar issues, you can view the Similar OpsItems section.
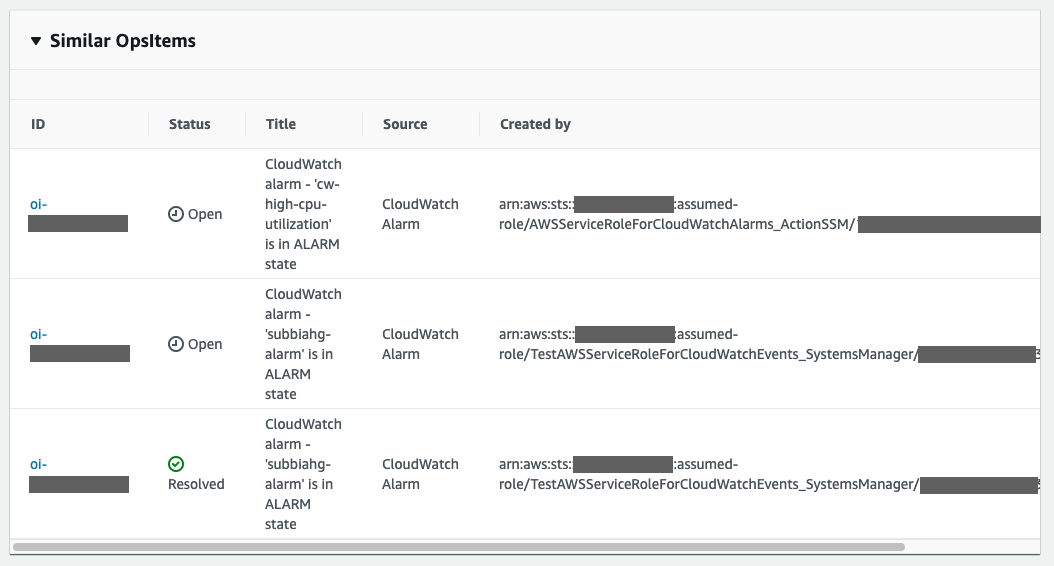
Figure 11 – Viewing Similar OpsItems
Next steps
With this blog post, you’ve seen how to create an OpsItem in OpsCenter when a CloudWatch alarm occurs. This allows you to view items for all your CloudWatch alarms in one central location through the AWS Systems Manager Explorer. From the Explorer, you can drill down on specific alarms to investigate and remediate the alarm. While I’ve focused on a single use-case for monitoring an EC2 instance for CPU performance, you can take these principles and extend this to any service or application that provides CloudWatch metrics.
About the author
 Michael Heyd is a Solutions Architect with Amazon Web Services and is based in Vancouver, Canada. Michael works with enterprise AWS customers to transform their business through innovative use of cloud technologies. Outside work he enjoys board games and biking.