AWS Cloud Operations Blog
Integrate Amazon CloudWatch alarms with Amazon CloudWatch Metrics Insights
Real time alarms are invaluable in proactively knowing when systems are not working as expected or take automated corrective action. Alarms gives you time to investigate and fix the problem before it can result in an outage. However, systems and metrics on which you want to apply the alarms are not always simple. An alarm is simple to configure when it is applied on single metric of a single resource such as CPU Utilization for an Amazon EC2 instance. There could also be scenarios when you need to have alarms beyond this simplicity for monitoring multiple resources at once without worrying about lifecycle of any resource.
Amazon CloudWatch Metrics Insights is a powerful high-performance SQL query engine to query metrics. In this blog post, we will demonstrate how to create alarms based on queries using the new Amazon CloudWatch alarm integration with CloudWatch Metrics Insights, which allows monitoring of multiple resources using a single alarm. It adds the alarming capability for scenarios which were not easy to configure previously.
About CloudWatch Metrics Insights
With CloudWatch Metrics Insights, you can easily query and analyze metrics to gain better visibility into the health and performance of infrastructure and large-scale applications.
While Metrics Insights comes with standard SQL language, you can also get started with Metrics Insights by using the visual query builder. Query builder helps you to build the query visually without knowing SQL. You can select metrics of interest, namespaces and dimensions visually, and the console automatically constructs SQL queries based on selections.
To get started with Metrics Insights, you can follow the documentation Query your metrics with Metrics Insights.
About CloudWatch alarms
Amazon CloudWatch alarms are used as a means to alert you or automate remediation actions when application and infrastructure metrics exceed static or dynamically set thresholds. CloudWatch alarms help you improve infrastructure monitoring efficiency by reducing the time to detect, triage, and diagnose issues that impact workload performance.
To get started with CloudWatch Alarms, you can follow the documentation Using Amazon CloudWatch alarms.
Common use case
Alarms created using Metrics Insights queries allow you to monitor multiple resources at once. Metrics Insight query automatically include new resource that matches its definition. For example you can monitor multiple auto-scaling groups with single alarm, without worrying about instances added or removed as part of scaling operations to any of the auto-scaling group. It removes the undifferentiated heavy lifting associated with creating and managing alarms per metric and per resource.
You can find some of the Metrics Insights sample queries samples and use cases for Metrics Insights alarm here .
Our solution
We will create the following resources
- 2 Auto Scaling groups
- CloudWatch alarm using Metrics Insights query
Launch EC2 instances
Alarms are created from metrics, so we must have some metrics to start with. In this blog, we are going to demonstrate CloudWatch alarm creation using a metrics insights query which can include multiple EC2 instances. We will deploy 2 Autoscaling groups for example but in a real scenario it could be hundreds of autoscaling groups or individual instances.
Create two auto-scaling groups using Create an Auto Scaling group using a launch template
Create CloudWatch alarm using Metrics Insights query
We will demonstrate 2 alarms using Metrics Insights query. The first alarm will trigger when average CPU utilization across all EC2 instances crosses 70%, and the second alarm will trigger when CPU Utilization of any of the individual instance crosses 80%
- Open CloudWatch in AWS Console. Click All Metrics under Metrics in CloudWatch left navigation
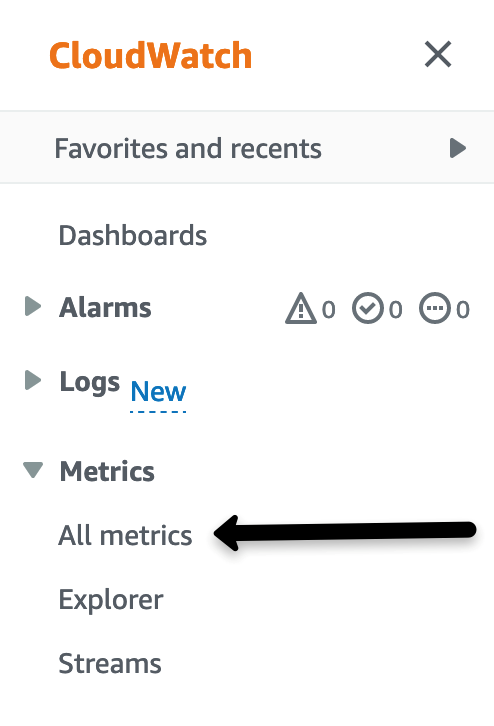
Figure 1. CloudWatch Console.
- Once you have selected All Metrics, select the Query Tab to display the Metrics Insights query builder
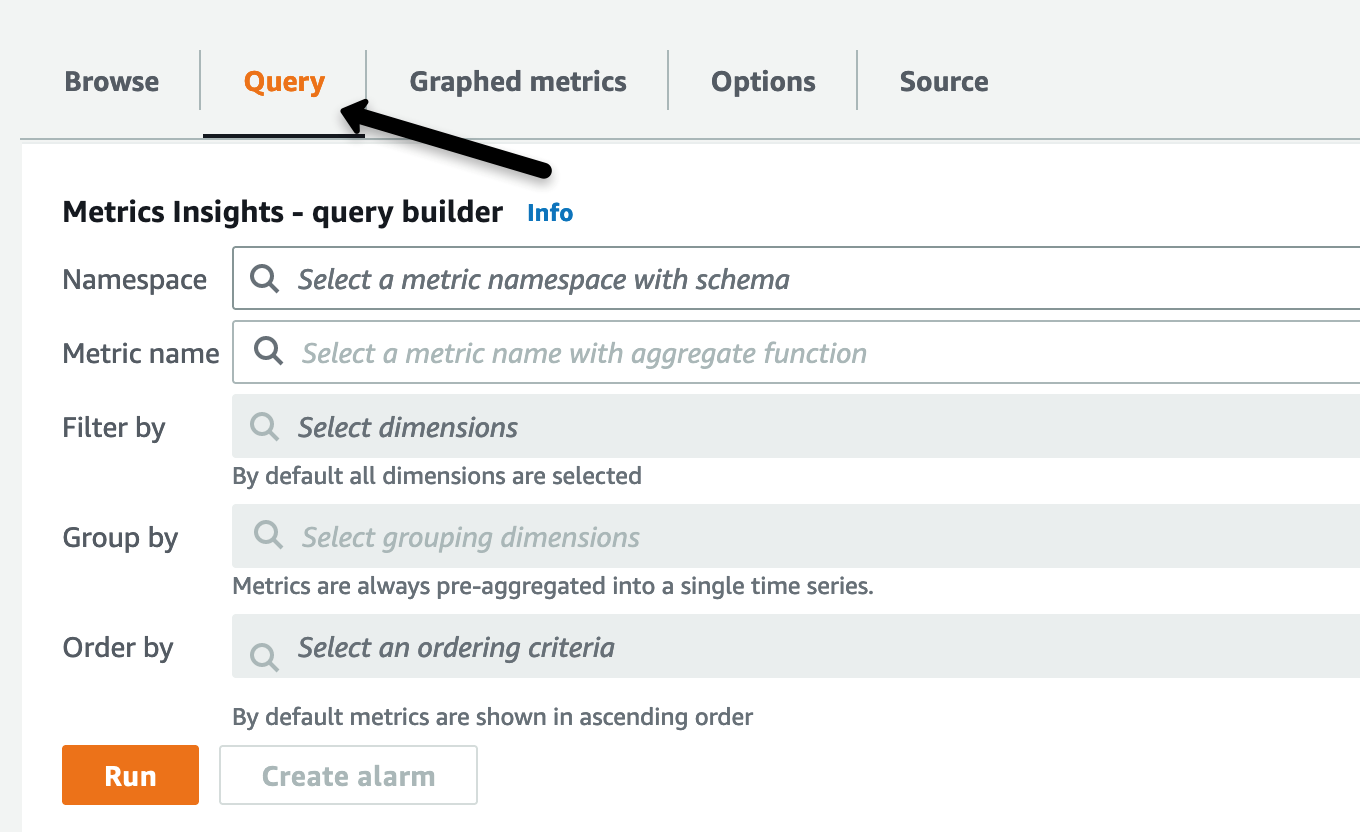
Figure 2. Metrics Insights query builder.
The figure 2 shows how when you select namespaces and dimensions visually, the console automatically constructs your SQL queries for you, based on your selections. You can use the query editor to type in your raw SQL queries anytime to dive deep and pinpoint issues with further granular detail.
- For the 1st alarm, specify Namespace as AWS/EC2, and select Per-Instance Metrics. Under Metric Name, select AVG function and choose CPUUtilization, and click on Run.
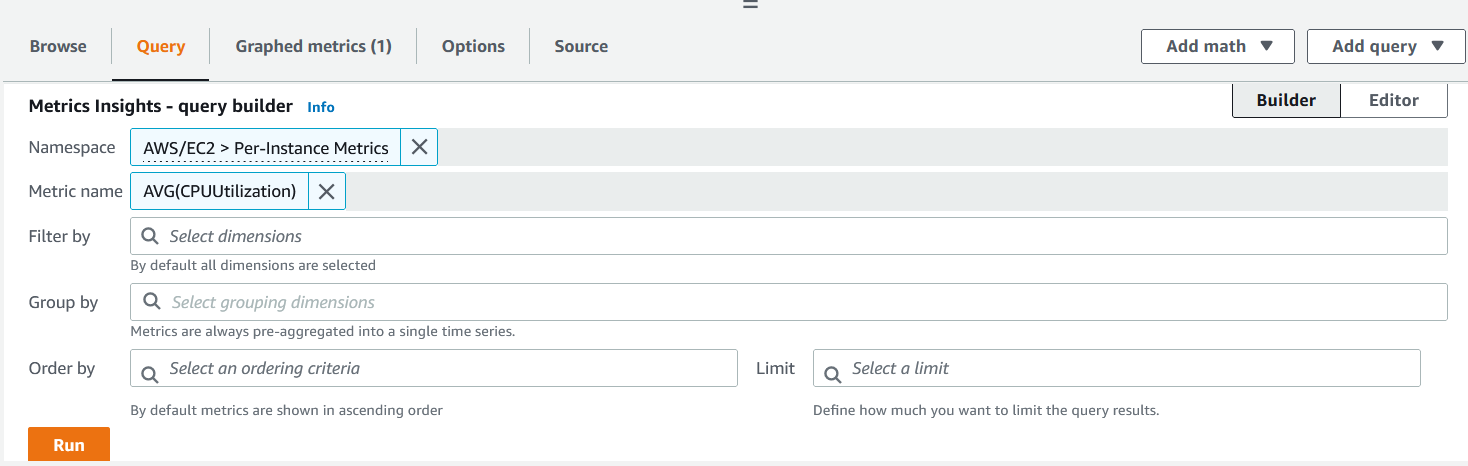
Figure 3. Running Metrics Insights query.
Apart from AVG, there are other functions such as SUM, COUNT, MIN and MAX available for aggregation of metrics.
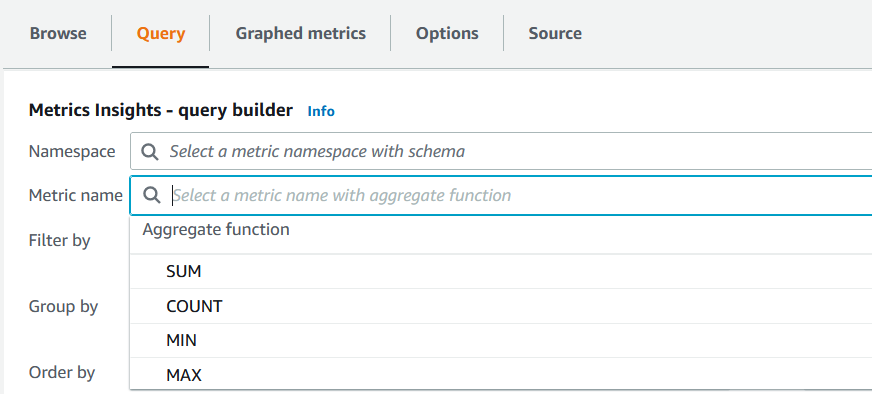
Figure 4. Aggregate function.
- Once you click on Run, you should be able to see the graph plotted for average CPU Utilization across all EC2 instances. Click on Graphed metrics.
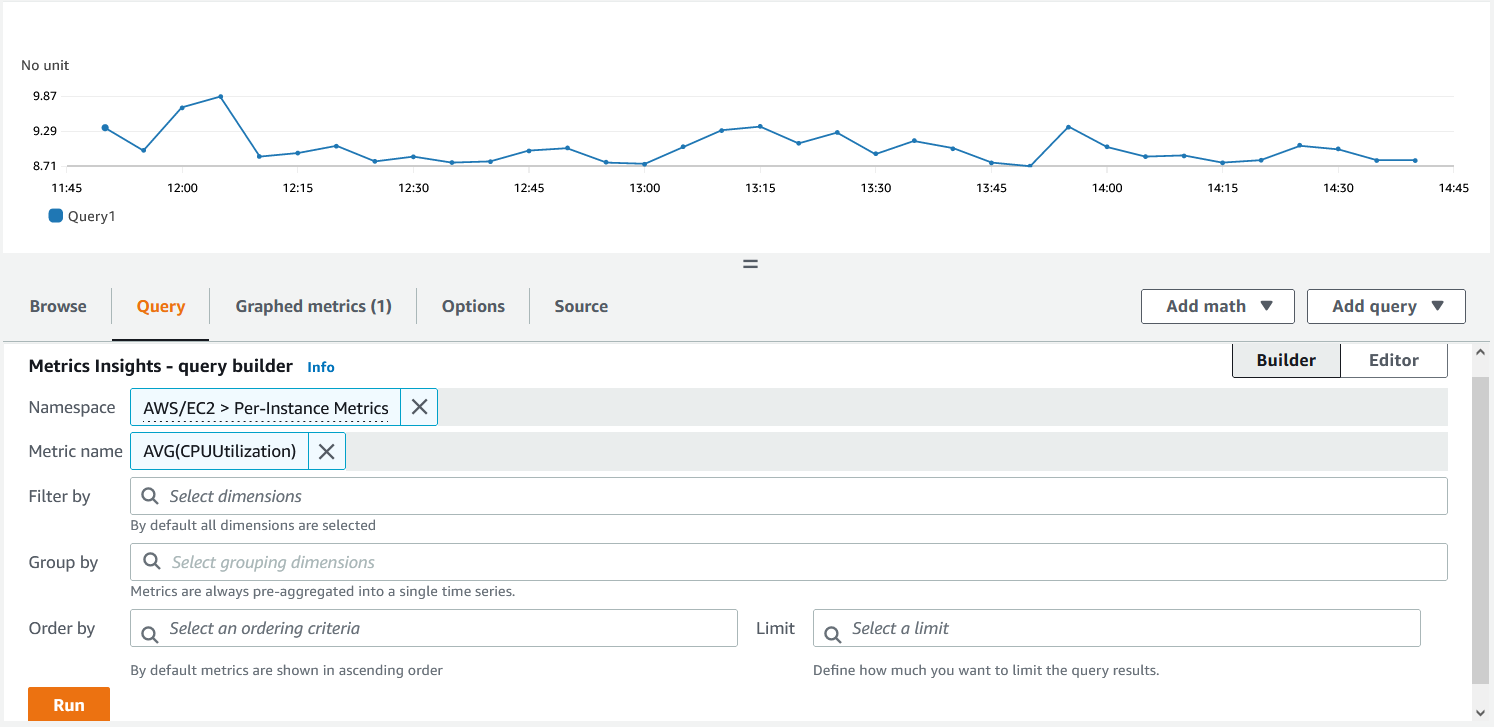
Figure 5. Plotting graph using Metrics Insights query.
- Under Graphed metrics, you can see the complete SQL query by clicking the yellow highlighted section under Details. Click on the alarm icon (highlighted in orange) under Actions to create an alarm
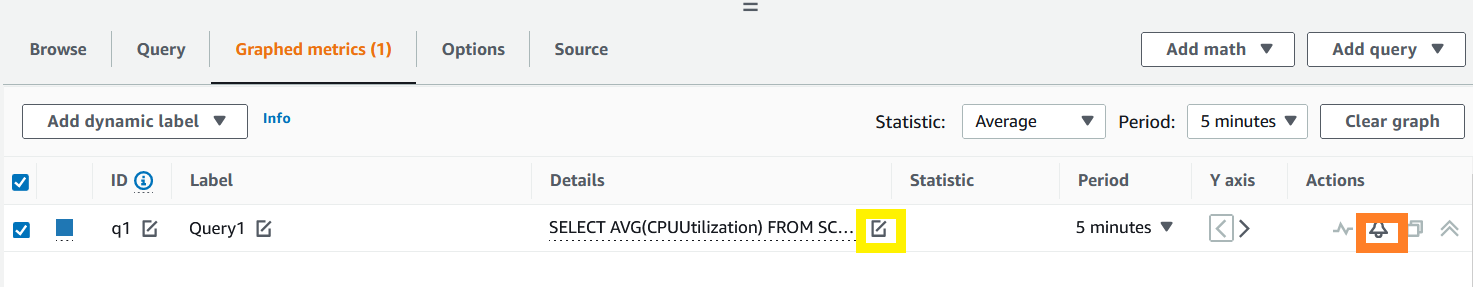
Figure 6. Graphed metrics.
- Next on the Create alarm page, you can configure Period for evaluation of metric and threshold value for the alarm. Once you set the threshold for the metric, a red line shows up on the page representing the threshold value.
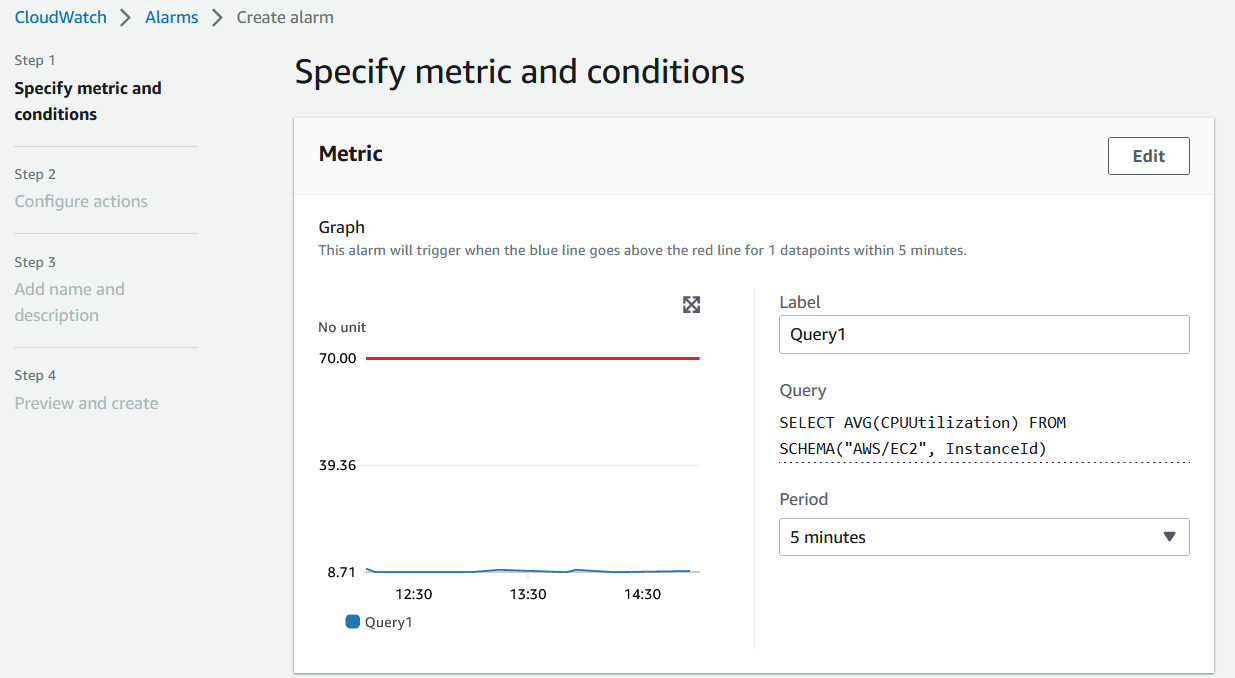
Figure 7. Create alarm.
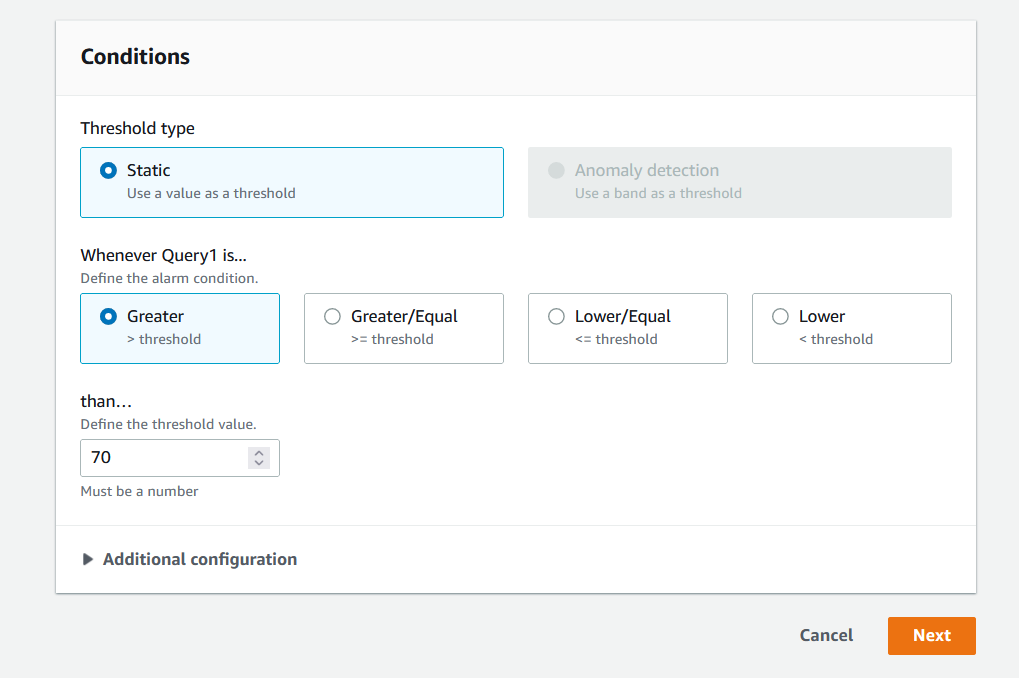
Figure 8. Specify conditions for alarm.
You can also click on Query and see the complete query. This is useful when the query is long and spanning across multiple lines.
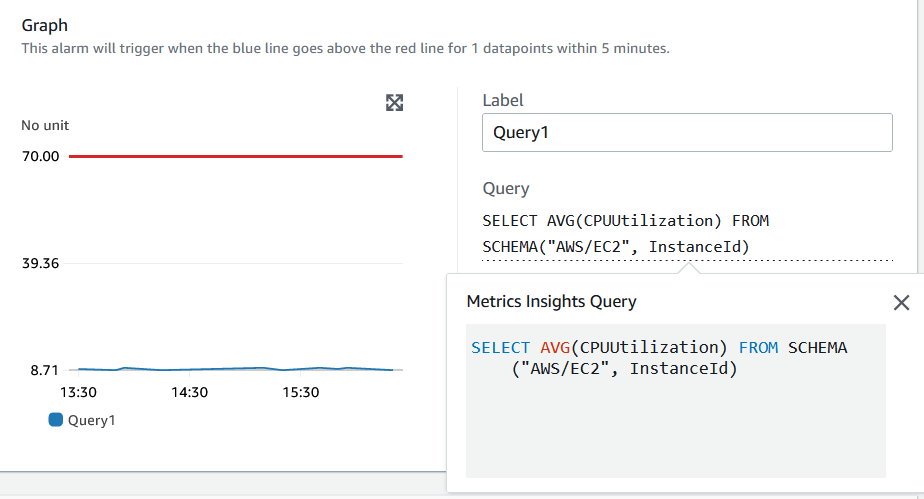
Figure 9. Complete query on create alarm page.
- On the Configure actions page , you can add the SNS topic for notification, and click Next
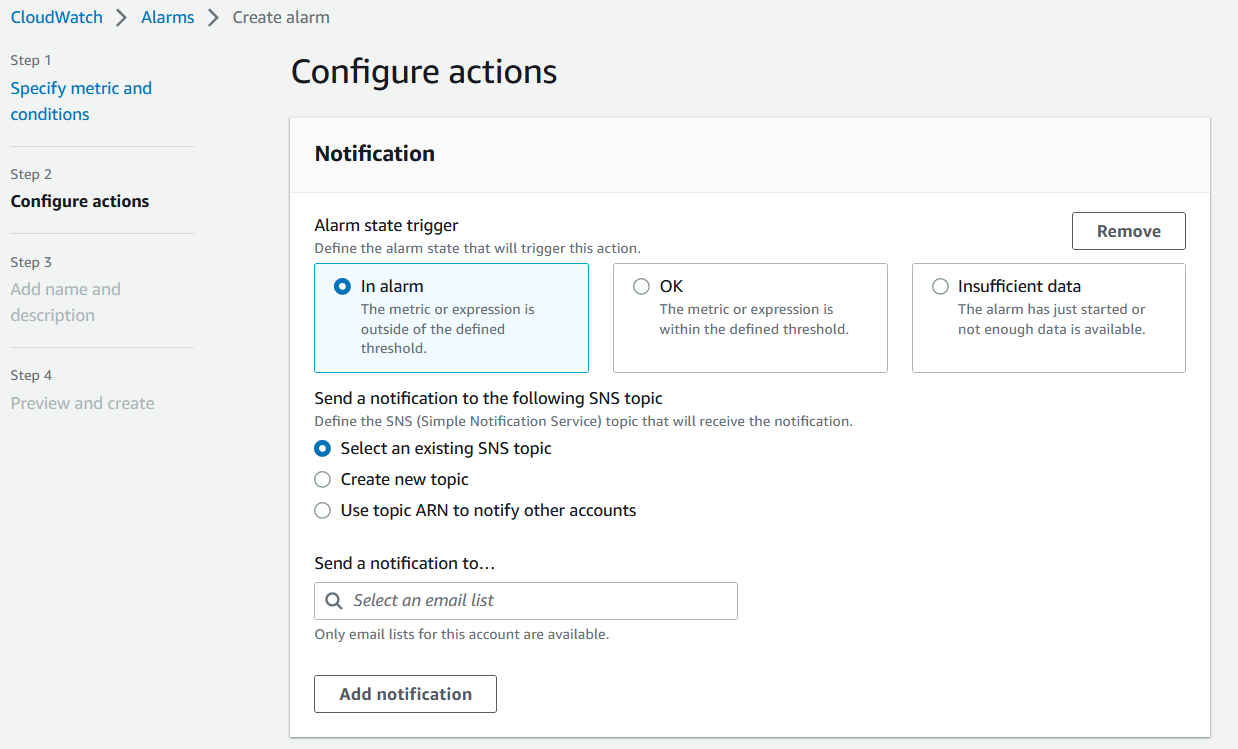
Figure 10. Configure actions for alarm.
- On the next page, you can add a meaningful name and description for the alarm.
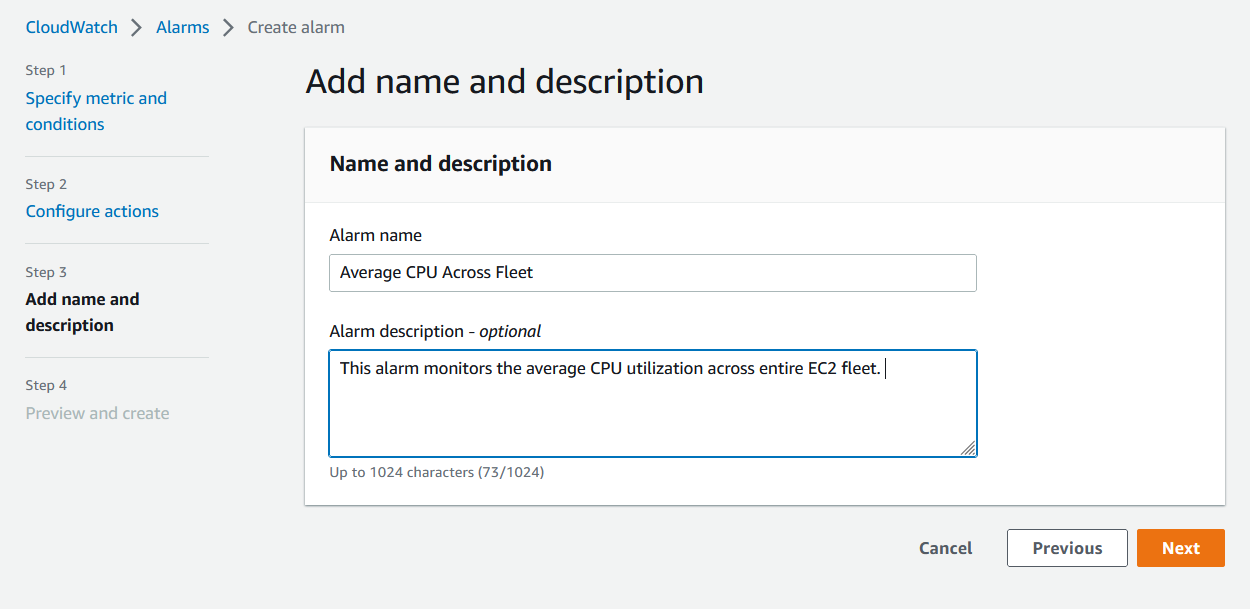
Figure 11. Provide Alarm Name and Description.
- Finally select Next to review the settings for alarm and click on Create alarm to complete the alarm creation.
- To create the second alarm for “CPU Utilization that crosses 80% for any” , you can change the query used in step 4 by adding Group by InstanceId and ORDER by MAX() function DESC (Descending). This query will return the time-series data for each instance, sorted in descending order by CPU usage.
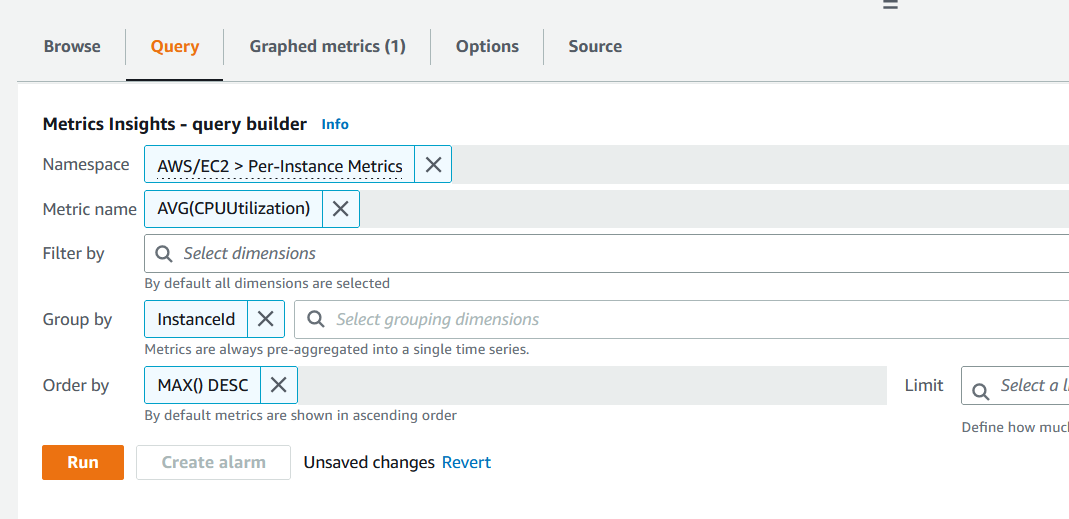
Figure 12. Running Group by query.
- Once you click on Run, you will notice that multiple time-series are returned, and an individual graph is plotted for every instances.
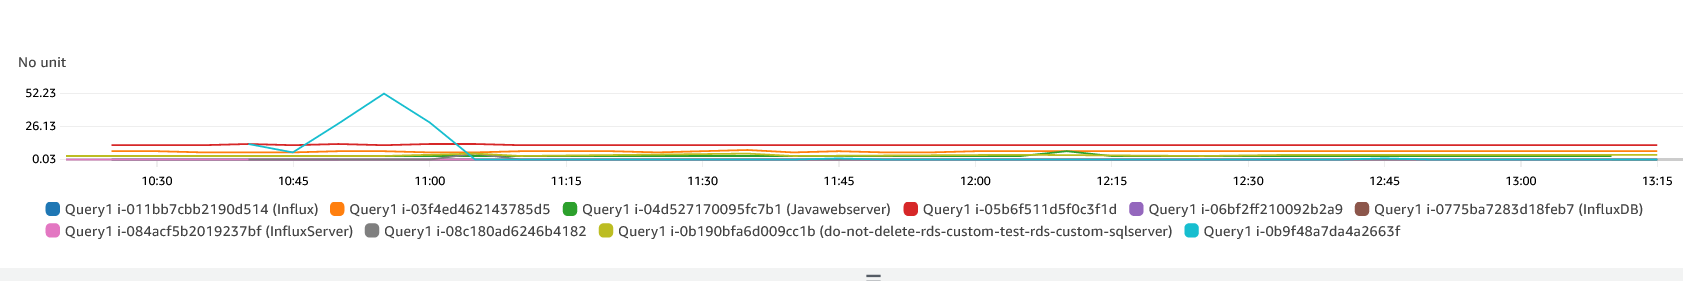
Figure 13. Multiple time series.
- Currently alarms are not supported with multiple time-series, so you need to use metric math functions to get the single time-series. Click on the Graphed metrics tab. In Graphed metrics, click on Add math (highlighted in orange) , All functions and select FIRST function (highlighted in yellow). This function will return the first time series among all the time-series data.
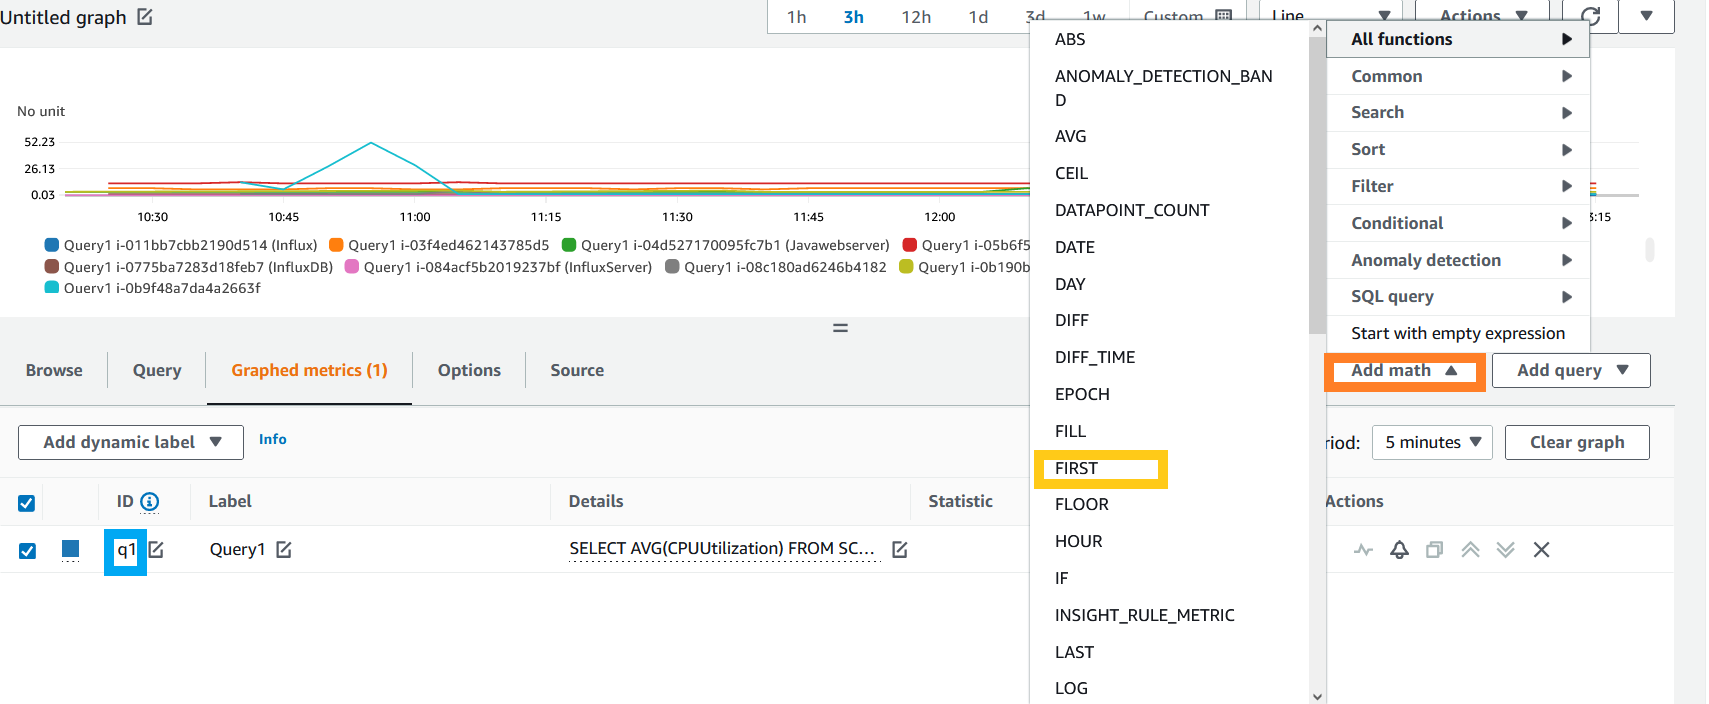
Figure 14. Adding metric math function.
Also note the label of our metric insight query q1 (highlighted in blue). We will use it metric math’s FIRST function.
- Update the Metric math function definition and click Apply.
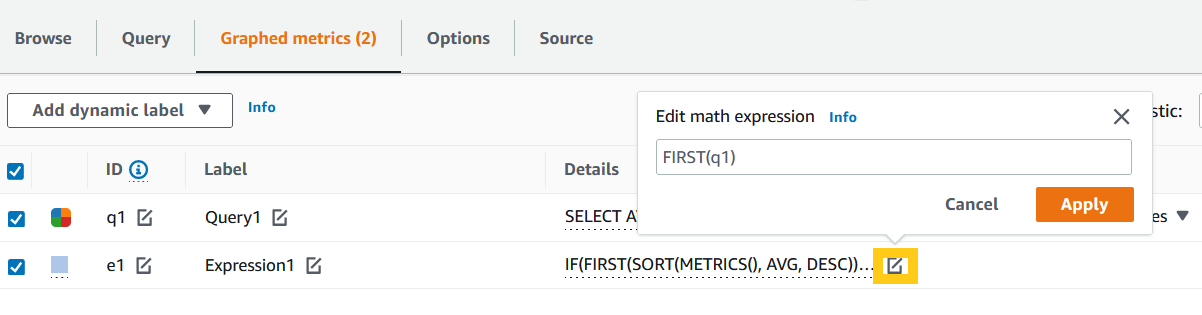
Figure 15. Metric math function to generate single time-series.
- Unselect the checkbox for Metrics Insight query and click on the alarm icon next to the Metric math function. This will take you to the Create alarm page where you can follow the same process as before to configure the alarm threshold, select SNS topic and then create the alarm.
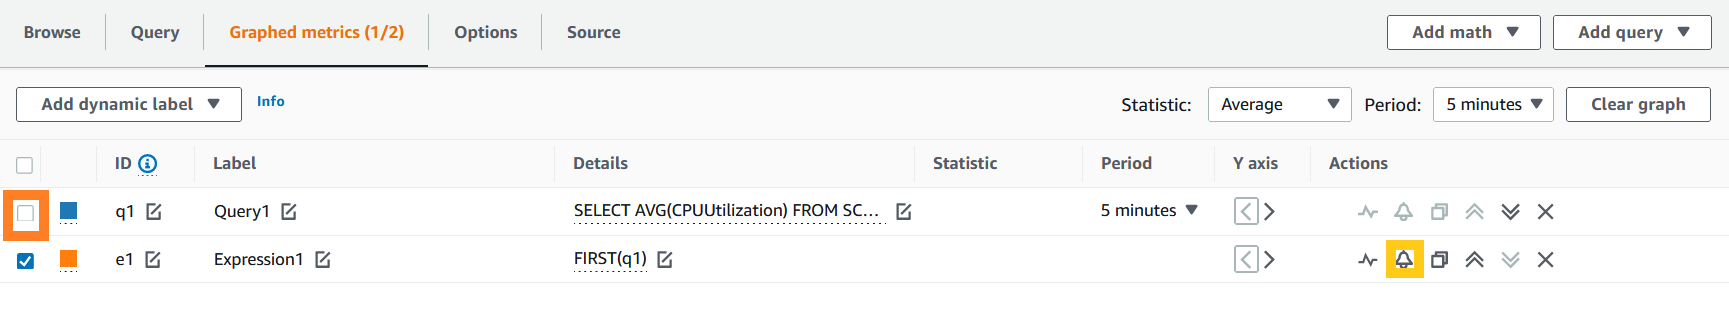
Figure 16. Creating alarm using metric math.
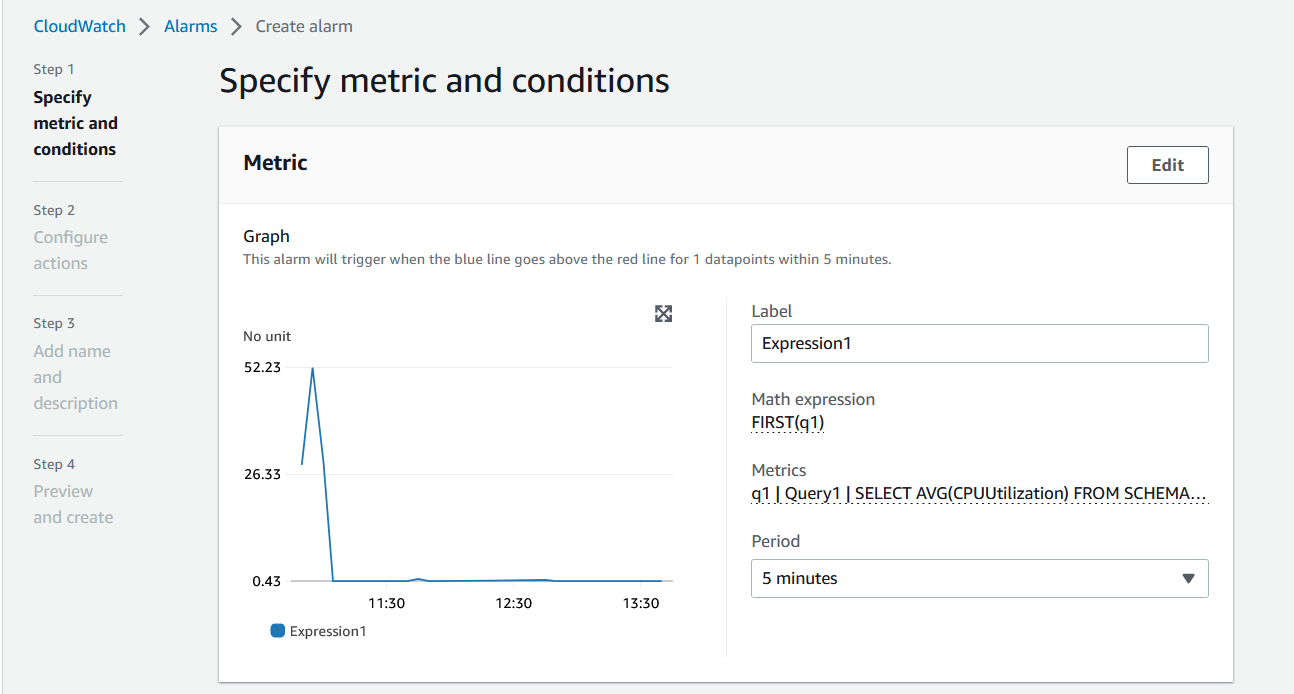
Figure 17. Specify conditions for alarm.
Now you have created the alarm using the Metrics Insights query, it will automatically include the metrics for any new EC2 instances deployed individually or even as a part of an auto-scaling group.
Now that you have your alarms in place, you can generate load for your instances and see these alarms in action.
What to do after the alarm
In case the average CPU utilization across the fleet is breaching threshold, you can investigate if there is/are any specific instance/instances causing it. You can use Metrics Insights to get this information.
In case the CPU Utilization of a single instance is breaching the threshold, you can use Metrics Insights to identify the instance Id and troubleshoot it further. The step for identifying the instance Id can also be automated using AWS Lambda.
Pricing
Standard Amazon CloudWatch pricing will apply to the alarms created using Metrics Insights.
Cleanup
To avoid charges in your account, delete the resources that you created.
- Delete the CloudWatch alarm: see the documentation for Editing or deleting a CloudWatch alarm
- Delete Auto-scaling groups: see the documentation for Delete your Auto Scaling Infrastructure
Conclusion
This post demonstrated how you can utilize Metrics Insights query to create a dynamic alarm that can monitor multiple resources at once, without a per resource configuration.
About the authors: