AWS Cloud Operations Blog
Learning about AWS service health with the new AWS Health Dashboard
Over the past 14 years, AWS has introduced a number of tools to provide constant visibility into the availability of your AWS services. On April 17, 2008, Jeff Barr announced the AWS Service Health Dashboard (SHD), a page that shows the overall availability of AWS services. On December 1, 2016, as customers asked for a more personalized and granular view, we introduced the AWS Personal Health Dashboard (PHD) and the AWS Health API. In recent years, we’ve focused on improving the responsiveness of the PHD through automated notifications and refined internal processes. We’ve also added integrations with Amazon EventBridge and AWS Organizations so you can access your personalized events more easily in the context of your operations. Throughout these enhancements to the PHD, the SHD has remained largely unchanged – apart from stretching to cover an additional 200 services and 24 regions since launch. As AWS itself has grown to millions of customers and a far greater number of resources across the world, it’s increasingly difficult for the SHD to represent the experience of individual customers with a single aggregated status icon.
Now, we’re excited to announce that we’ve updated the SHD so it’s more responsive, efficient to use, and tightly connected to the PHD. Both of these properties are now unified into a single experience simply called the AWS Health Dashboard. This new page provides an easier to use interface, faster page load times, and a backend that’s even more operationally resilient. You also get streamlined access to your personalized events, as the AWS Health Dashboard automatically takes you to your account events if you’re already signed in. Additionally, the AWS Health Dashboard provides a more responsive and accurate communication if multiple AWS services are affected by an event. We’ll walk through these enhancements and changes in this blog post. This iteration is the first in a series of changes throughout 2022 that will continue to enhance your visibility into service and resource health.
If you pay a visit to the AWS Health Dashboard, one of the first things you may notice is the improved interface. The page is faster and easier to use – we’ve optimized the load times by over 65% and the total size of the page has been reduced. You can now quickly search for services and regions in the history table. Access from a mobile device is improved. Plus, the page now features automatic in-line refresh.
When there aren’t any AWS operational issues, you’ll see a single check mark representing all AWS services. If there is an issue, the page defaults to the ‘Open and recent issues’ tab so you can read about it.
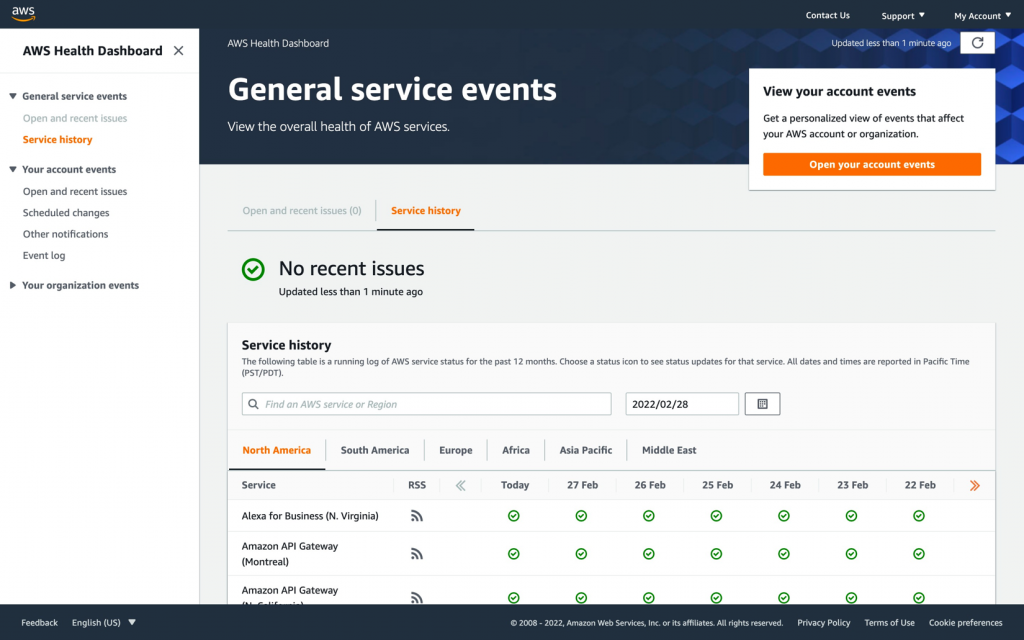
As we previously mentioned, the SHD and PHD have been unified into a single destination now called the AWS Health Dashboard. This change is designed to make it easier for you to access all communications about your AWS services and resources in a single location. If you visit the AWS Health Dashboard and you’re not signed in, you get taken to the general service events view. This is an aggregated view representing the overall status of every AWS service. To see more information about your specific account, you can sign in.
When you visit the AWS Health Dashboard and you’re already signed in to your AWS account, you get taken automatically to your account events. Here, you can receive communications when just your resources alone are affected by an event. You also get notified about every event posted on the general service events page, making your account events a superset of operational communications. It is a major focus of numerous AWS initiatives to provide you with personalized visibility into your own operational health, at a far greater granularity than the overall service status. We therefore recommend that you sign in to the AWS Health Dashboard.
As a final aspect of this release, AWS provides a more responsive view in the scenario when multiple AWS services are affected by a common underlying root cause. These moments can be some of the most challenging for operations teams to navigate, because of the amount of signal and need for up-to-date information. If you visit the AWS Health Dashboard, you will now see one overarching communication with impacted services tagged to the event. This accelerates AWS’ ability to denote a service as impacted, helping you inform your incident management process faster. You can also quickly understand which impacted services are related to a single incident.
Any previous links and URLs to SHD and PHD will automatically redirect to the new AWS Health Dashboard, ensuring your existing bookmarks will continue to work. If you’ve subscribed to the RSS feeds in the SHD, these will continue to work as expected, as well.
If you use the AWS Health API (maybe you’ve set up notifications with AWS Health Aware) or EventBridge to receive Health events, you won’t need to change your integration. When multiple services are tagged to one underlying event, you’ll see these service listed in the EventDetails section.
Providing visibility into service health is a top priority for AWS. We’ll continue to inform you about upcoming enhancements here on the blog.