AWS Cloud Operations Blog
Monitor python apps with Amazon CloudWatch Application Signals
AWS announced Amazon CloudWatch Application Signals during re:Invent 2023. It is a new feature to monitor and understand the health of Java applications. Today we are excited to announce that Application Signals now supports Python applications. Enabling Application Signals allows you to use AWS Distro for OpenTelemetry (ADOT) to instrument Python applications without code changes. This lets you collect key metrics and traces for libraries and frameworks developed using Python. This allows you to quickly triage operational health and monitor performance goals, without writing custom code or creating dashboards.
In this blog post, we’ll provide a detailed walkthrough on how to seamlessly integrate Application Signals with Python applications deployed on an Amazon EKS cluster. Specifically, we’ll focus on using this integration to monitor Python applications developed using the Django framework and utilizing popular libraries such as psycopg2, boto3 and requests. We will then visualize the application operational health using the Application Signals console.
Solution Overview
Here’s a detailed technical overview of the solution:
- The demo application is built on Spring Cloud and Django framework, where each service registers itself with the Eureka discovery-service. The application code can found on this GitHub repository.
- We have two services namely
insurancesandbillingwhich are written in the Django framework. They are exposing APIs via Django REST frameworks and calling external services using the requests library. - The services are also interacting with Amazon RDS for PostgreSQL using psycopg2 and storing billing information in AWS DynamoDB using boto3 library.
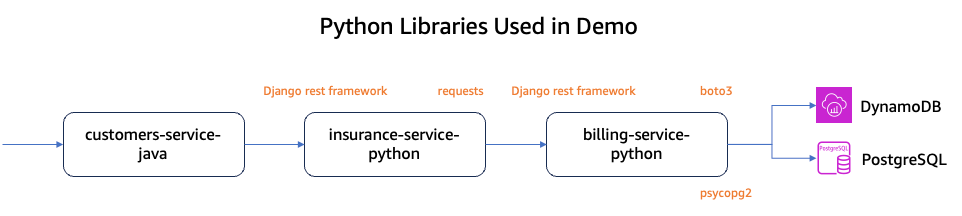
Figure 1: Python Libraries and Framework used in demo application
We will use Terraform to deploy the resources as shown in Figure 2. We will use the Amazon CloudWatch Observability EKS add-on to deploy both the CloudWatch agent and Fluent Bit as DaemonSet for orchestrating metrics, logs, and traces.
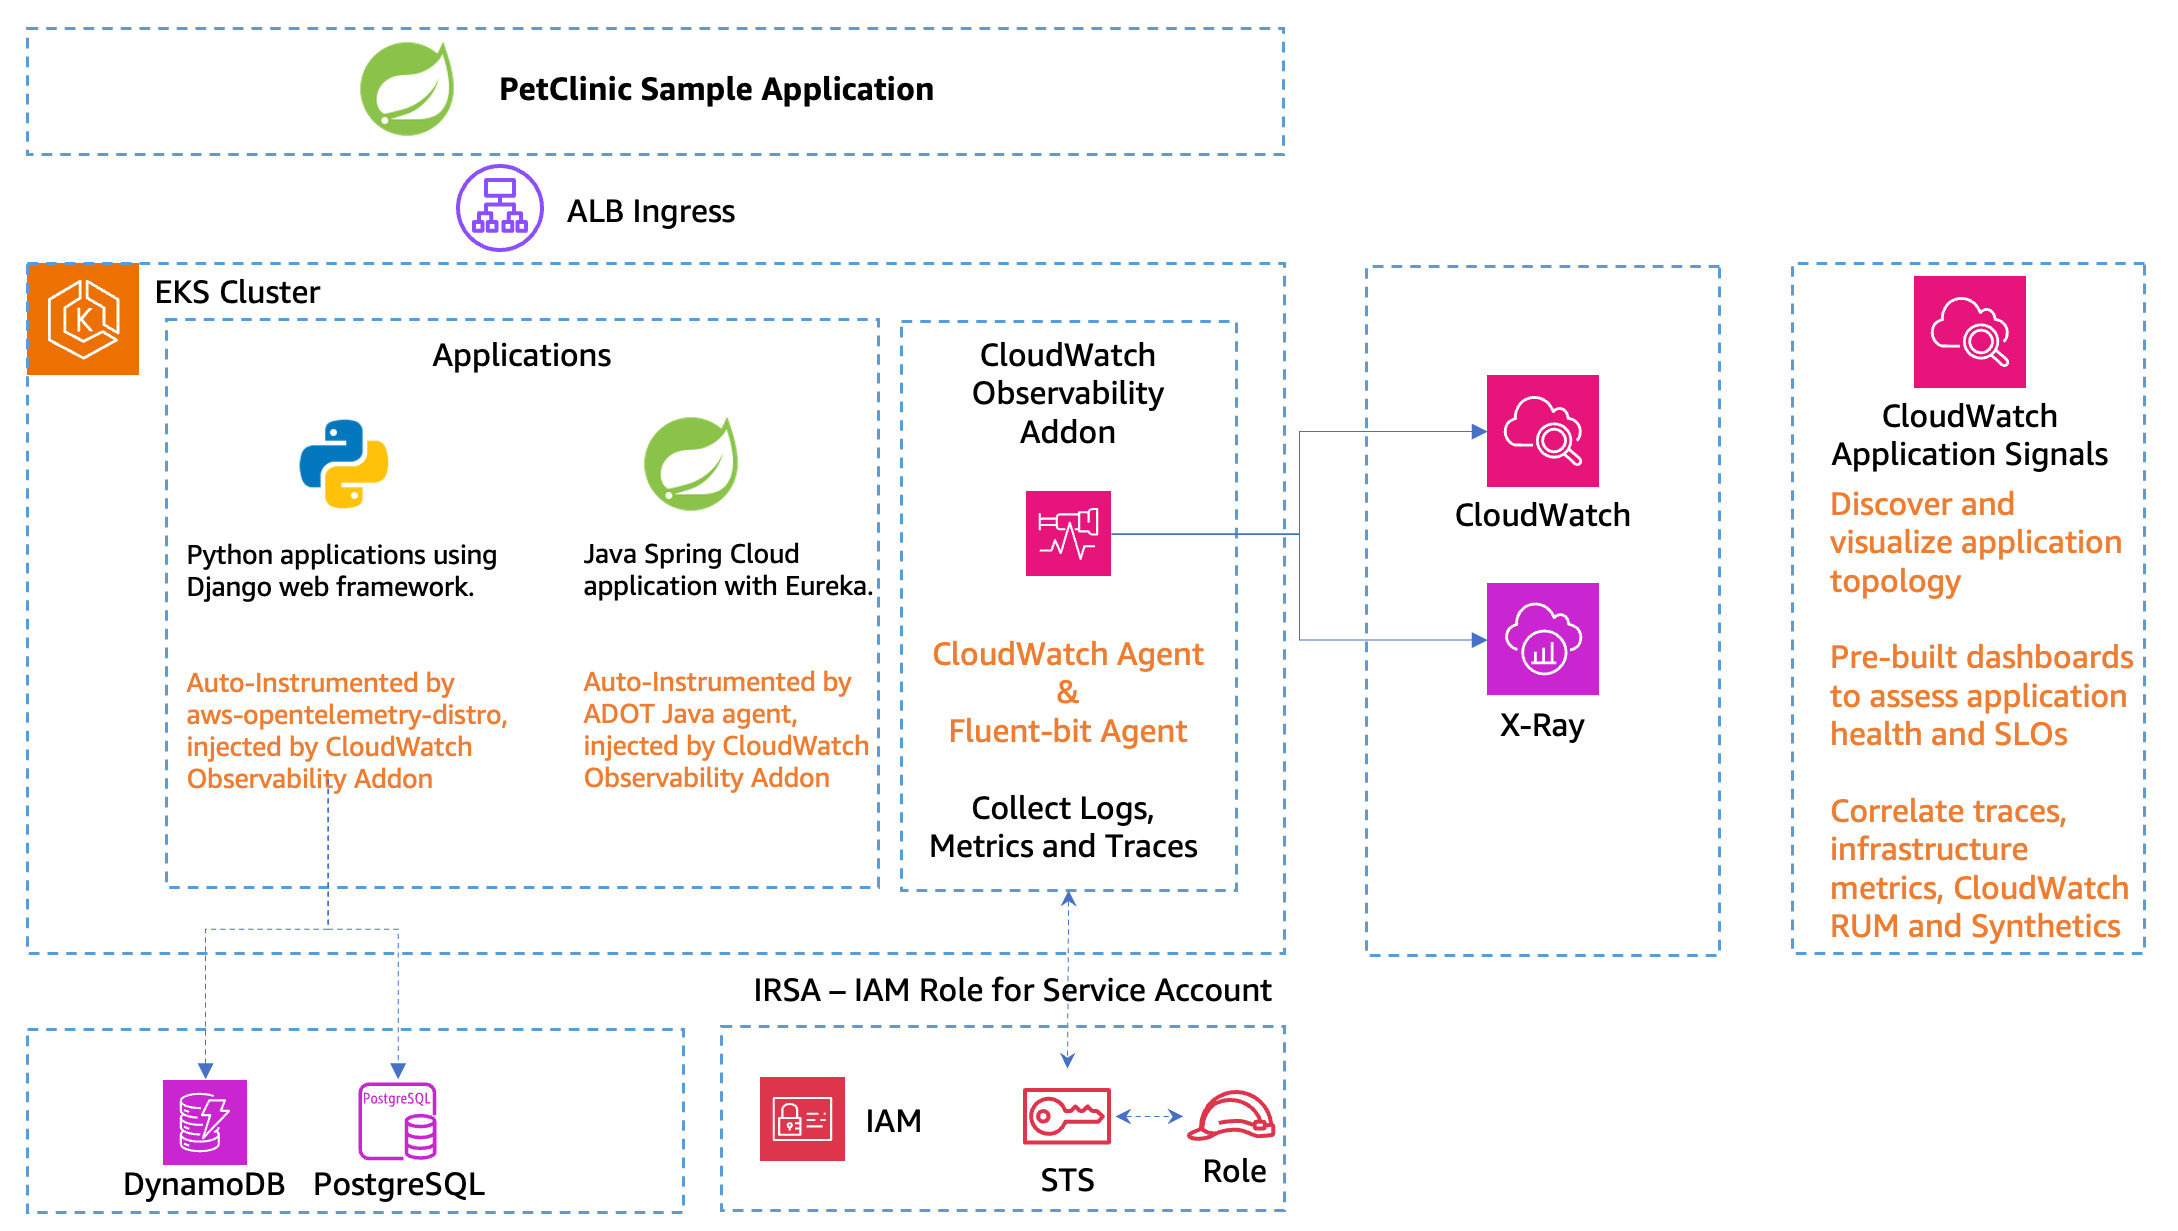
Figure 2: Solution Architecture
Prerequisites
Solution Walkthrough
Enable Application Signals
Follow the instructions to Enable Application Signals in your account.
Deploying Application using Terraform
- We’ll configure the environment variables required to deploy the application using Terraform and setup Amazon S3 bucket as backend by running the below commands.
export AWS_REGION=<your-aws-region> aws s3 mb s3://tfstate-$(uuidgen | tr A-Z a-z) export TFSTATE_KEY=application-signals/demo-applications export TFSTATE_BUCKET=$(aws s3 ls --output text | awk '{print $3}' | grep tfstate-) export TFSTATE_REGION=$AWS_REGION export TF_VAR_cluster_name=app-signals-demo export TF_VAR_cloudwatch_observability_addon_version=v1.5.1-eksbuild.1 - Next we will clone the application repository and deploy infrastructure using Terraform. It takes 15-20 minutes to provision the resources successfully.
git clone https://github.com/aws-observability/application-signals-demo
cd application-signals-demo/terraform/eks

terraform init -backend-config="bucket=${TFSTATE_BUCKET}" -backend-config="key=${TFSTATE_KEY}" -backend-config="region=${TFSTATE_REGION}"
terraform apply --auto-approve
Configure kubectl
Run the following command to update the kubeconfig file to add the Amazon EKS Cluster endpoint locally.
Deploy Kubernetes Resources with Annotations
- In order to enable Application Signals for python applications, you need to add an annotation
instrumentation.opentelemetry.io/inject-python: 'true'to a manifest YAML in the cluster. Adding this annotation auto-instruments the application to send metrics, traces, and logs to Application Signals.
spec: replicas: 1 selector: matchLabels: io.kompose.service: billing-service-python template: metadata: labels: io.kompose.service: billing-service-python annotations: instrumentation.opentelemetry.io/inject-python: 'true' - The deployment YAML files under
/demo-app/k8s/contain the required annotations. Deploy all resources by running the commands below. It will first compile the application, push the docker image to remote ECR docker repository and deploy to EKS cluster.cd ../.. ./mvnw clean install -P buildDocker export ACCOUNT=`aws sts get-caller-identity | jq .Account -r` export REGION=$AWS_REGION ./push-ecr.sh ./scripts/eks/appsignals/tf-deploy-k8s-res.sh
Verify Deployment Results
- Run the command below to confirm the successful deployment of application resources. You will see a list of pods with a Running status.
kubectl get pods #Output NAME READY STATUS RESTARTS AGE admin-server-java-5c57ddcb46-t4b9l 1/1 Running 0 7m1s billing-service-python-6bf9766cfc-5g67s 1/1 Running 0 6m52s config-server-58d94894-dzdhz 1/1 Running 0 6m47s customers-service-java-69c5d75cc9-5hwrw 1/1 Running 0 6m42s customers-service-java-69c5d75cc9-tfrts 1/1 Running 0 6m43s discovery-server-d6bff754f-xgrxv 1/1 Running 0 6m36s insurance-service-python-6745799b9b-4hdxc 1/1 Running 0 6m33s pet-clinic-frontend-java-5696d89cd8-cpvj2 1/1 Running 0 6m56s pet-clinic-frontend-java-5696d89cd8-mlggq 1/1 Running 0 6m56s vets-service-java-5b6969b8d6-cfvsb 1/1 Running 0 6m29s visits-service-java-85b9c5c45-p57m5 1/1 Running 0 6m25s visits-service-java-85b9c5c45-vwkht 1/1 Running 0 6m25s visits-service-java-85b9c5c45-vx6gj 1/1 Running 0 6m25s - Next run the below command to fetch the application URL. Open the URL in your web browser to explore the application. It may take 2-3 minutes to get the URL working.
echo "http://$(kubectl get ingress -o json --output jsonpath='{.items[0].status.loadBalancer.ingress[0].hostname}')"
Create CloudWatch Synthetics canaries to generate traffic
Next we will create canaries by running the below script which will run for 10 minutes to generate some traffic for the application.
Visualizing application using CloudWatch Application Signals
Navigate to the CloudWatch console and choose Services under the Application Signals section in the left navigation pane.
Services Dashboard
CloudWatch Application Signals automatically discovers and populates a list of services without requiring any additional setup under the Services dashboard out of the box. This unified, application-centric view helps provide a full perspective of how users are interacting with your service. This can help you triage issues if performance anomalies occur.
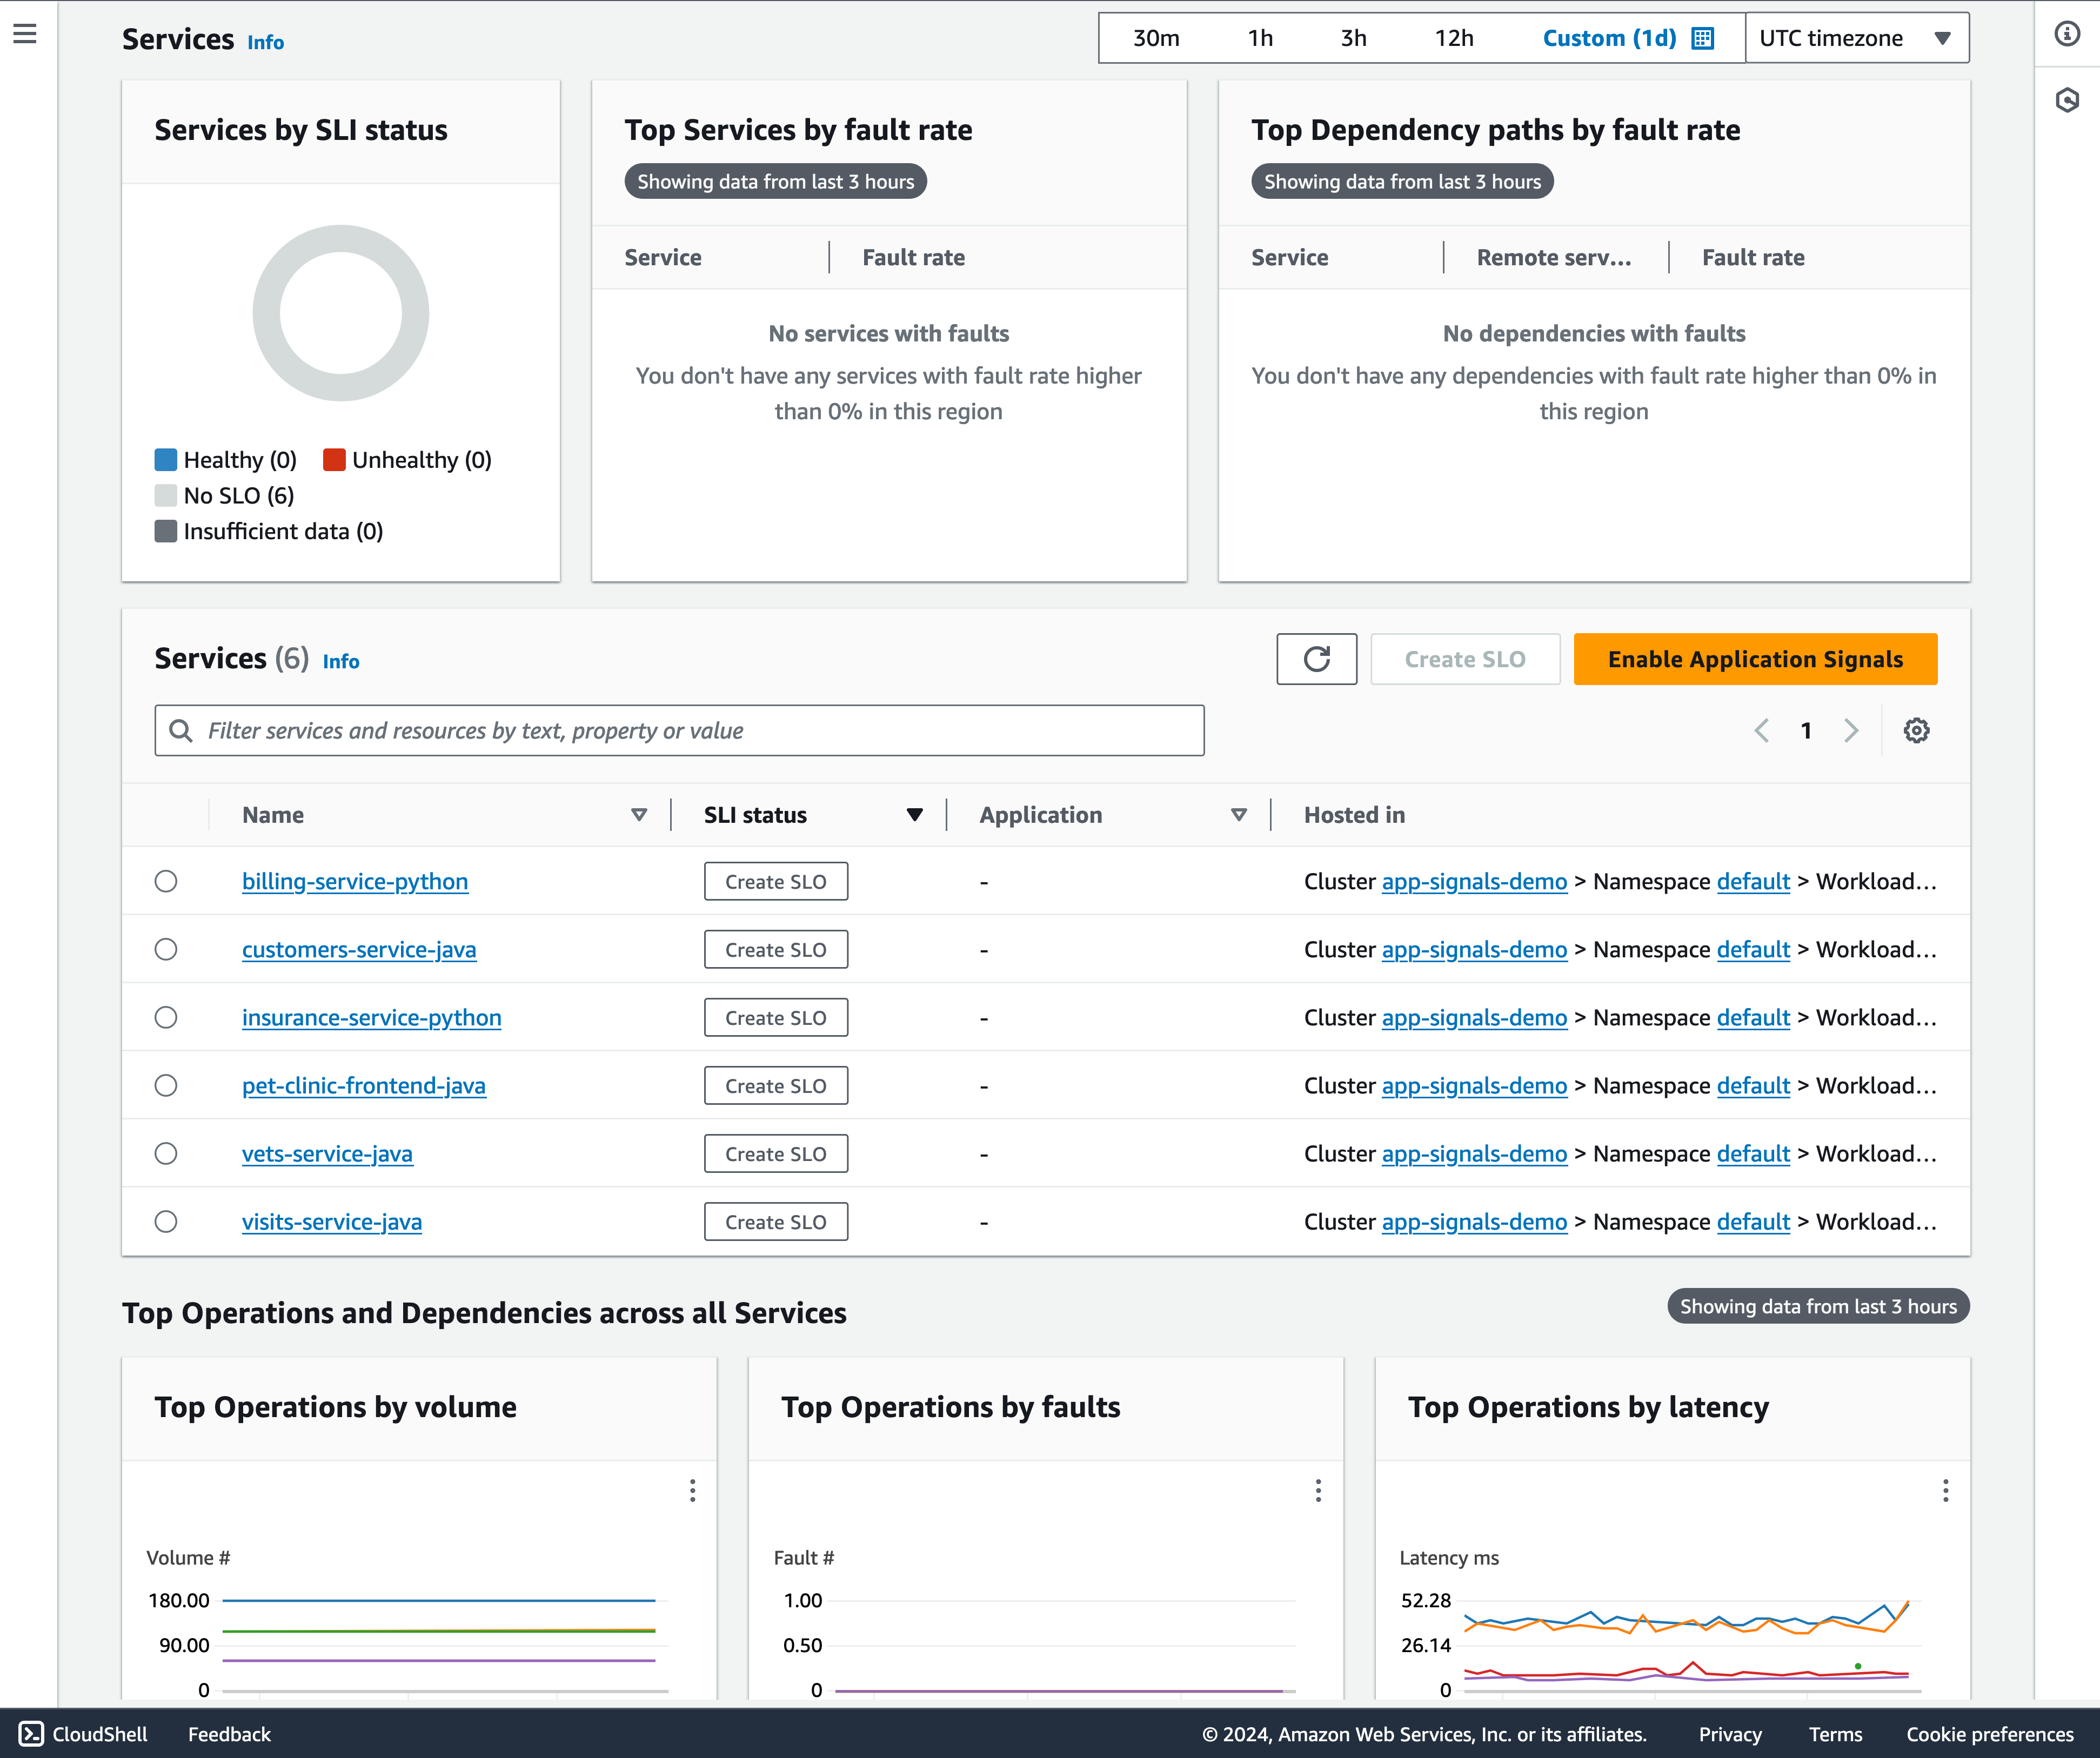
Figure 3: Services Dashboard
Detailed Service Information and Dependencies
The Service detail page displays an overview of your services, operations, dependencies, canaries, and client requests for a single service that has been enabled for Application Signals. To view this page, open the CloudWatch console, choose Services under the Application Signals section in the left navigation pane, and choose the name of any service from the Services table or the Top services or dependency tables.
As shown in Figure 4, Service Overview section summarizes the components that make up your service, and highlights key performance metrics to help you identify issues that require troubleshooting.
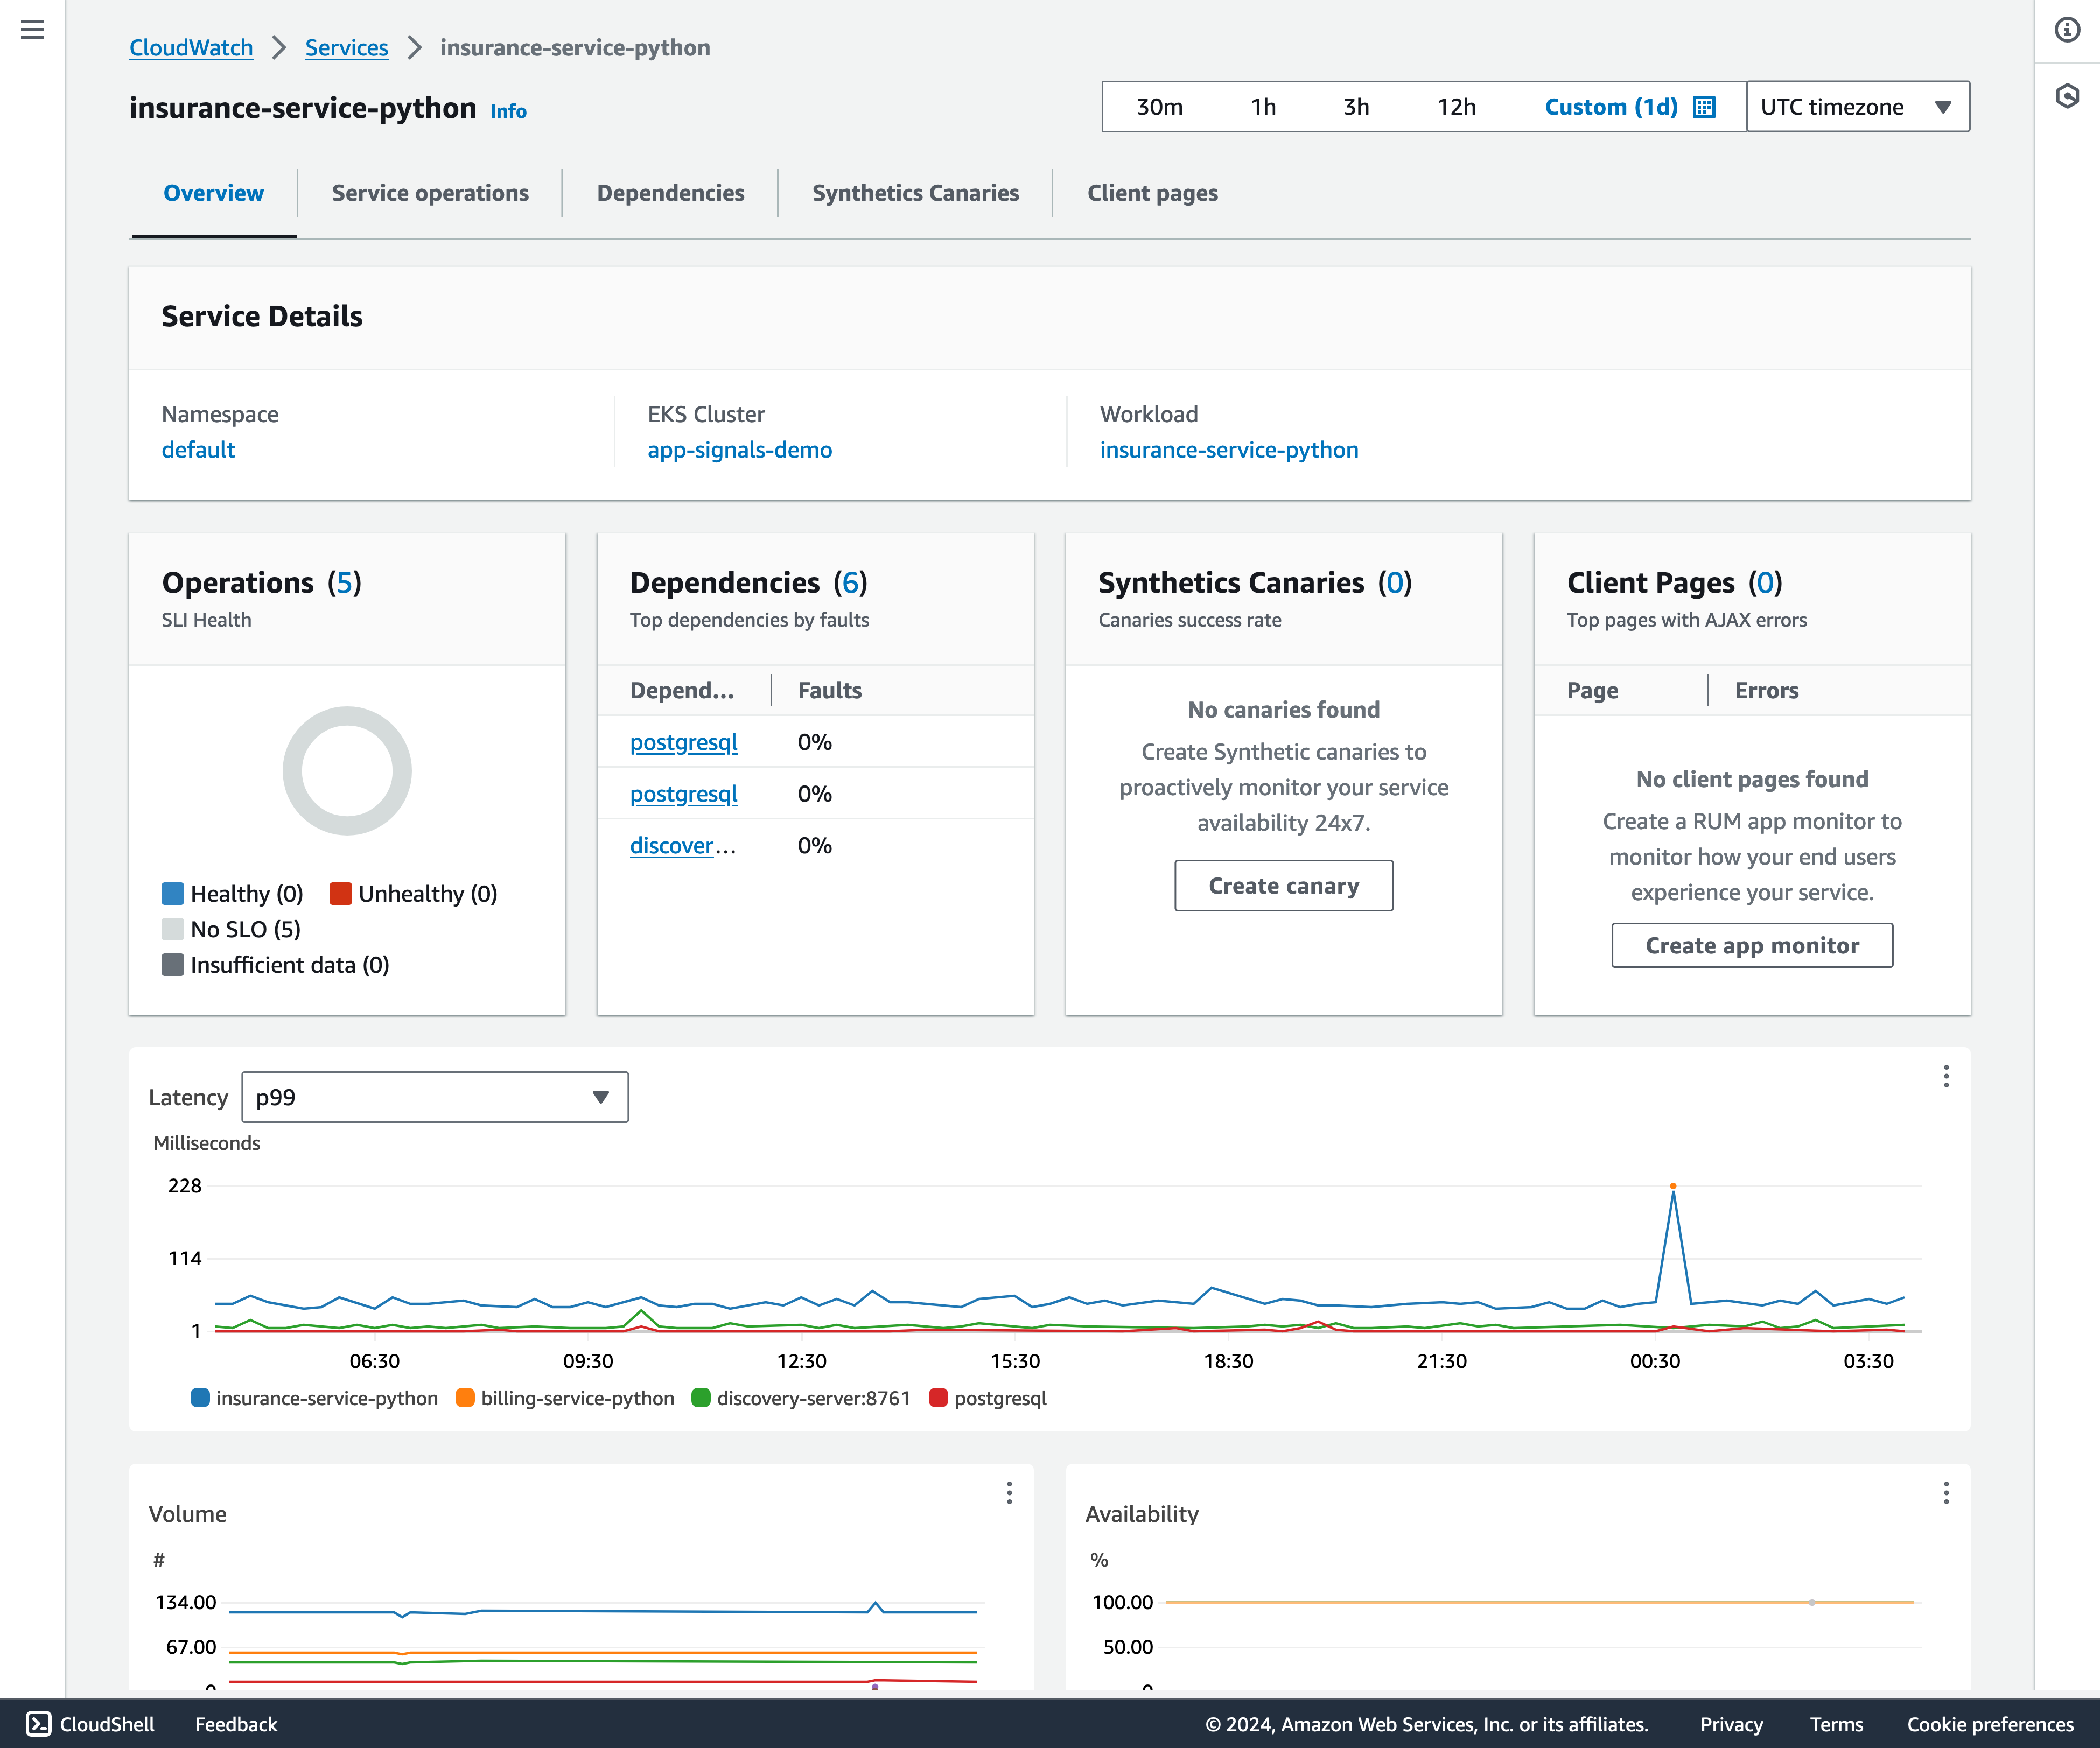
Figure 4: Service Overview
Navigate to the Service operations tab, choose an operation, and click on a specific time point on the metrics chart to open a pane which contains Correlated traces, Top contributors and Application logs associated with the selected point.
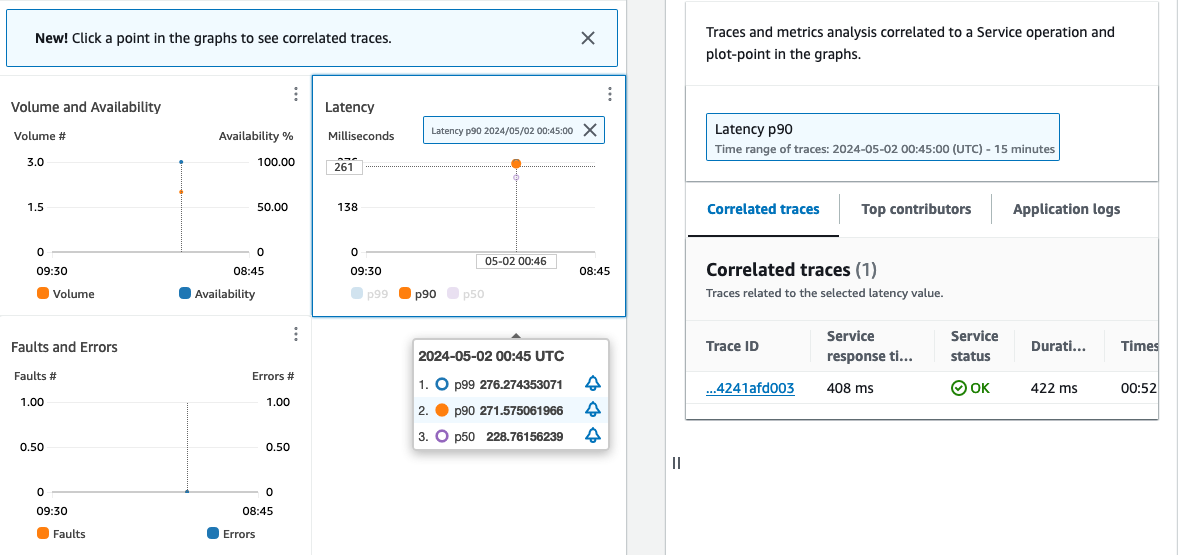
Figure 5: Service operations
Clicking on the trace ID will navigate you to the Trace details, where you’ll find a AWS X-ray trace map displaying all the upstream and downstream services associated with this trace ID.
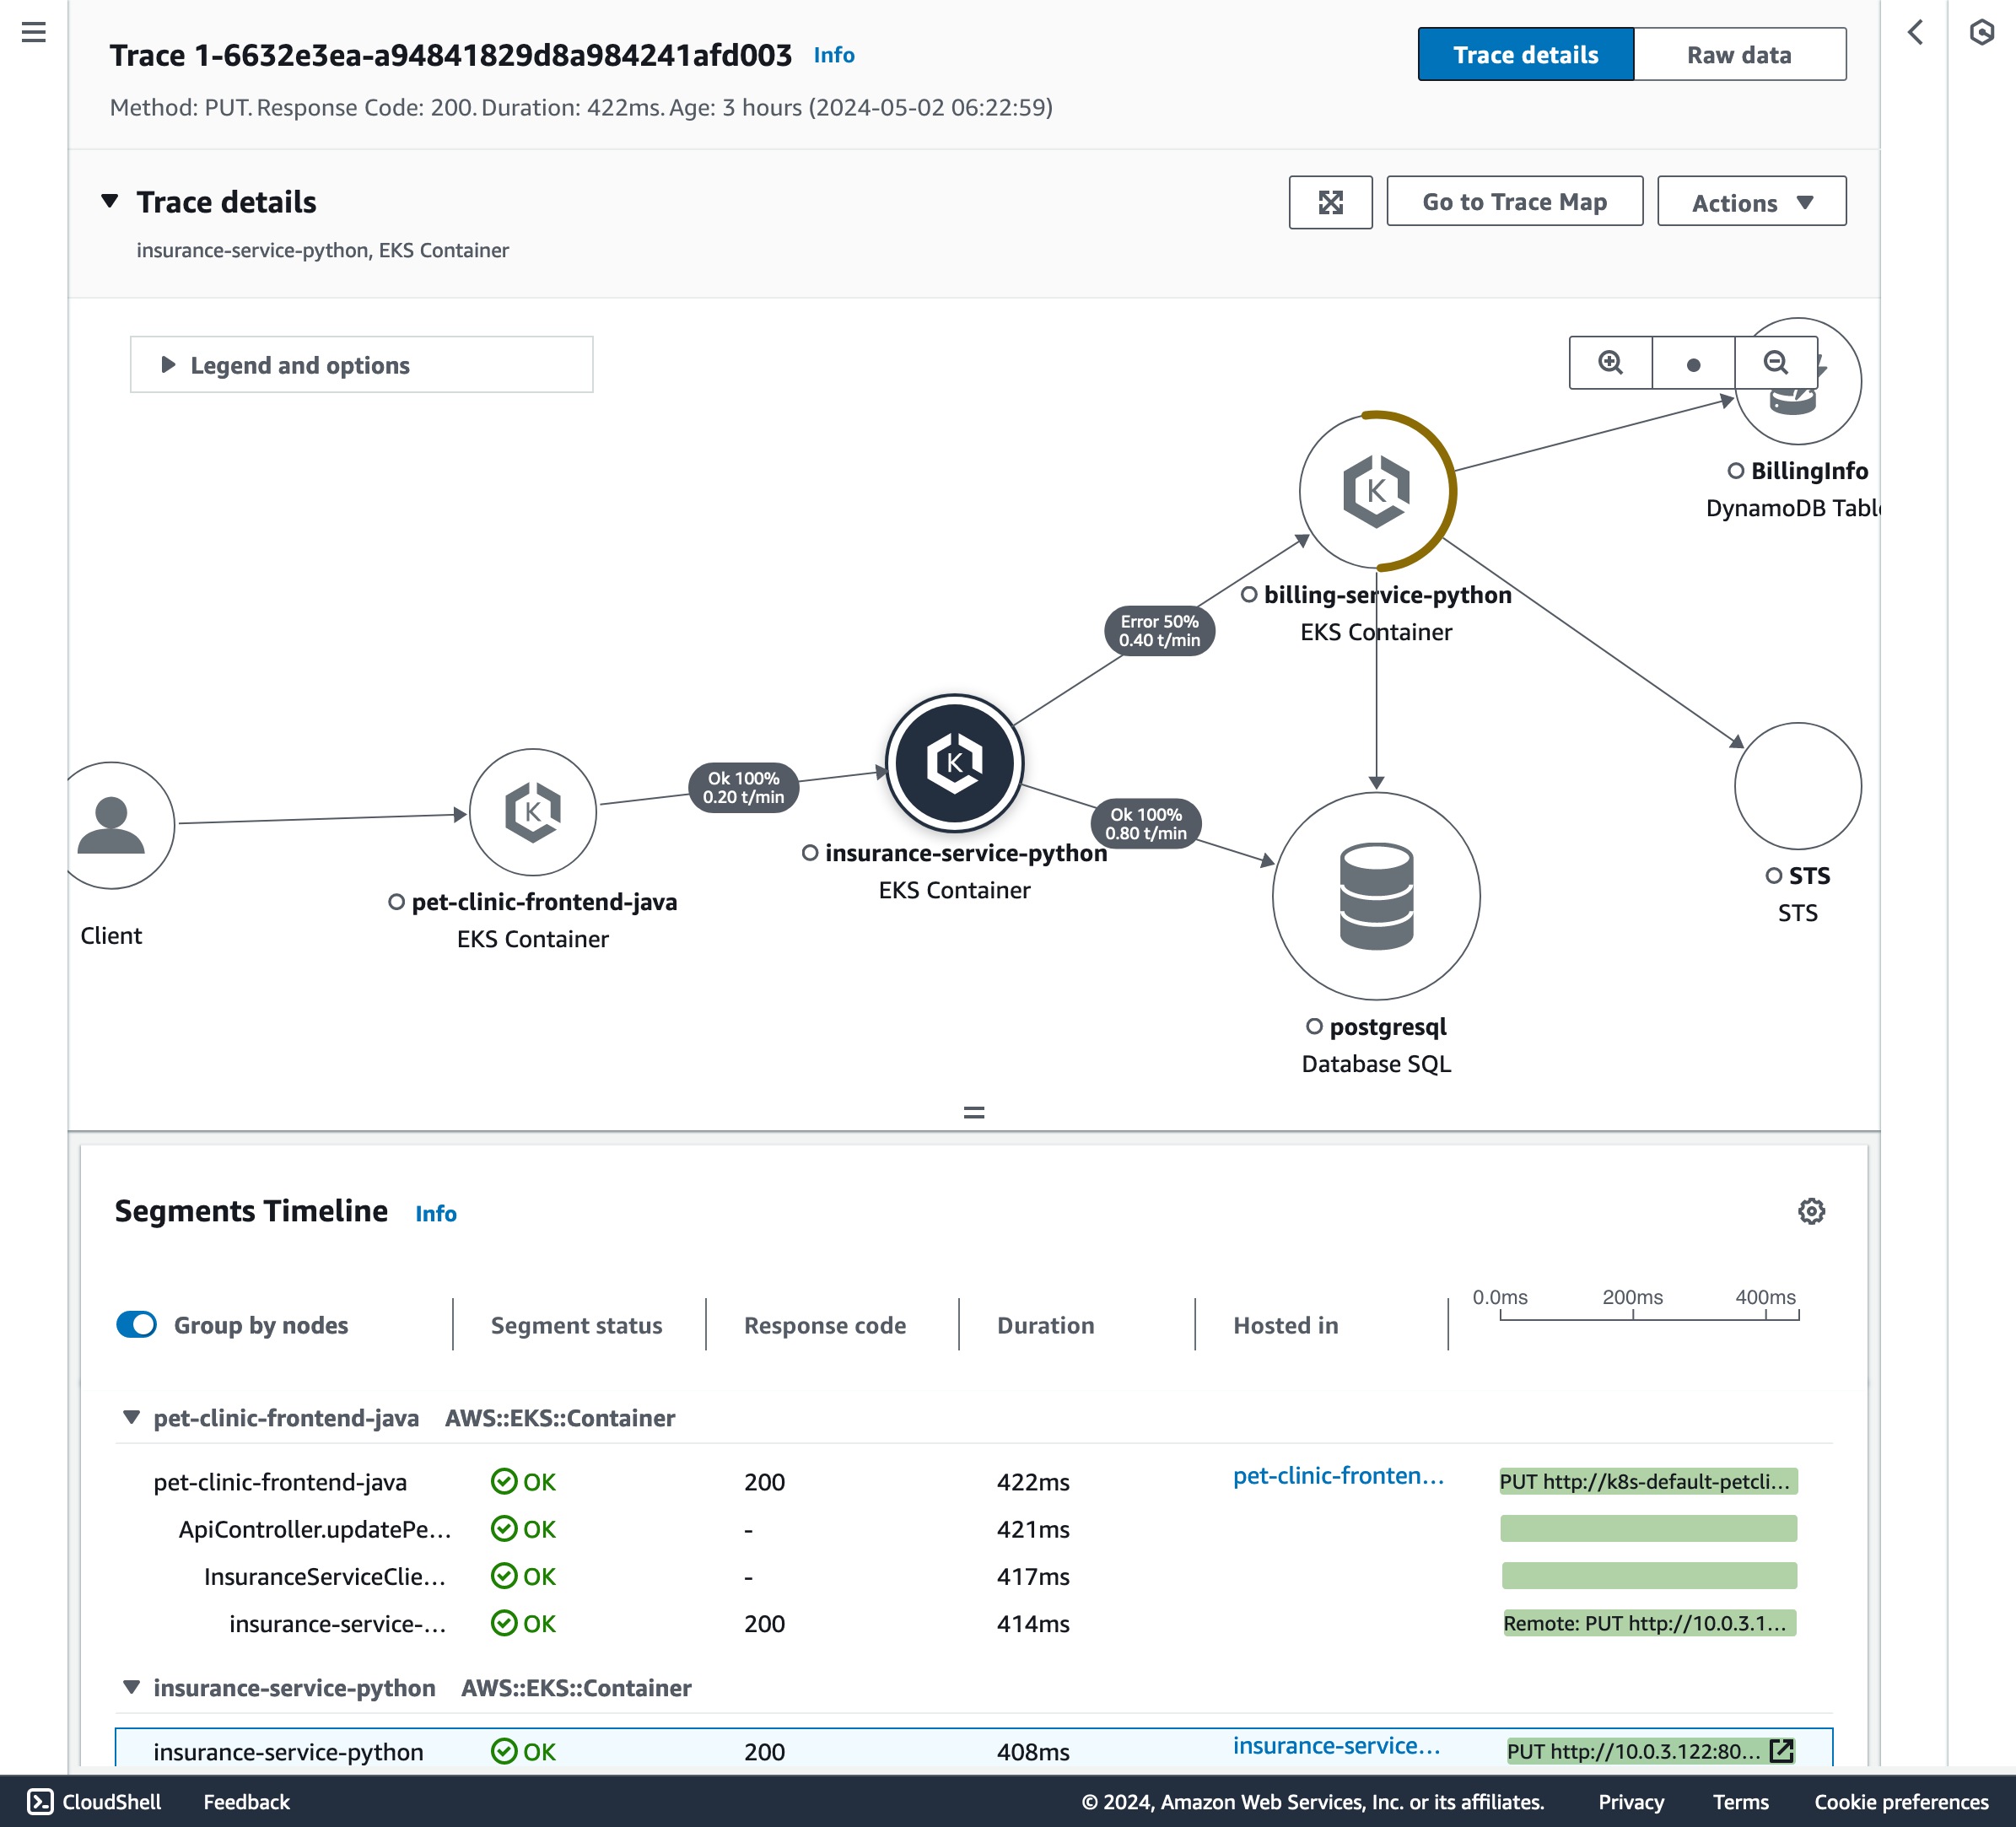
Figure 6: Visualize traces correlated with service operation metrics
The Top Contributors section directly displays metrics for Call Volume, Availability, Average Latency, Errors and Faults, broken down by infrastructure components. The Application Logs tab shows you a Logs Insights query to view related application logs.
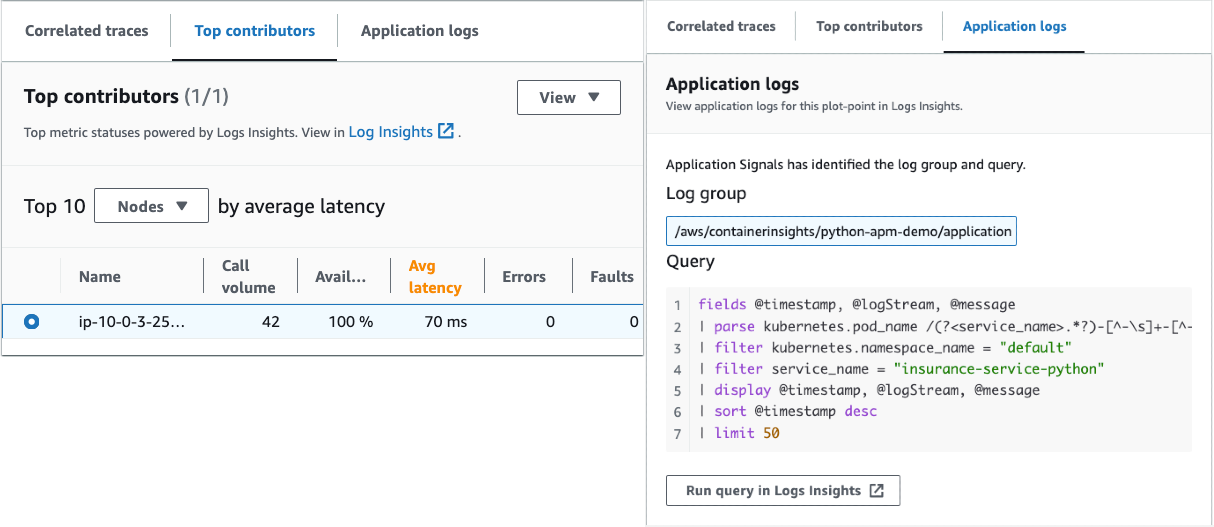
Figure 7: Top Contributors and Application Logs
A few clicks will display the correlated trace for you. This allows you to understand the root cause of the issue without manually querying traces separately.
Service Map
To view the Service Map, open the CloudWatch console and choose Service Map under the Application Signals section in the left navigation pane. Select billing-service-python service node as shown in Figure 8 to view connections between services and dependency nodes to help you understand your application topology and execution flow. This is especially helpful if your service operators are not your development team.
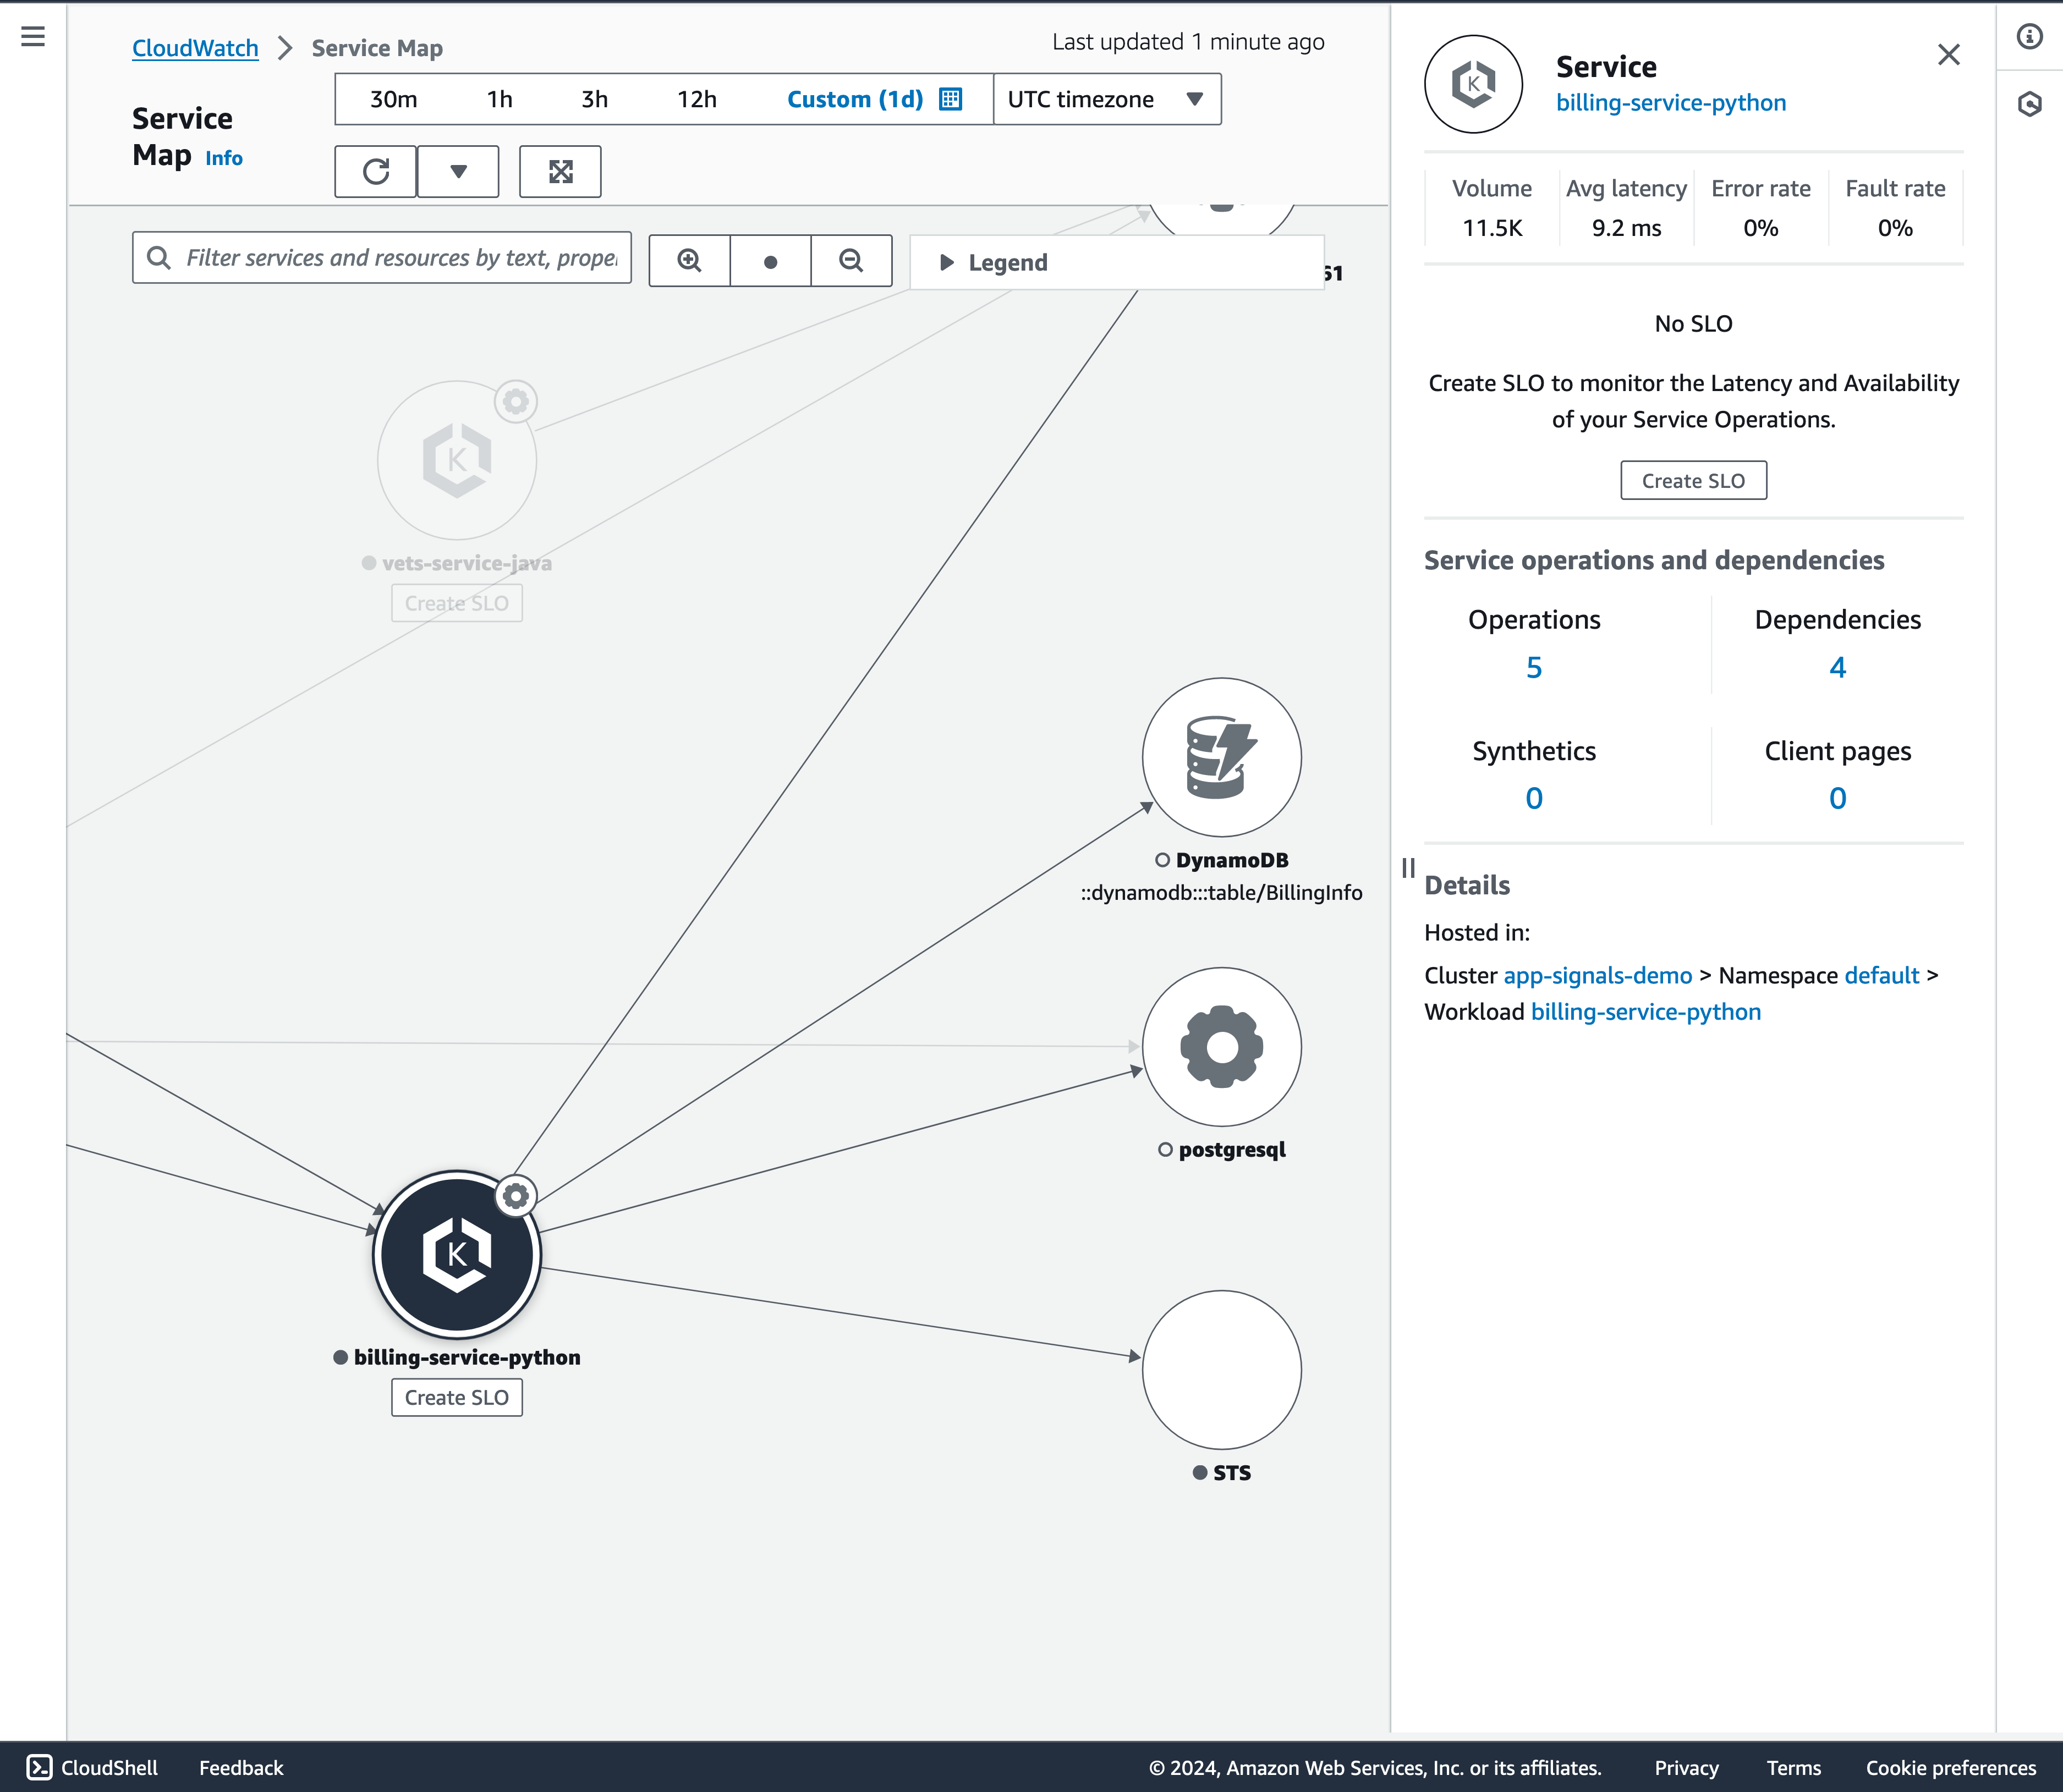
Figure 8: View application topology using Service Map
Service level objectives (SLOs)
Use Application Signals to define service level objectives (SLOs) for your most critical business operations. By defining SLOs for these services, you gain the ability to monitor them on the SLO dashboard, providing a quick overview of your most crucial operations. SLO conditions encompass latency, availability, and CloudWatch metrics, offering comprehensive tracking capabilities.
Follow the Create an SLO steps to create SLOs for PetClinic application.
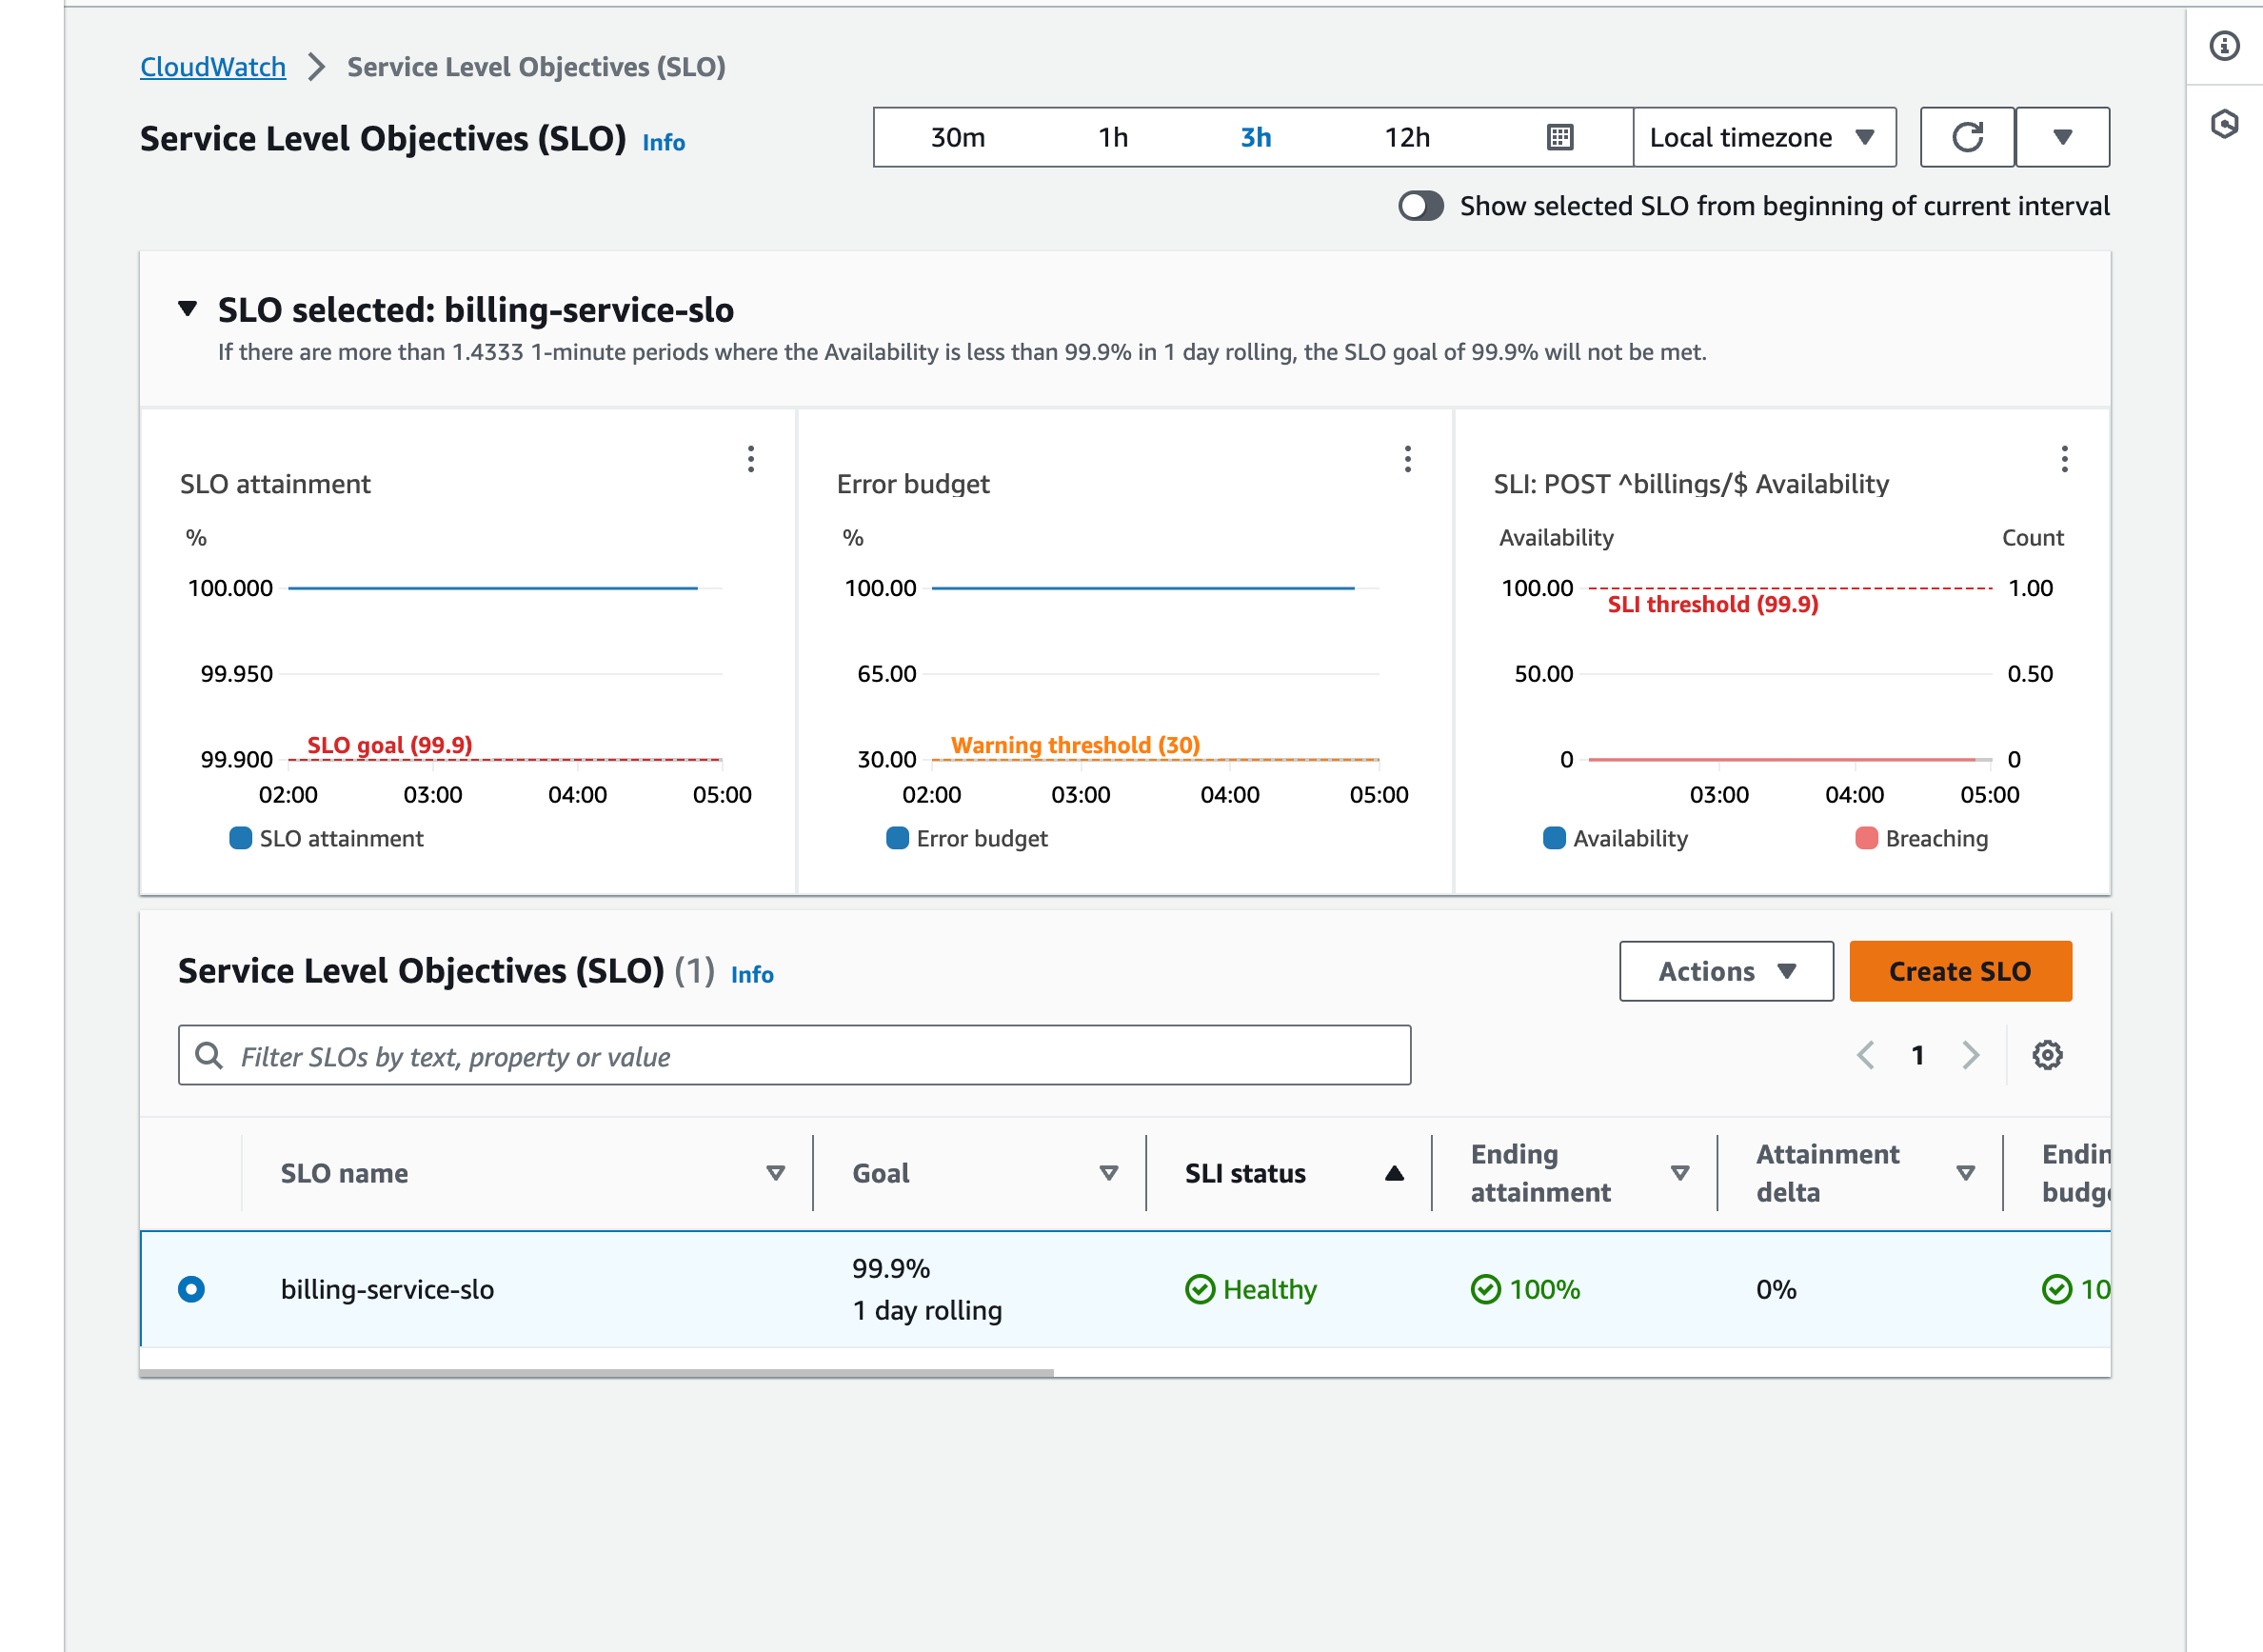
Figure 9: Create and visualize Service level objectives (SLOs)
Clean Up
Note: The previously defined environment variables values are required to successfully delete the application.
To stop incurring charges, run these commands to clean up the application. It will take 15-20 minutes.
Conclusion
In this blog post, you’ve gained insights into leveraging CloudWatch Application Signals to seamlessly instrument Python applications running on an Amazon EKS cluster, all without requiring any code modifications. This powerful capability empowers you to effortlessly gather golden metrics (call volume, availability, latency, faults, and errors) and traces for your application services, enhancing observability and facilitating effective monitoring and troubleshooting.
Moreover, we’ve explored how you can visualize the overall activity and operational health of your application services using pre-built dashboards which are provided out of the box by Application Signals. By leveraging these dashboards, you can easily access key performance metrics and correlate them with traces, enabling you to swiftly identify and address any underlying issues with just a few clicks. As a next step, we encourage you to try out Application Signals within your environment.
Please refer to the CloudWatch Application Signals documentation to explore more information or check out the CloudWatch Applications Signals use case in the One Observability Workshop for hands-on experience.