AWS Cloud Operations Blog
Multi-step API monitoring using Amazon CloudWatch Synthetics
|
As customers add more applications, the number of APIs and webpages increase exponentially. The new multi-step HTTP monitoring in Amazon CloudWatch Synthetics offers visibility and helps you proactively solve problems. It helps engineering teams monitor their APIs 24/7 using flexible scripts so that they can maintain SLA compliance. In this post, we show you how use the Amazon CloudWatch Synthetics canary that uses the multiple HTTP endpoints blueprint to monitor an application. |
 |
The HTTP Steps feature is available for syn-nodejs-2.2 and above that provides flexibility when monitoring multi-step API canaries and collects metrics and reports per step. It also provides detailed reports that include request and response headers, DNS lookup time, TCP connection time, and time to first byte for multiple HTTP requests in a single script.
Solution Overview
In the solution, we demonstrate the steps to create an API canary blueprint using the HTTP Steps feature that is available for syn-nodejs-2.2.
HTTP steps in action
CloudWatch Synthetics allows you to use blueprint scripts that are ready to be consumed but you can use the editor in the console or import a script from an Amazon Simple Storage Service (Amazon S3) bucket to create your own script. CloudWatch Synthetics supports canaries developed in Node.js and Python, but currently HTTP steps supports only Node.js.
To simulate how CloudWatch Synthetics handles failure, we will use the httpbin.org website to call two APIs, but you can use your own HTTP endpoint to simulate the same output. The first call will return a successful response, however, the second will return an error and purposely generate a failure in the canary test.
To create an HTTP steps script:
- Open the Synthetics menu of the CloudWatch console.
- Choose Create Canary.
- Choose the API canary from the blueprints list.
- Under Name, enter a name for your canary – for example http-steps-test.
- Under HTTP requests, choose Add HTTP request
- Under method, select the method GET.
- Enter the URL https://httpbin.org/anything under the Application or endpoint URL.
- Under Headers, enter Content-Type in the Key field and application/json in the Value
- Under Request data, enter the json { “foo” : “bar” }
- Under Reporting configuration, enable the Capture headers and response body
- Choose Save and add another call
- Repeat the steps 6, 7 and 10, but use the URL https://httpbin.org/status/400
- Choose Save
- Ensure the Active tracing is enabled at the end of the blueprint.
On the Canaries page, choose Create canary. It takes approximately one minute. When the canary is created, it will be displayed in the Canaries list, as shown in Figure 2. For information about how to use the API canary blueprint, see API canary in the Amazon CloudWatch User Guide.
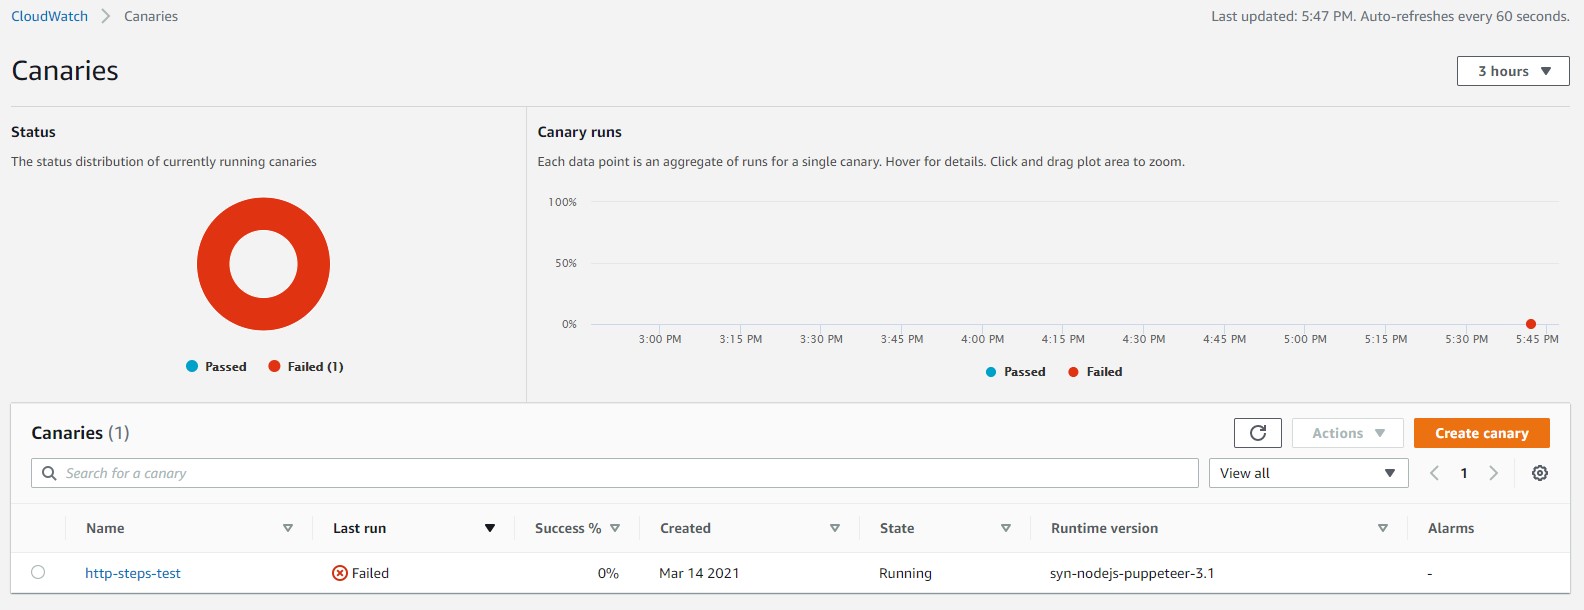
Figure 2: Canaries page of the CloudWatch console
Review Results
Understanding reports
The canary reports show all steps (in this case, two) and the results of the calls (in this case, Passed and Failed). You can use the details page for the canary to read logs, visualize the AWS X-Ray traces, see the configuration, and update the script.
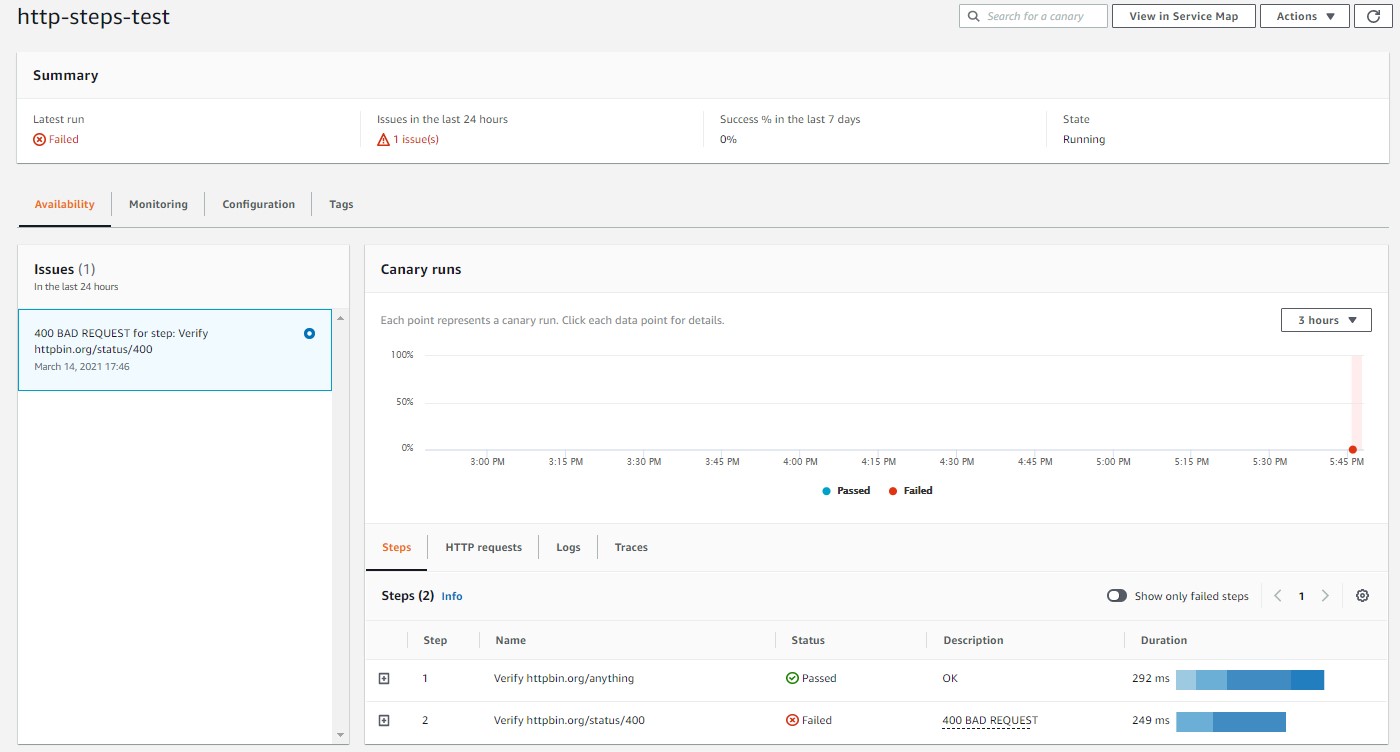
Figure 3: http-steps-test report
Availability tab (HTTP requests)
The calls returned response codes 200 (OK) and 400 (Bad request). The 400 error is defined in the httpbin.org call that fails the script, and changing the URL to use the number 200 causes the script to pass; however, later in this post, we will walk you through the steps to create a negative test, which will pass the canary by accepting the 400 error.
Synthetics also captures details about each HTTP requests, including:
- Request and response headers
- Request and response body
- Duration, including total duration, DNS lookup time, TCP connection time, time to first byte, and content transfer time
- Status code and description
Some of this information is available when you hover over the duration chart of each step.
To analyze in details the steps performed by the script, you can either use the HTTP requests or Steps tab located on the AVAILABILITY tab. The HTTP requests is similar to the Steps tab, however the HTTP Request shows other HTTP calls made during script execution, for example, if your script calls AWS Secrets Manager to store and retrieve certificates, these calls will show up in that list.
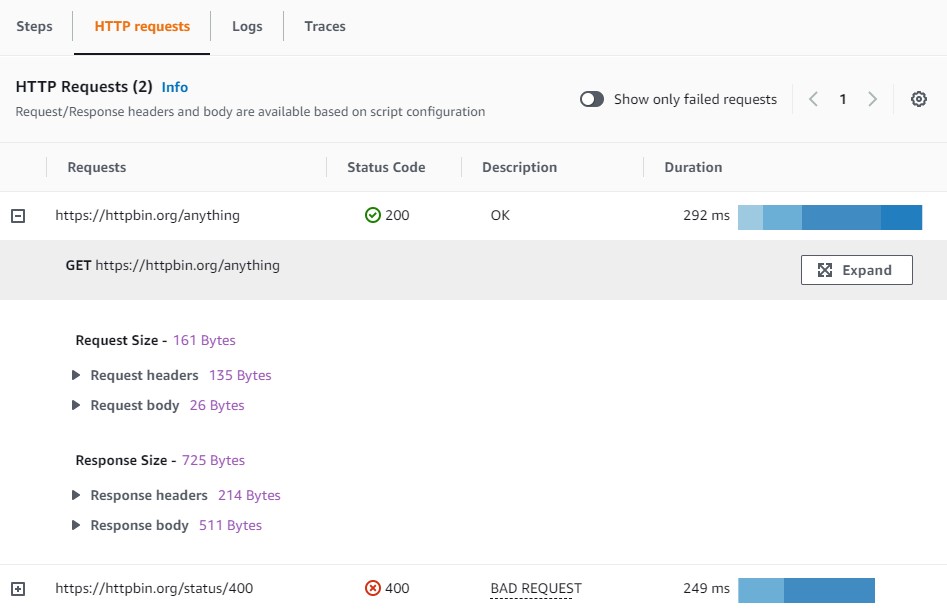
Figure 4: Canary runs
Click on the + of each step and then choose Expand to see details about the communication between the script and the endpoint. Because we enabled the Capture headers and response body option in our steps, these details are also returned in the request details.
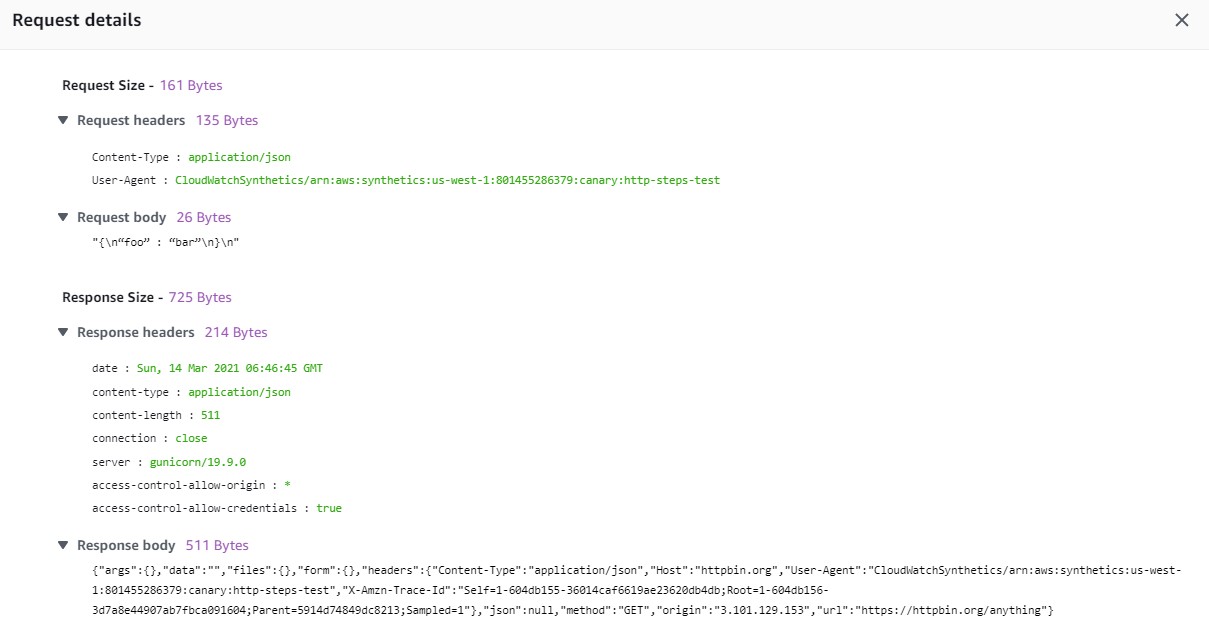
Figure 5: Request details
Availability tab (Logs)
The Logs tab shows what happened during the canary execution. It includes script errors, connection issues, the results of each step, and the S3 bucket and folder used by the canary to save the logs.
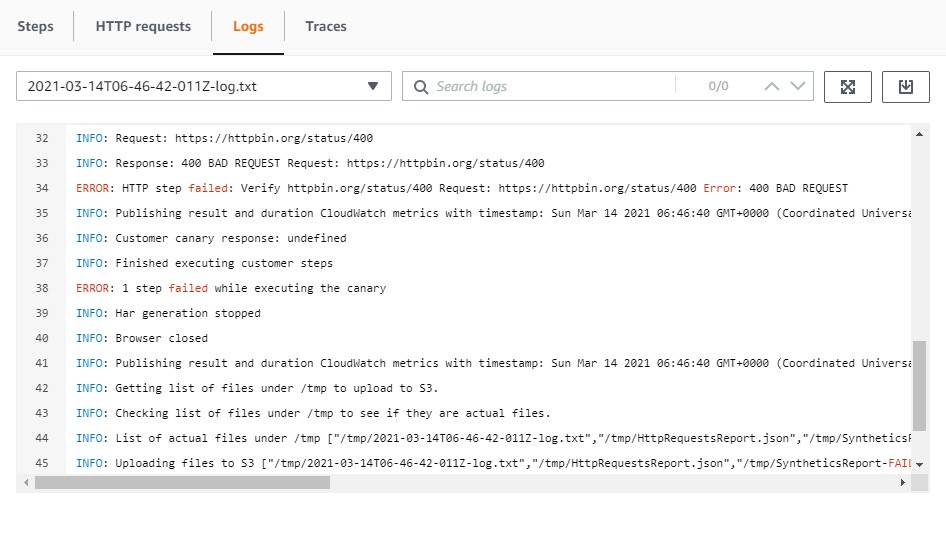
Figure 6: Log report
Availability tab (Traces)
CloudWatch Synthetics allows you to add active tracing with the API Canary blueprint. For faster debugging, you can use the Traces tab to track the calls using AWS X-Ray and Amazon CloudWatch ServiceLens. Each call has a trace ID. To display the trace ID, choose Go to trace map. The blog post Debugging with Amazon CloudWatch Synthetics and AWS X-Ray provides you more information on how to debug using X-Ray.
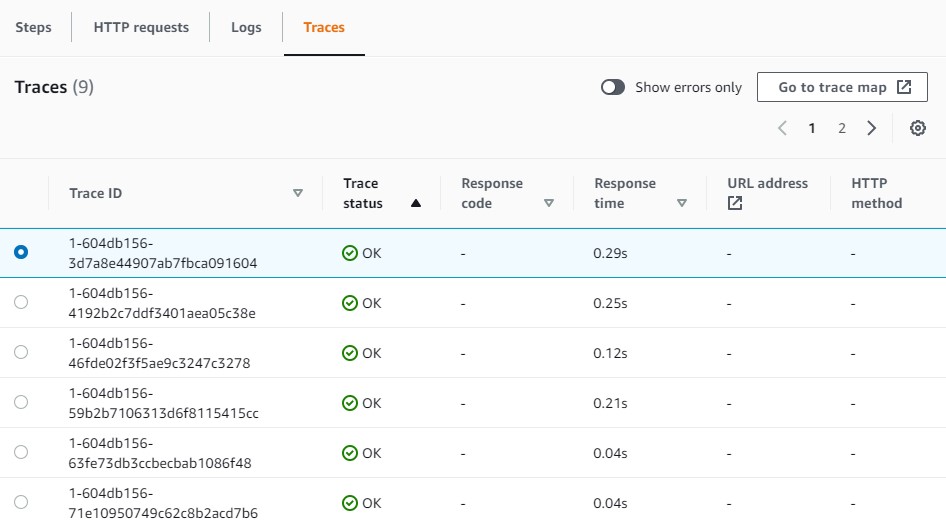
Figure 7: Traces tab
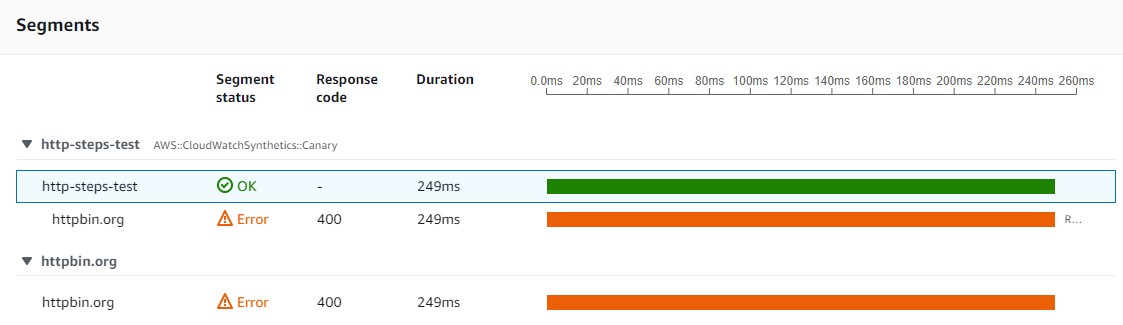
Figure 8: Segments
Monitoring tab
The Monitoring tab displays a dashboard with CloudWatch metrics generated by the script. It includes the HTTP status code, such as 4XX and 5XX, the duration of each step, success rate, and more. You can combine these metrics with CloudWatch alarms to alert you when an error occurs. That way, you can be proactive and fix problems before they impact your users.
For the full list of metrics, see CloudWatch metrics published by canaries in the Amazon CloudWatch User Guide.
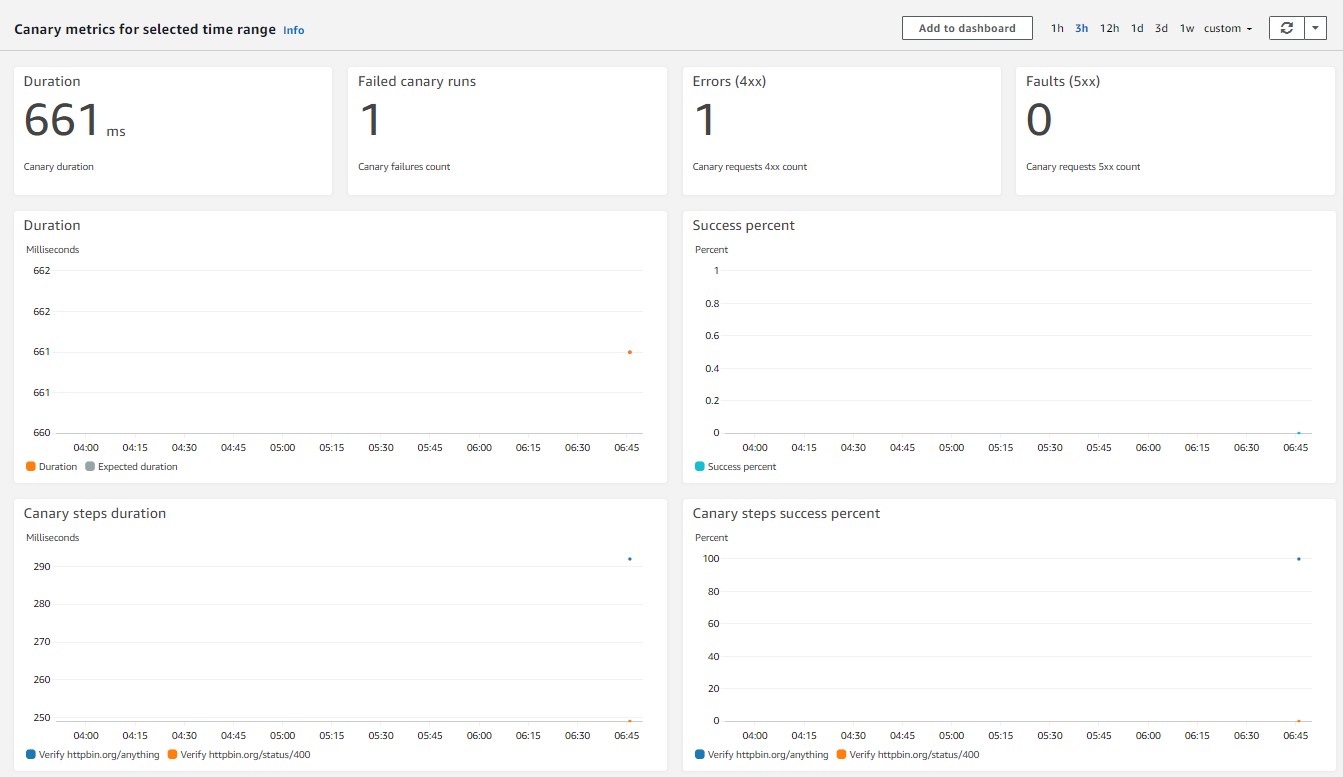
Figure 9: Canary metrics for selected time range
Negative test
It’s important to test the same API for positive and negative test cases. For example, you may want to see if the application can gracefully handle invalid inputs and identify unexpected behavior from users or connections. Detecting these situations early prevents applications from failing, which leads to a better user experience.
To accept the status code 400 and enable the negative test, follow the steps below:
- Open the Synthetics menu of the CloudWatch console.
- Choose the canary created above – for example http-steps-test.
- Choose Actions.
- Choose Edit.
- Using the Script editor, add the validateNegativeCase method to the canary script.
    // Handle validation for negative scenario
    const validateNegativeCase = async function(res) {
        return new Promise((resolve, reject) => {
            if (res.statusCode != 400) {
                throw res.statusCode + ' ' + res.statusMessage;
            }

            resolve();

        });
    };
- Update the executeHttpStep() method of the second step (Verify httpbin.org/status/400) to use the validateNegativeCase function – see the example below.
await synthetics.executeHttpStep('Verify httpbin.org/status/400', requestOptionsStep2, validateNegativeCase, stepConfig2);This method raises an exception if the status code returned is different than 400, which fails the canary script. This method can also be extended by adding business logic when necessary, for example, you can check the body of the message and act accordingly. For more information, see Sample code for canary scripts in the Amazon CloudWatch User Guide.
As soon as the script is updated and run again, on the Canary runs page, you should see it has a status of Passed.
Cleanup
To avoid charges in your AWS account, be sure to delete the canary script:
- Open the Synthetics menu of the CloudWatch console.
- Choose the canary created above – for example http-steps-test.
- Choose Actions and then choose Stop.
- Wait for the canary to stop.
- Choose Actions and then choose
- Enter the phrase Delete and then choose Delete.
For more information, see the Editing or Deleting a Canary section of the Amazon CloudWatch user guide
Conclusion
In this blog post, we walked you through the steps to create a multi-step API monitoring script to check two public endpoints, one of which failed with the 400 HTTP status code. We showed you how to change the canary script to accept negative tests.