AWS Cloud Operations Blog
Quantify custom application metrics with Amazon CloudWatch Logs and metric filters
Customers have valuable metrics emitted to their logs. Examples include web server response times, slow queries, purchases by partners, custom application metrics, and cache hits or misses. This data has unrealized potential value for increasing observability. Consumed by Amazon CloudWatch Logs and extracted using metric filters, customers can translate this data into actual CloudWatch metrics, then create alarms and dashboards, as well as leverage anomaly detection.
In this post, we will create and ingest custom logs into CloudWatch Logs, and showcase:
- How to use CloudWatch Logs Insights to query your log data
- How to build a metric filter to turn your log data into numerical metrics
- How to visualize the CloudWatch metrics in a timeseries dashboard
Sample Solution
Here we launched a sample WordPress site using an Amazon Machine Image (AMI) from the AWS Marketplace. This AMI includes a NGINX server, where we can customize the access logs, and send them to CloudWatch Logs. While the process for creating a new running EC2 instance from an AWS Marketplace image is outside of the scope for our post, we will outline the procedure once you have one created. The procedures are as follows:
- SSH into the EC2 instance. The default user name will be “bitnami”. On Mac or Linux the log in command will be similar to this:
- Now modify the NGINX configuration file to generate custom logs for every user’s hit to the application. These commands will take you to the correct file:
- A sample of the modifications are shown as follows. These logs utilize information such as status of request, size of the response body, time required for the server to respond, and many more.
- Reload the NGINX server to apply configuration changes.
- Install the CloudWatch agent. Note that, although this server itself is built on top of an EC2 instance, the approach works equally well if you are operating a server on-premises.
- Create a new CloudWatch agent configuration with the built-in wizard. When prompted to monitor any log files, select yes and enter the location of custom access log file.
- Start the CloudWatch agent. The CloudWatch agent is closely monitoring any changes made to the access log file, aggregating the changes, and sending them to the CloudWatch service on AWS to prepare for further analysis. The CloudWatch agent is truncate-aware and watches logs in real-time for additions.

Note that this procedure is taken from a specific Linux-based AMI. Similar steps can be taken on other Linux distributions, or even with Microsoft Windows Server. These steps are a guide for this specific AMI.
Querying with CloudWatch Logs Insights
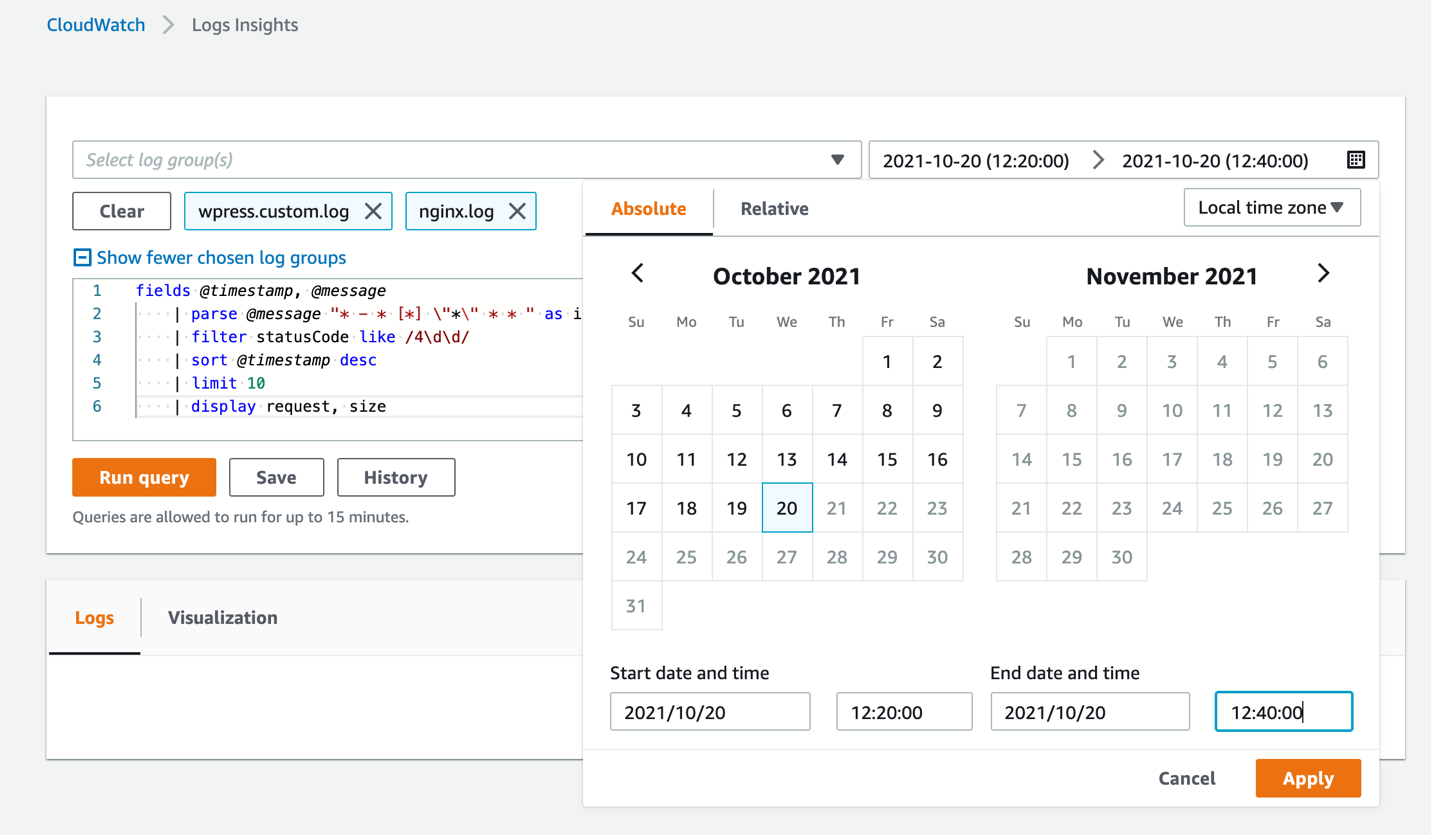
CloudWatch Logs Insights lets you interactively query and analyze your log data. The query can be applied to single or multiple log groups of your choice, and within an absolute or relative timeframe of your interest. This is especially helpful if you would like to identify potential root causes when an incident occurs.
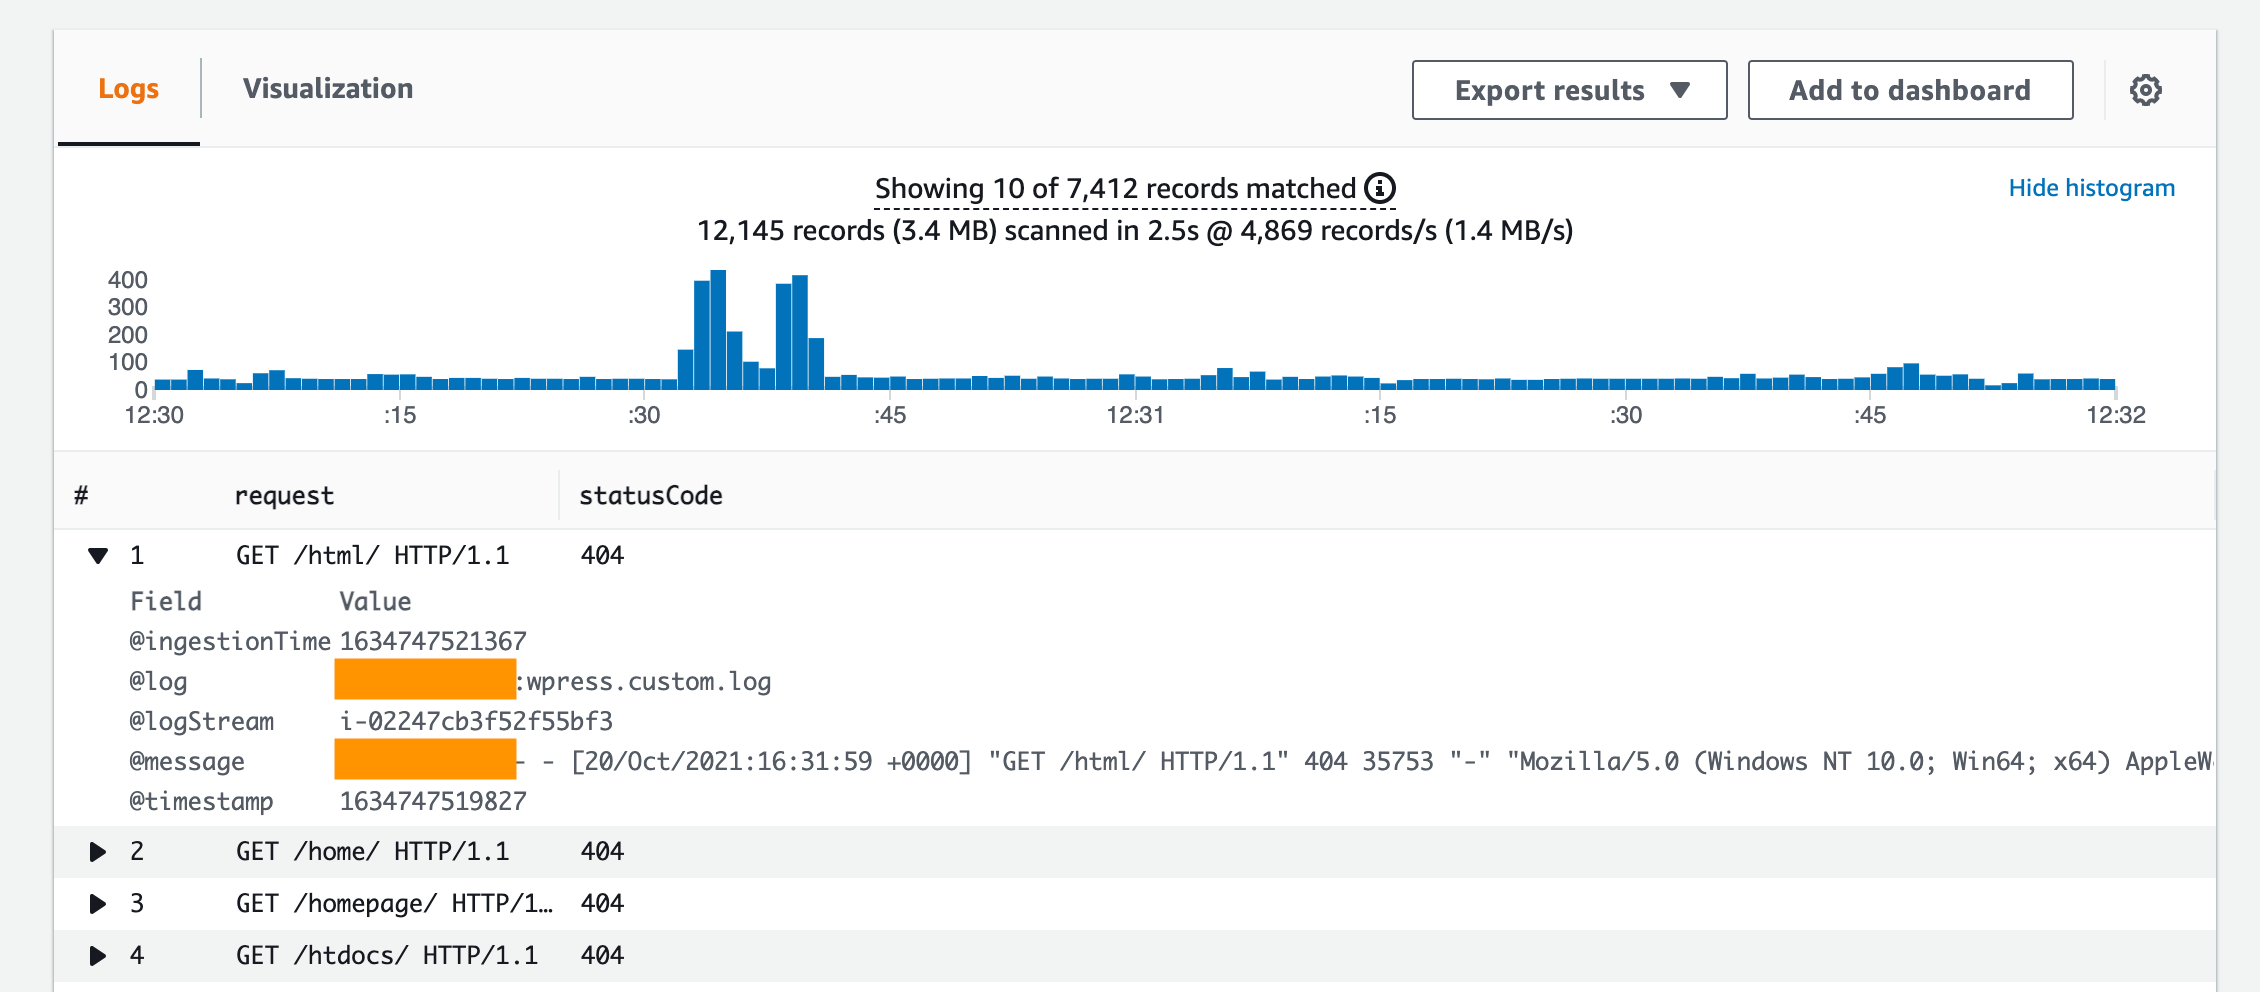
You can display the queried results in a timeseries graph, which shows the number of requests performed at each point in time. You can also expand the displayed requests to see which fields available, and the value for each field.
Creating the Metric Filter
Metric filters can be created on top of CloudWatch Logs log groups, and are the way to convert the log data into measurable, actionable CloudWatch metrics. You can define patterns for the incoming log data, and filter according to the terms that you define. As in the following example, we define the pattern for WordPress access logs, and filter on 400 level status code.
Note that the metric filter is different from a log insights query, where the experience is interactive and provides immediate search results for the user to investigate. No automatic action can be invoked from an insights query. Metric filters, on the other hand, will generate metric data in the form of a time series. This lets you create alarms that integrate into your ITSM processes, execute AWS Lambda functions, or even create anomaly detection models.
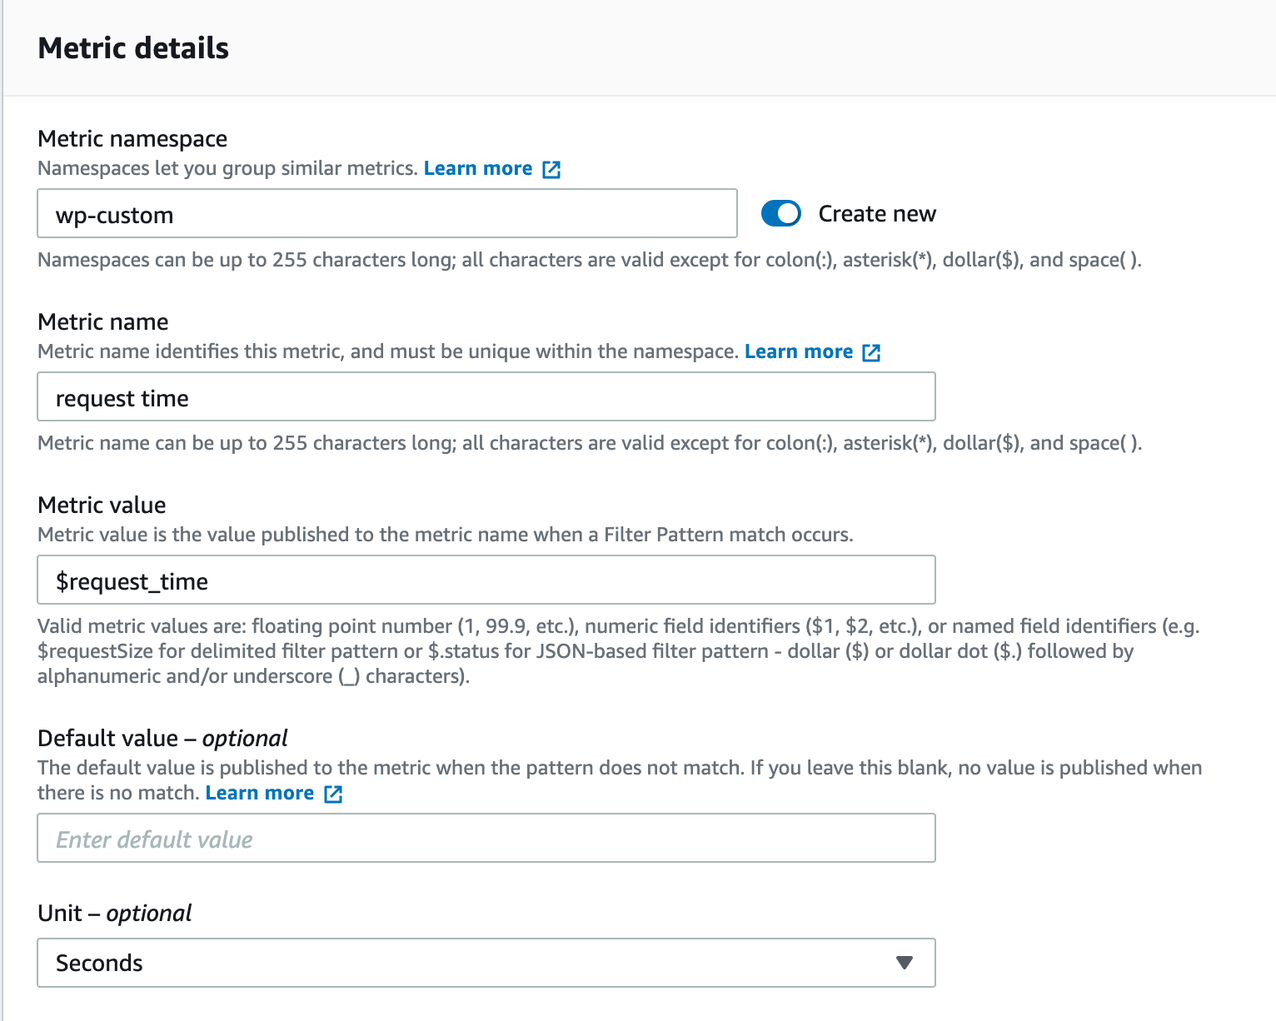
Aside from defining the filter pattern, another important aspect is the value for your metric. For example, if you would like to count the occurrences of logs, you can put “1” into the metric value field. Alternatively, a variable input like “$request_time” is also supported. Extracting values from your log data is an especially powerful way of gaining observability into your workload’s health and operations.
Here you see an example of a metric filter being created from within the CloudWatch console.
Note that the metric filter is not retroactive, meaning that when you create the metric filter, it will not generate metrics from historical log data. Only events that happened after the creation of the metric filter will be converted to CloudWatch metrics. Therefore, be mindful of what can be utilized within your log data, and create your metric filters early!
Exploring the Time Series Dashboard
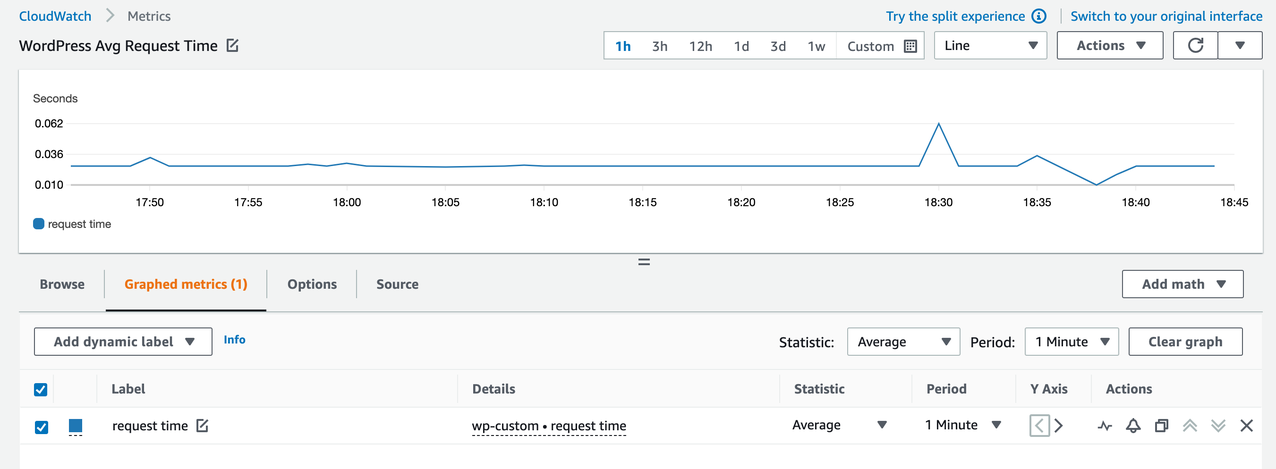
After creating your metric filter and leaving the site to run for a period of time, you can visualize how the metric value changes over time within the CloudWatch dashboard. In the following image, the “average” aggregation function is used on metric, over a period of one minute. Here, you can see the WordPress site takes on average 0.026 s to respond to customers’ requests, but, at 18:30pm and 18:38pm, there’s a jump and dip on response time, both indicating anomalies.
From another client error graph, as shown in the following image, we can see the total number of requests, generated within one minute, for different error codes. Here, we are using the “sum” function aggregate metrics. At both time frames with unusual average request times, there are number of faulted requests generated. These requests, since faulted, can be crafted to stall the application, or, if it is requesting a non-existent file, be immediately rejected by the server.

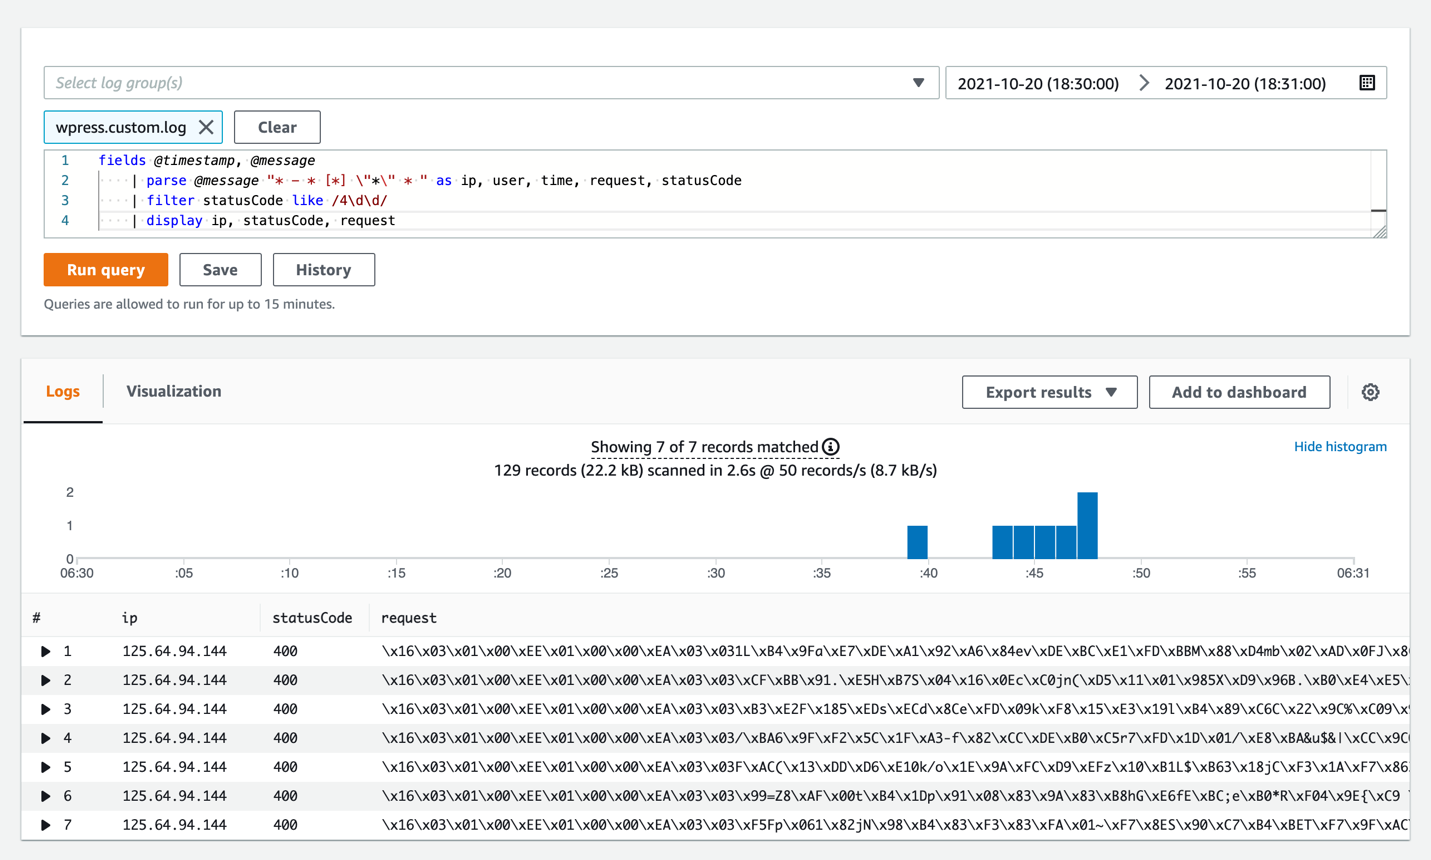
To further investigate into underlying faults, we can utilize CloudWatch Logs Insights and select the corresponding time periods, as in the following image. From this graph, we can select the corresponding time period, identify the requests made, and the malicious IP that is trying to attack the WordPress site. From there, it is possible to block this address by creating a “Deny” rule with a Network ACL (or other approaches, such as firewall appliances or AWS Network Firewall).
Next Steps
Creating metric filters to convert CloudWatch Logs into quantifiable metrics can further increase observability into your environment.
You can start by analyzing log data that is on-premises, or in AWS, but has not been utilized, such as application logs, server logs, cache responses. If the logs are on-premises, then you can ingest these logs into CloudWatch with the CloudWatch agent. If the logs are present within CloudWatch logs, then you can analyze the metrics that are helpful for your business. For example, if over 10% of customer requests are failing with a server-side error (i.e., status code 5xx).
With the use case identified, you can create metric filters for the identified scenarios. This opens the door not only for visual, dashboard analysis like we show in this post, but also for further automatic action, such as creating CloudWatch alarms coupling with SNS topics to alert the administrator.
Happy observing!