AWS Open Source Blog
Enhancing AWS X-Ray support in OpenTelemetry JavaScript SDK
In this post, AWS intern Kelvin Lo shares his experience of enhancing the OpenTelemetry JavaScript SDK to support AWS X-Ray. These enhancements are also available in the AWS Distro for OpenTelemetry.
OpenTelemetry is a popular open source project under Cloud Native Computing (CNCF) Foundation. OpenTelemetry provides a set of components including APIs and SDKs for robust and portable telemetry of cloud-native software. It can be used to instrument, generate, collect, and export telemetry data such as metrics, logs, and traces. This data can be exported to various backends for analysis to understand a traced application’s performance and behavior.
AWS X-Ray is a distributed tracing system that allows developers to analyze and debug production, distributed applications, such as those built with a microservice architecture. AWS X-Ray shows how an application and its underlying services are performing, to help identify and troubleshoot the root cause of performance issues or errors. This is beneficial as it shows the correlation of application performance data to underlying infrastructure data, reducing the time it takes for problem resolution.
Because OpenTelemetry does not support AWS X-Ray by default, we enhanced the OpenTelemetry JavaScript SDK to ensure end-to-end support for sending traces to AWS X-Ray. Earlier this summer, we added support to application instrumentation for AWS X-Ray on Amazon Elastic Compute Cloud (Amazon EC2), Amazon Elastic Container Service (Amazon ECS), and AWS Elastic Beanstalk.
In late 2020, I expanded on these enhancements to include Amazon Elastic Kubernetes Service (Amazon EKS) support in the SDK. I implemented three CI/CD workflows that allow contributors to have a better experience to easily develop, build, and test. Additionally, I built a sample application to get started, improved existing components and documentation, and added a getting started guide for the AWS Distro for OpenTelemetry.
Requirements for OpenTelemetry JavaScript SDK
- Support for AWS X-Ray: To see traces from an application instrumented with OpenTelemetry JavaScript SDK running on Amazon ECS, Amazon EKS, Amazon EC2, and AWS Elastic Beanstalk.
- Integration tests: Build a sample application that validates the functionality of the implemented components and data.
- CI/CD workflows: Have workflows that automate the releasing, publishing, and testing of the various components.
- Technical documentation: Provide a way for any user to understand what each component does and how to get started.
OpenTelemetry components for AWS X-Ray
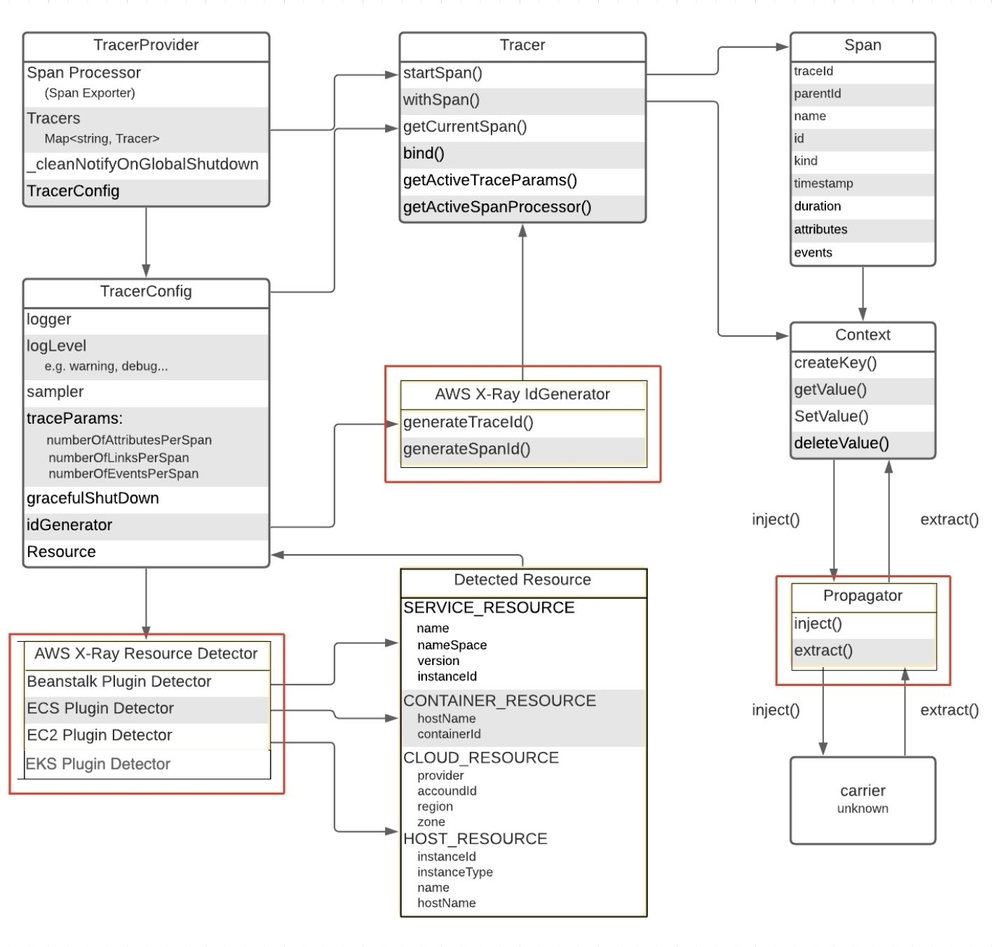
In order to integrate OpenTelemetry with AWS X-Ray, seven components needed to be designed and implemented. The components that were implemented earlier—AWS X-Ray ID Generator, AWS X-Ray Propagator, and AWS X-Ray Resource Detectors—are signified in the diagram as they are specific to AWS X-Ray. The components that are not signified were previously existing in OpenTelemetry. The diagram illustrates how the AWS components interact with existing OpenTelemetry components.
In OpenTelemetry, the creation of OTLP TraceId uses the W3C trace format, which generates a random unique 32-hex-character lowercase string. However, to use OpenTelemetry tracing with AWS X-Ray, we needed to override the OTLP traceID creation function. This is because AWS X-Ray does not use the W3C trace format; rather, it uses a different format where the first 8-hex-digits represents the timestamp at which the trace is generated and the remaining 24-hex-digits are randomly generated.
The AWS X-Ray ID Generator is responsible for generating trace ID with its first 8 hexadecimals representing the original request in Unix epoch time and the other 24 being randomly generated. By default, OpenTelemetry generates a random 32 hexadecimal trace ID. AWS X-Ray reads incoming traces using the first 8 hexadecimals of a trace ID to encode the start time of a trace and automatically invalidates any traces older than 30 days. If the default ID Generator were to be used, AWS X-Ray would reject almost all of the incoming traces. The ID Generator can be configured in the TracerProvider and any traces generated will automatically use the instrumented AWS X-Ray ID Generator to generate trace IDs.
The AWS X-Ray Propagator is responsible for providing HTTP header propagation for systems that are using AWS X-Ray HTTP header format. Without the correct HTTP headers, AWS X-Ray will not be able to pick up any traces and its metadata sent from OpenTelemetry. The AWS X-Ray propagator translates the OpenTelemetry context into the equivalent AWS X-Ray header format, for use with the OpenTelemetry JavaScript SDK. By default, OpenTelemetry uses the W3C Trace Context format for propagating spans, which is different than what AWS X-Ray takes in.
AWS X-Ray Resource Detectors capture information about the environment for which telemetry data is generated. This information is added as attributes within each trace sent to AWS X-Ray. There are four resource detectors that have been implemented:
- Amazon Elastic Beanstalk
- Amazon Elastic Kubernetes Resource Detector (Amazon EKS)
- Amazon Elastic Container Service (Amazon ECS)
- Amazon Elastic Compute Cloud (Amazon EC2)
These resource detectors allow the instrumentation of applications running on Amazon EC2, Amazon ECS, and Amazon EKS on EC2, and AWS Elastic Beanstalk.
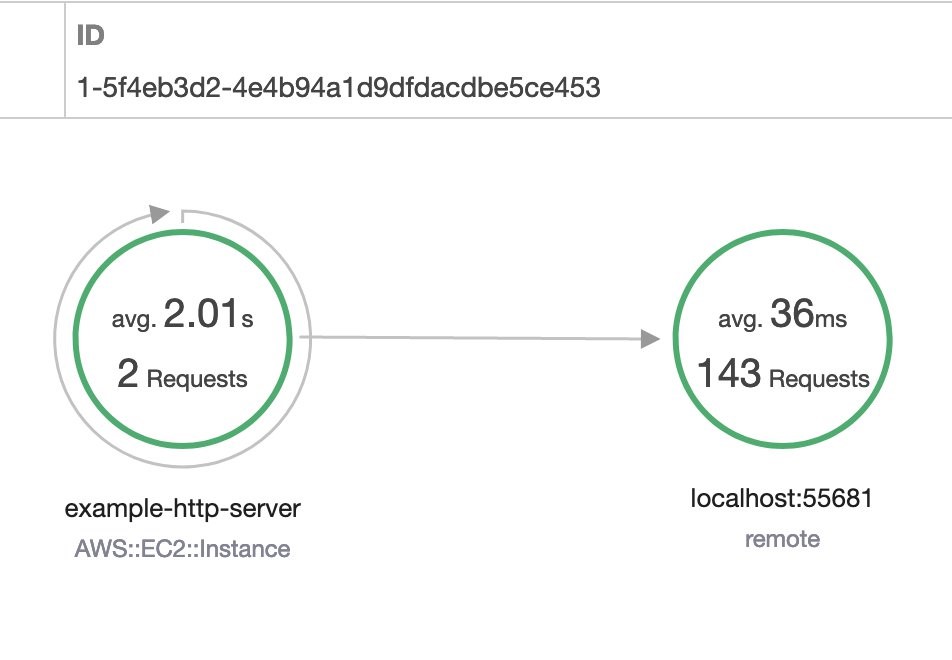
The preceding image shows a successful trace in AWS X-Ray. After these components were implemented and instrumented to a sample JavaScript application hosted on Amazon EC2, we can see traces on AWS X-Ray. I made sure to check that the incoming traces’ timestamp and application information were as expected.
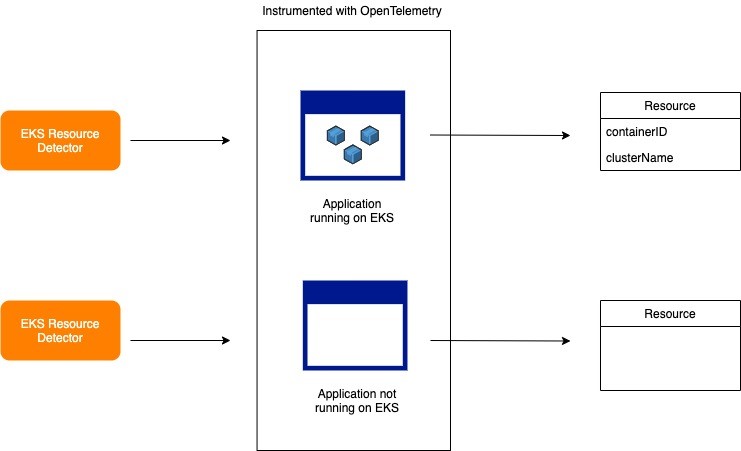
Building the Amazon EKS Resource Detector
One of the enhancements I built was the Amazon EKS Resource Detector. (Having familiarity with Amazon EKS is helpful for understanding what Amazon EKS Resource Detector is.) Amazon EKS is a fully managed Kubernetes service that allows us to run, deploy, and monitor Kubernetes processes on AWS without needing to manage or install Kubernetes.
Note: The full source code for the EKS detector can be found on GitHub.
A resource detector is used to capture metadata specific to the environment that the application producing telemetry data is running on (for example, ECS, EKS, EB, among others). The Amazon EKS Resource Detector checks whether the current application is running on a Kubernetes process or not. As seen in the diagram, if Amazon EKS Resource Detector is running on Amazon EKS, it will return a resource about the cluster name and container; otherwise it will return an empty resource. You may find it useful to utilize the Amazon EKS Resource Detector if you host your applications or services on Amazon EKS and want to identify the container that had the root cause of failure, which will significantly reduce debugging time.
Preparing the repository
Because OpenTelemetry is an open source project and some of the components are hosted on separate AWS maintained repositories, I had to prepare the repositories to be set up for anyone to be able to contribute to the source code and easily be able to develop, build, and test changes.
I documented all the components that have already been built so that the functionality and usage could be understood clearly and quickly. I also built out the three CI/CD pipelines using GitHub Actions to automate the builds, tests, and releases. These pipelines are described in the following diagram.
Pull request (PR) build
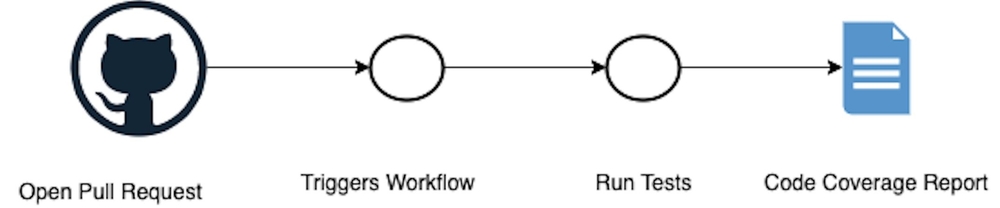
As illustrated in the diagram, a pull request build pipeline is a workflow that is triggered on each pull request to the main branch. All of the packages are then built for three operating systems: macOS, Linux (Ubuntu), and Windows. The workflow triggers all the unit tests and outputs a code coverage report of the tests. It then highlights whether or not they were successful. The steps that I just described comprise the integration pipeline I set up. This pipeline was crucial to ensure that when any new pull requests are made, it doesn’t break any current components in the project.
Main build
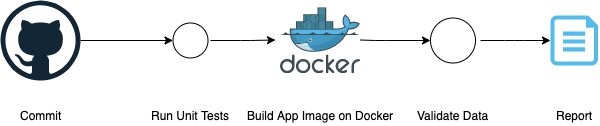
As the diagram shows, the main build pipeline is a workflow triggered on each commit to the main branch. Similar to the PR build, the main build runs all the unit tests and builds a Docker image of a sample application instrumented with newly implemented AWS components. This is important to validate that the trace data is received on AWS X-Ray and that the segments consist of the expected values. The validation is done through the AWS Observability test framework and outputs the results of all the tests. This pipeline is crucial to ensure that any commits to the main branch don’t break the individual components and checks that the entire project still has end-to-end support for sending traces to AWS X-Ray.
Release build
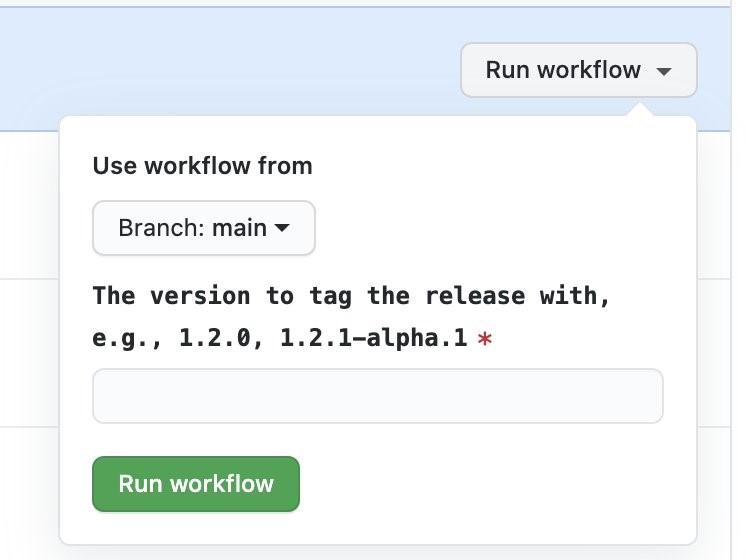
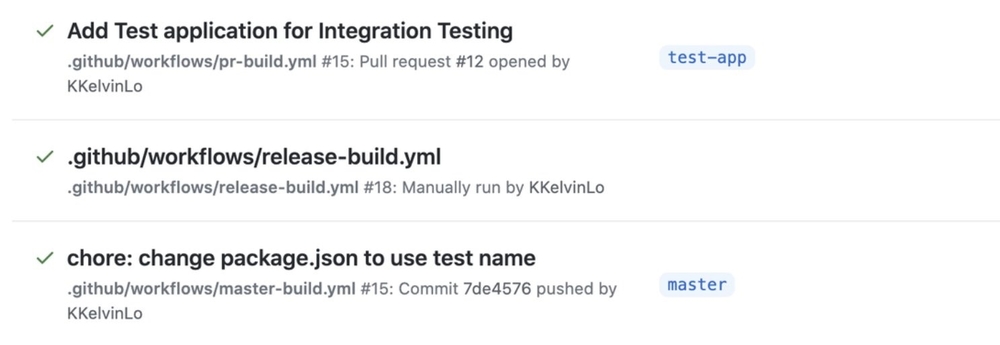
The release build can be run manually in the GitHub actions of the repository. In JavaScript, dependencies are imported through npm packages. We published our packages to npm so that any user can install the dependency locally. What this workflow does is it publishes all our packages to npm, bumps the versions, and creates a new GitHub release with the inputted version. This is crucial as it removes the need to create manual releases and manually publish packages, greatly improving the developer experience. After these workflows are live, the Actions tab on the GitHub repository will display the previous runs and status of the workflows.
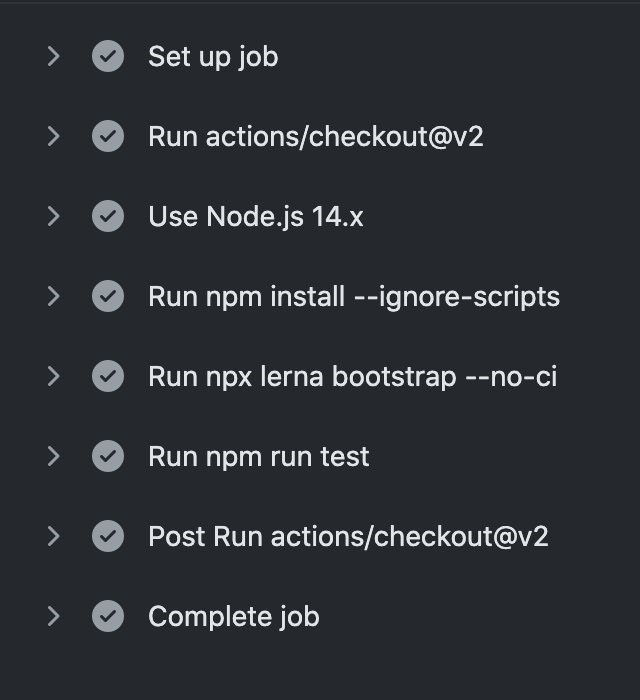
If you wanted to see more about what the workflow does without stepping through the YAML files, a click into the specific workflow will display the steps that were run as shown in the preceding image. I ensured that the newly implemented workflows were passing and each job is running successfully.
Testing tools
I used several different tools for testing, including nock, sinon, and Benchmark.js. I chose to use nock and sinon as they are commonly used libraries for stubbing and mocking the environment where file reads and HTTP calls may not be useful unless it is in the environment itself. I also used Benchmark.js to mark the average latency per method of each component over a large number of iterations.
Nock
Nock is an expectations library for Node.JS that is used for HTTP server mocking. For example, on the Amazon EKS Resource Detector, it makes an HTTP request to grab the cluster name of the Kubernetes process. However, in unit testing we haven’t actually instrumented an application and hosted it on a Kubernetes process, so I had to mock the individual HTTP calls.
The following code shows an example of mocking any calls to the Kubernetes API:
Sinon
Sinon makes stubbing methods easier in JavaScript. For example, on the Amazon EKS Resource Detector, it has to check whether the Kubernetes token path and the certificate path exist in order to determine whether a process is running on Kubernetes process. However, being on a Kubernetes environment in unit testing is not possible, so we will need to stub these methods.
The following code shows an example of stubbing a method:
Benchmark.js
Benchmark.js simplifies micro-benchmark testing on different components and their methods. All we have to do is wrap the component around the declared object and call its methods. This is quite useful to determine the performance capabilities of each component.
The following piece of code shows an example of benchmarking the trace ID generation method:
The output we get when running this specific benchmark looks something like the following:
Future enhancements
Adding sample apps for popular frameworks
Currently, the repository has one sample application that demonstrates the instrumentation of an HTTP application. I’d like to add more sample applications for instrumenting popular frameworks to offer an easier getting started experience.
Adding pre-configured instrumentation
Currently, there is a getting started guide to instrument an application to start producing telemetry data and sending it to AWS X-Ray. In the future, I’d like to add a pre-configured tracer to instrument applications with minimal set up time for a simpler out-of-the-box experience.
Conclusion
During the course of this project, I learned a lot about working in a large open source project community and participated in two releases of the AWS Distro for OpenTelemetry. By working on this project, I learned that a huge part of software development isn’t just coding. In fact, coding is only a small chunk of the work, the majority consists of communicating, validating ideas, gathering requirements, researching, and consolidating designs based on iterative feedback. This project also helped me take ownership for a variety of tasks: writing CI/CD pipelines, components, technical documentation, and solving issues other engineers have filed. I collaborated with a lot of AWS engineers, open source maintainers, and other contributors. Luckily, everyone I’ve worked with so far was amazing in communication and fun to collaborate with. Overall, working on OpenTelemetry offered a great entry point into my first open source community and I hope to continue contributing to many similar open source projects in the future.
References
- AWS Distribution for OpenTelemetry
- OpenTelemetry
- Getting started with OpenTelemetry JS for AWS X-Ray
- AWS X-Ray
- Workflows

Kelvin Lo
Kelvin Lo is a senior majoring in computer science at the University of British Columbia. He is currently working as a software engineer intern at AWS and is interested in observability and infrastructure.
The content and opinions in this post are those of the third-party author and AWS is not responsible for the content or accuracy of this post.