AWS Storage Blog
Storage for I/O-intensive SQL Server using Amazon EBS io2 Block Express
If you’ve tried to optimize Amazon EBS performance for your SQL Server workload before, you may have come across this blog post from late 2019. Until December 2020, with SQL Server workloads that required more than 80,000 IOPS or 2,375 MB/s of throughput, your only high-performance option was an NVMe-powered Amazon EC2 instance store. These particular EC2 instance types definitely solve the performance demands but lack the availability, durability, flexibility, and scalability of EBS, not to mention the benefits of EBS snapshots. This led to a compromise for database administrators (DBAs), because it required them to custom build high availability (HA), disaster recovery (DR) solutions similar to on-premises. Imagine being a technical architect limited by two of the three requirements: performance, simplicity, or resiliency. In short, if your database system required more than 80 K IOPS or 2,375 MB/s of throughput, you had to give up many benefits that you love about Amazon EBS and the cloud in general.
We have great news – now there’s no need to compromise your cloud database experience! On July 19 2021, we announced general availability for a new storage class: Amazon io2 Block Express. Using io2 Block express, you can design single-volume storage subsystem that can scale up to 256,000 IOPS, 4,000 MB/s of throughput, and 64 TB per single volume in storage. This means you can now significantly simplify the overall architecture when you require enterprise-class IOPS and throughput performance in addition to durability and scale.
In this blog post, we compare how the new EBS storage type compares against existing storage options from the performance point of view. We also draw conclusions regarding appropriate use cases.
General-purpose Amazon EBS storage decision tree
For context, a general-purpose storage decision tree for Amazon EBS looks like the following figure:

AWS designed io2 Block Express to be a significant leap in performance over the previous generation. The goal is to provide consistently low latency for I/O-intensive applications. The improvements in io2 Block Express compliment the overall cloud benefits of scalability, elastic on-demand capacity, and low cost. To accomplish it, AWS built a brand new network transport protocol, scalable reliable datagram (SRD). Overall, SRD differs from protocols like TCP, InfiniBand, or RoCE. Instead of preserving packets order, SRD sends the packets over as many network paths as possible, while avoiding overloaded I/O paths. When parallelism in the network causes packet arrival out-of-order, SRD leaves the message order restoration to the upper layer, because it has a better understanding of the required ordering semantics. Essentially, SRD is an evolution of auto-configured multi-path I/O (MPIO), and DBAs do not have to provision trunking and failover connectivity because SRD handles this automatically. To minimize jitter and to ensure the fastest response to network congestion fluctuations, SRD is implemented in the AWS custom Nitro networking card.
Why choose R5b instances to implement io2 Block Express?
The Amazon EC2 instances that provide the highest Amazon EBS-optimized performance are R5b instances. Therefore, we are first offering io2 Block Express with R5b, with support for other instances coming soon. R5b is our latest addition to the R5 family that we launched on December 1, 2020. The new R5b instance is powered by the AWS Nitro System to provide the best network-attached storage performance available on EC2. The largest instance type r5b.24xl offers up to 7,500 MB/s of EBS bandwidth and 260,000 I/O operations per second (IOPS).
Now that we have good understanding of the architecture and design goals, let’s run some benchmarking tests.
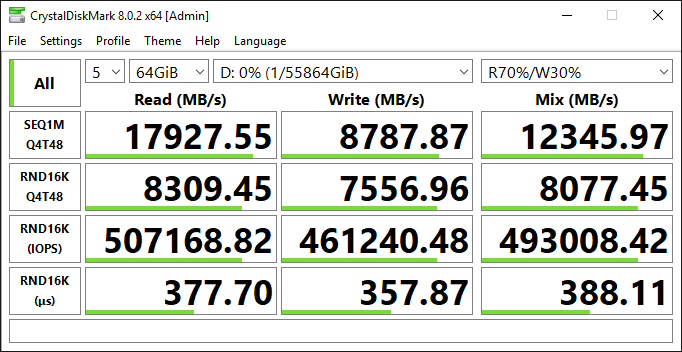
First, we run the micro-benchmarking tool CrystalDiskMark to test the storage subsystem and see actual delivered IOPS, throughput, and latency. CrystalDiskMark helps to accurately measure the rate of transfer or the transfer speed under various disk access scenarios (sequential, random 8K, deep queue depth, etc.). It is also important to know that our goal wasn’t to match I/O patterns for the SQL workload, but rather to see how the storage subsystem responds to the load.
We choose the default profile for Peak Performance (Mix), with 70% read and 30% write for each of our test configurations. We also adjusted the thread counts to match CPU cores available for both sequential and random workloads. Looking at the CrystalDiskMark results, further questions may arise as to why we use 48 threads on 96 cores 24xl instance. We ran multiple rigorous tests increasing the thread counts, queue size, and I/O size for both sequential and random workloads. We observed that the performance in the test configured at 48 threads was sufficient enough to reach max IOPS and max throughput.
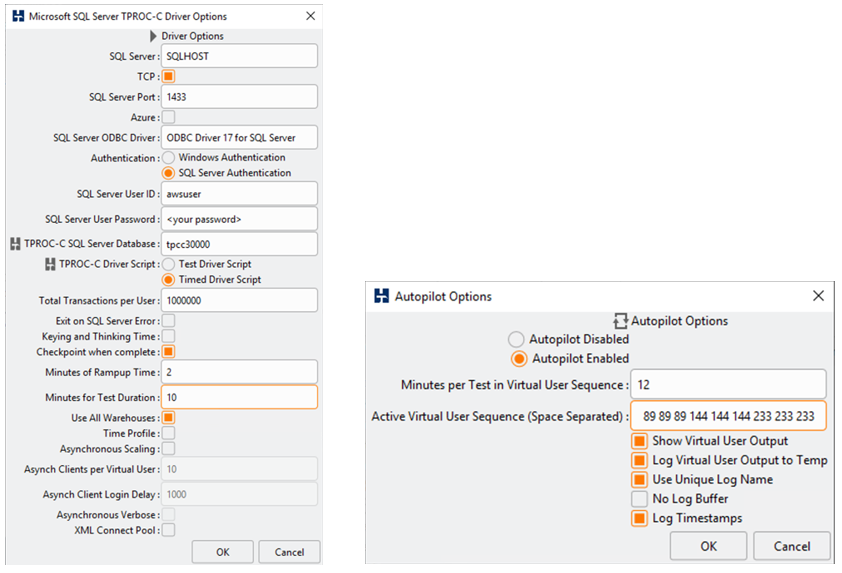
To simulate a database workload, we use HammerDB, a very popular OLTP benchmarking tool creating database for 30,000 Data warehouses that translates into 3 TB in size.
For SQL Server configuration:
We used Amazon’s license-included Microsoft Windows Server 2019 with SQL Server 2019 Enterprise (AMI 08ad9723b46fc961e) in the AWS Ohio Region (us-east-2).
Select @@version output:
Microsoft SQL Server 2019 (RTM-CU10) (KB5001090) – 15.0.4123.1 (X64) Mar 22 2021 18:10:24 Copyright (C) 2019 Microsoft Corporation Enterprise Edition: Core-based Licensing (64-bit) on Windows Server 2019 Datacenter 10.0 <X64> (Build 17763: ) (Hypervisor)
Generating test database and data
To generate Microsoft SQL Server OLTP test data, we use HammerDB Release 4/1 for Windows 64-bit Installer.

To get the best results, we optimized the database with the script “tpcc_optimize.sql,” which altered certain row and page locking settings. It also modified certain stored procedures with the aim of improving OPM results for any solution running the benchmark. For more information, refer to the section “Optimizing the database” of the performance report by Principled Technologies. Apart from this optimization, we followed the general best practices for benchmarking. For instance, we kept the database in simple recovery mode, setting MAXDOP to 1, and set max memory appropriately to leave some memory behind for the OS. In our case, we chose to leave 10 GB for the operating system.
How did we run the test?
We used the autopilot feature sampling three times, and each runs with number of virtual users configured (34, 55, 89, 144, 233 users).
Now that we are all set, let’s stress test!
We all understand that the key storage performance metrics for storage subsystem are throughput, IOPS, and latency. It is also important to know the limits for both max IOPS and max throughput at different Amazon EC2 instance and Amazon EBS volume level. In our test environment, we chose to stress test against the largest instance types of the R5, R5b, and I3en instance families. The following table explains configurations and limits associated with them.
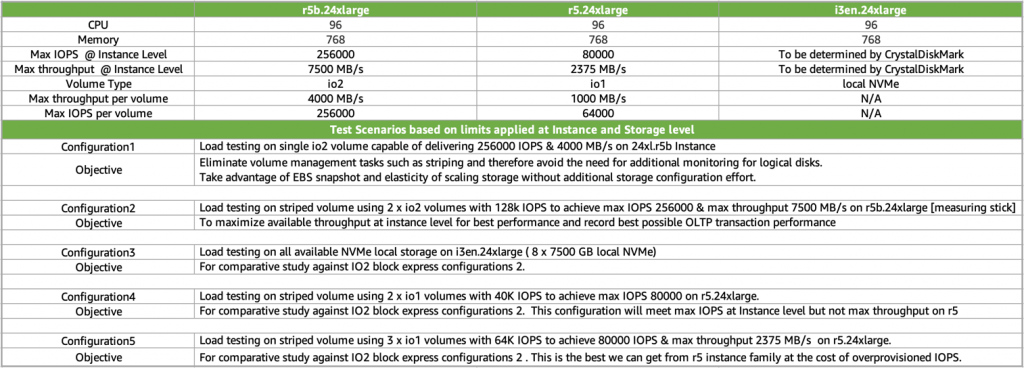
Configuration #1: R5b maximum IOPS (r5b.24xl, single io2 Block Express volume)
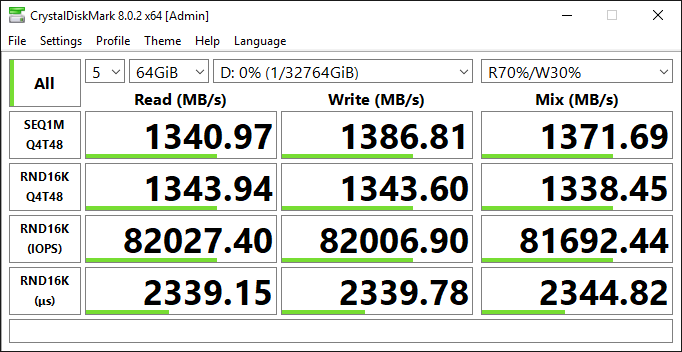
We start with testing baseline performance. We take the largest instance (24xl) of the new type R5b, capable of 260,000 IOPS, and attach a single 64 TB io2 Block Express volume, scaling it to 256,000 IOPS. However, what about throughput? Well, an r5b.24xl instance is capable of 7,500 MB/s, but a single io2 Block Express volume tops off at 4,000 MB/s, which means that this configuration will only provide 4,000 MB/s. Therefore, under a real workload, unless your I/O size is small, you’re probably going to hit the 4,000-MB/s limit way before you reach the 256,000 IOPS limit. The following is the output of the CrystalDiskMark for this storage subsystem. We get exactly what we expected, just a little over 4,000 MB/s and 260,000 IOPS with sub-millisecond latency.
Now, to do some math, remember that transfer size x IOPS = throughput or throughput / IOPS = transfer size. So, 4,000 MB/s / 260,000 IOPS = 16K, which means that if your I/O is 16,000, it will take all 260,000 IOPS to hit the 4,000-MB/s limit. The reality is that MS SQL Server is good at issuing very large I/O (much larger than 16,000), and by doing so greatly reduces the number of required IOPS. Transaction log writes can be anywhere between 512 bytes and 60 KB, but something like Backup/Restores can be up to 1 MB, and ColumnStore reads can be up to 8 MB in size. The point of all of that is to show that it is unlikely to see a SQL Server workload that averages a 16-K transfer size. This means that a typical workload will hit the 4,000-MB/s limit way before it hits the 260,000 IOPS limit. Therefore, you would choose this very simple, straightforward setup, only if your workload does not require more than 4,000 MB/s of throughput, which will be rare. In most cases, for SQL Server workloads, you would want to maximize the throughput, and that brings us to configuration #2.

Configuration #2: R5b maximum IOPS and throughput (r5b.24xl, RAID 0 over two io2 Block Express)
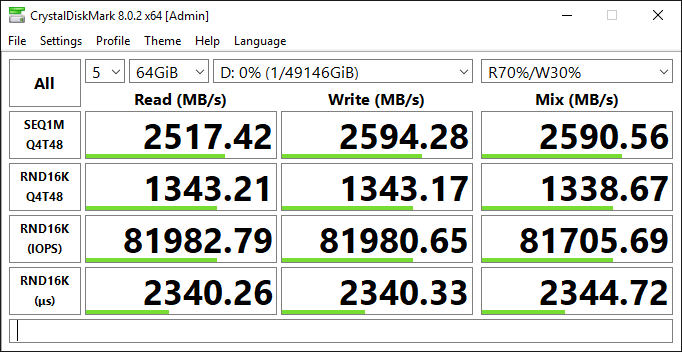
Now, let us try to maximize both IOPS and throughput. To do that, we provision two io2 Block Express volumes and build RAID 0 over them. To remind you, final number of IOPS of a RAID 0 equals to SUM total of IOPS of all underlying volumes; exactly same logic applies to throughput. Since r5b.24xl tops at 256,000 IOPS and 7,500 MB/s, we must get, at least, half of that from a single volume. If we provision a single volume at 128,000 IOPS, math is going to work just right. Therefore, end-to-end, it should give us full instance-level limit of 260,000 IOPS and 7,500 MB/s. CrystalDiskMark (following screenshot) shows that the actual delivered performance is even a little better (~7,800 MB/s and a little over ~262,000 IOPS). This configuration provides the same number of IOPS and twice the throughput of configuration #1. Obviously, latency is identical to that of configuration #1. It is important to call out a possibility for cost optimization here. In this test, we are maximizing both IOPS and throughput but majority of SQL Server workloads are throughput-constraint. So, with a large I/O transfer (>256,000) load, io2 throughput tops at 16,000 IOPS. It is very possible that you can scale down the number of IOPS (and reduce cost) without reducing the throughput and affecting your workload negatively.

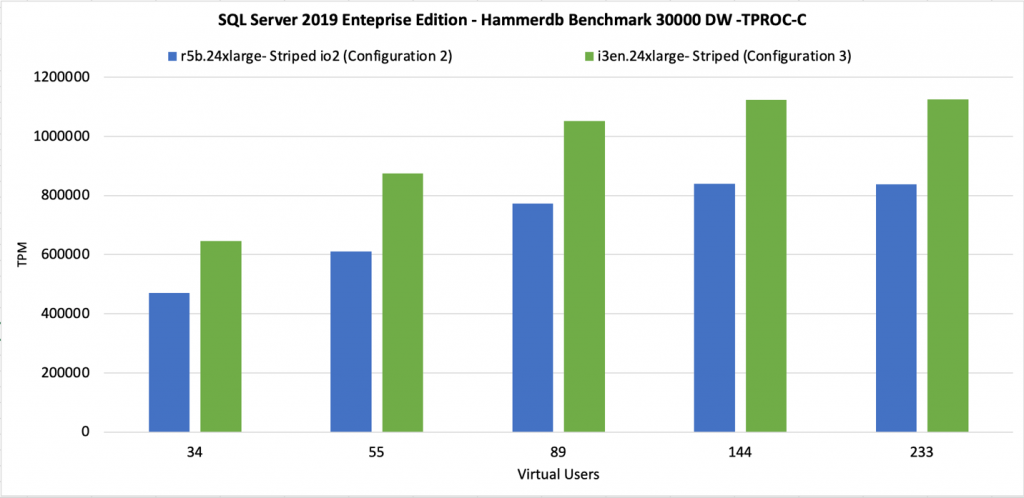
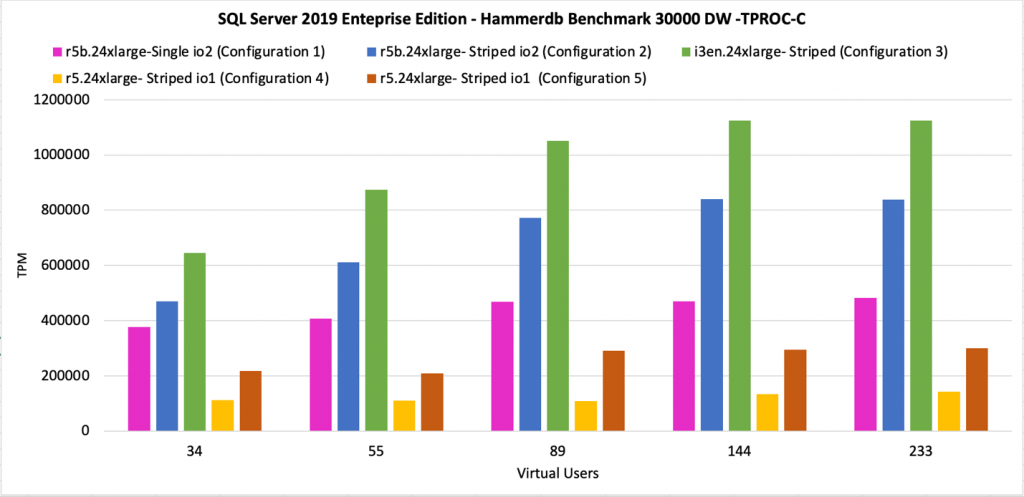
Now, let us compare our HammerDB numbers. What we can conclude looking at this chart is that as we increase the number of virtual users, the workload becomes more and more throughput-constrained. That explains why configuration #2 is doing roughly twice the number of transactions-per-minute (TPM) delivered by configuration #1. You would choose this setup for most of the SQL Server I/O-demanding workloads, workloads that can benefit from full instance level throughput capacity of 7,500 MB/s.

Configuration #3: Local ephemeral NVMe (i3en.24xl, RAID 0 over eight NVMe volumes)
If you are coming from the on-premises world where you have very fast SANs, instance store was pretty much the only option. Let us see how new R5b instance type and io2 Block Express compare against it. We take our storage-optimized i3en.24xl instance with the same amount of vCPU and RAM (96 vCPU, 768 GB) as before, which comes with eight 7.5 TB locally attached Non-Volatile Memory express (NVMe) SSD cards. RAID 0 over them will give us a single volume of close to 60 TB. Number of IOPS and throughput are limited by local NVMe only. Looking at the CrystalDiskMark output (following screenshot), an interesting observation is that read throughput is more than double that of configuration #2 (~18,000 MB/s), but write throughput is just a little higher (~8,700 MB/s). So, then under mixed load (70% Read, 30% write) it is ~12,000 MB/s. The fact that write operations bear heavier weight than reads in SSDs is well known. That is an important observation – your read/write distribution can significantly influence that actual delivered throughput. Interesting to note that EBS-based storage subsystems do not exhibit the same behavior. You can look at any of the CrystalDiskMark outputs and you will see that Read throughput and write throughput are the same for any of the EBS-base subsystems. Amazon EBS abstracts that complexity of SSD internal protocols away and delivers exactly the same specification for both reads and writes.
Comparing real SQL Server workload using HammerDB, we see that local NVMe still gives us about 20% more Transactions-per-minute (TPM) than configuration #2. Furthermore, we can hypothesize that the more write-heavy the workload is, the smaller the TPM difference between local NVMe and io2-based subsystems, as write throughputs are very similar (~8,700 vs. ~7,900 MB/s). This option is a trade-off. You would choose this setup, only if 20% TPM performance advantage is critical to your workload and if you are willing to give up scalability, durability of Amazon EBS and ability to use EBS snapshots.
Configuration #4: R5 maximum IOPS (r5.24xl, RAID 0 over two io1 volumes)
For completeness, let us see what we can squeeze out of old friend r5. If anything, it will have great educational value. If we take r5.24xl (same amount of vCPU and RAM as r5b.24xl and i3en.24xl) that will give us 80,000 IOPS and 2,375 MB/s of throughput. In order to match the IOPS, we are going to need two io1 volumes, provisioned at 40 K IOPS. To match the instance level throughput limit, we are going to need (at least) three io1 volumes (1,000 MB/s x 3 = 3,000 MB/s) provisioned at max IOPS. Again, let us test both, first with RAID 0 over two io1 volumes to maximize IOPS, this configuration should give us 80,000 IOPS and close to 1,300 MB/s end-to-end. Again, CrystalDiskMark agrees with us.
The difference between this setup and our “measuring stick” (configuration #2) is roughly 6x (140 K vs. 820 K TPM). This makes sense since configuration #2 delivers roughly 6x the throughput (1,300 vs 7,900 MB/s). To be clear, with io2 having higher throughput per volume, which reduces the number of volumes, and higher throughput per Provisioned IOPS, which reduces cost despite increased durability, we see no good use cases for io1-based storage subsystems anymore. This and the following test prove that. If you currently run your workload on r5 and io1, you should definitely pay close attention to this graph and next one and consider switching to io2.

Configuration #5: R5 maximum IOPS and throughput (r5.24xl, RAID 0 over three io1 volumes)
Here we test the same configuration as configuration #4, but with RAID 0 over three io1 volumes to maximize IOPS and throughput (80 K IOPS and 2,375 MB/s). It is important to call out a possibility for cost optimization here. Since R5 tops at 2,375 MB/s but we provisioned 3 x 1,000 MB/s = 3,000 MB/sec, we overprovisioned 625 MB/s of throughput that cannot be realized because of the instance-level limit. Feel free to experiment and scale down your io1 volumes to arrive at 2,375 MB/sec combined instead of 3,000 MB/s.
As expected, configuration #5 delivers 2x greater TPM than configuration #4 (300 K vs. 150 K), and slightly more than a third of configuration #2 (300 K vs. 820 K). These totals are all in-line with both theoretical and empirical numbers. This proves once again that because io2 has higher throughput per volume and higher throughput per provisioned IOPs, we see no good use cases for io1-based storage subsystems anymore. If you currently run your workload on R5 and io1, you should consider switching to io2.

The following is the consolidated view of CrystalDiskMark results ran against all seven configurations capturing max IOPS and throughput attainable. And we can clearly see the impact of these results in the HammerDB OLTP performance results.

For ease of comparison, all in one chart.
Conclusion
We are excited to see io2 Block Express as a well-rounded high-performance EBS volume type for the majority of demanding Microsoft SQL Server workloads. io2 Block Express provides durability, scalability, and elasticity of cloud native service with near local instance store performance!
To summarize:
- If you run your workload on locally attached NVMe (either on-premises or on EC2):
We see io2 Block Express based storage subsystem performs within 20% of ephemeral instance store-based subsystem. We have every reason to believe that for write-heavy workloads, that number is smaller; as explained in the section. If this 20% performance advantage of EC2 instance store is for a workload that does not require the durability and functionality of EBS, then continue with instance store.
- If you run your workload on r5 and io1:
We see that io2-based storage subsystem delivers almost 3x the io1-based TPM performance. In addition, it has higher throughput per volume, which reduces number of volumes, has higher throughput per Provisioned IOPS, which reduces cost and has higher durability. Therefore, we see no good use cases for io1-based storage subsystems anymore!
Thanks for reading this blog post! If you have any comments or questions, feel free to leave them in the comments section.