AWS Big Data Blog
Monitor Spark streaming applications on Amazon EMR
For applications to be enterprise-ready, you need to consider many aspects of the application before moving to a production environment and have operational visibility of your application. You can get that visibility through metrics that measure your application’s health and performance and feed application dashboards and alarms.
In streaming applications, you need to benchmark different stages and tasks in each stage. Spark has provided some interfaces to plug in your probes for real-time monitoring and observation of your applications. SparkListeners is a flexible and powerful tool for both steaming and batch applications. You can combine it with Amazon CloudWatch metrics, dashboards, and alarms for visibility and generate notifications when issues arise or automatically scale clusters and services.
This post demonstrates how to implement a simple SparkListener, monitor and observe Spark streaming applications, and set up some alerts. The post also shows how to use alerts to set up automatic scaling on Amazon EMR clusters, based on your CloudWatch custom metrics.
Monitoring Spark streaming applications
For production use cases, you need to plan ahead to determine the amount of resources your Spark application requires. Real-time applications often have SLAs that they need to meet, such as how long each batch execution can safely run or how long each micro-batch can be delayed. Quite often, in the lifecycle of an application, sudden increases of data in the input stream require more application resources to process and catch up with the influx.
For these use cases, you may be interested in common metrics such as the count of records in each micro-batch, the delay on running scheduled micro-batches, and how long each batch takes to run. For example, in Amazon Kinesis Data Streams, you can monitor the IteratorAge metric. With Apache Kafka as a streaming source, you might monitor consumer lag, such as the delta between the latest offset and the consumer offset. For Kafka, there are various open-source tools for this purpose.
You can react in real time or raise alerts based on environment changes by provisioning more resources or reducing unused resources for cost optimization.
Different methods to monitor Spark streaming applications are already available. A very efficient, out-of-the-box feature of Spark is the Spark metrics system. Additionally, Spark can report metrics to various sinks including HTTP, JMX, and CSV files.
You can also monitor and record application metrics from within the application by emitting logs. This requires running count().print(), printing metrics in maps and reading the data that may cause delays, adding to the application stages, or performing unwanted shuffles that may be useful for testing but often prove to be expensive as a long-term solution.
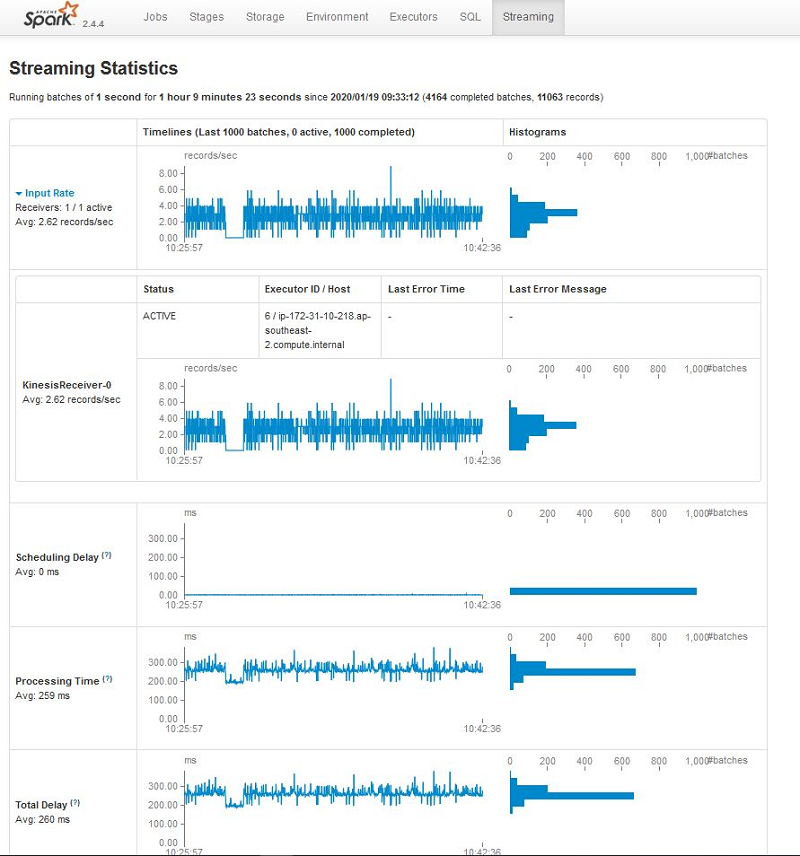
This post discusses another method: using the SparkStreaming interface. The following screenshot shows some available metrics on the Spark UI’s Streaming tab.
Apache Spark listeners
Spark internally relies on SparkListeners for communication between its internal components in an event-based fashion. Also, Spark scheduler emits events for SparkListeners whenever the stage of each task changes. SparkListeners listen to the events that are coming from Spark’s DAGScheduler, which is the heart of the Spark execution engine. You can use custom Spark listeners to intercept SparkScheduler events so you know when a task or stage starts and finishes.
The Spark Developer API provides eight methods in the SparkListener trait called on different SparkEvents, mainly at start and stop, failure, completion, or submission of receivers, batches, and output operation. You can execute an application logic at each event by implementing these methods. For more information, see StreamingListener.scala on GitHub.
To register your custom Spark listener, set spark.extraListeners when launching the application, or programmatically by calling addSparkListener when setting up SparkContext in your application.
SparkStreaming micro-batches
By default, SparkStreaming has a micro-batch execution model. Spark starts a job in intervals on a continuous stream. Each micro-batch contains stages, and stages have tasks. Stages are based on the DAG and the operation that the application code defines, and the number of tasks in each stage is based on the number of DStream partitions.
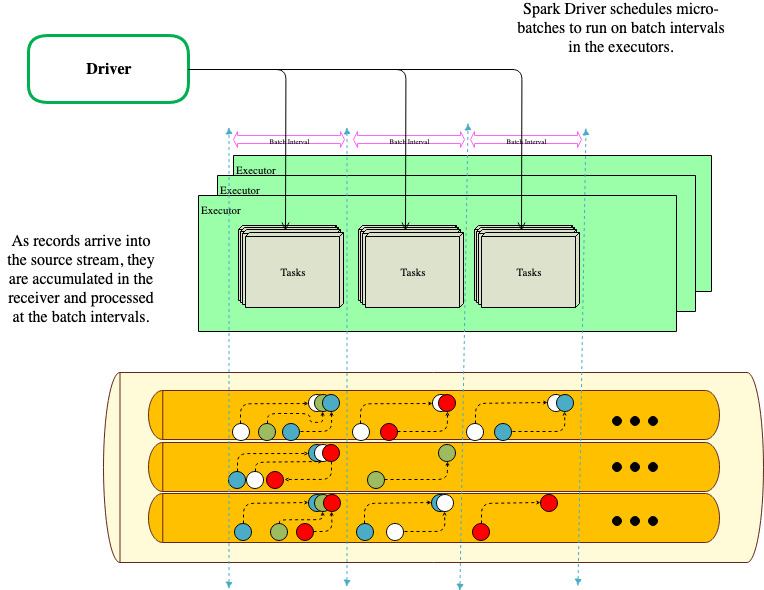
At the start of a streaming application, the receivers are assigned to executors, in a round-robin fashion, as long-running tasks.
Receivers create blocks of data based on blockInterval. The received blocks are distributed by the BlockManager of the executors, and the network input tracker running on the driver is informed about the block locations for further processing.
On the driver, an RDD is created for the blocks in each batchInterval. Each block translates to a partition of the RDD and a task is scheduled to process each partition.
The following diagram illustrates this architecture.
Creating a custom SparkListener and sending metrics to CloudWatch
You can rely on CloudWatch custom metrics to react or raise alarms based on the custom Spark metrics you collect from a custom Spark listener.
You can implement your custom streaming listeners by directly implementing the SparkListener trait if writing in Scala, or its equivalent Java interface or PySpark Python wrapper pyspark.streaming.listener.
For this post, you only override onBatchCompleted and onReceiverError because you’re only collecting metrics about micro-batches.
From OnBatchCompleted, you submit the following metrics:
- Heartbeat – A numeric 1 (one) whenever a batch completes so you can sum or average time periods to see how many micro-batches ran
- Records – The number of records per batch
- Scheduling delay – The delay from when the batch was scheduled to run until when it actually ran
- Processing delay – How long the batch execution took
- Total delay – The sum of the processing delay and scheduling delay
From OnRecieverError, you submit a numeric 1 (one), whenever a receiver fails. See the following code:
For the full source code of this example for Scala implementation and a sample Spark Kinesis streaming application, see the AWSLabs GitHub repository.
To register your custom listener, make an instance of the custom listener object and pass the object to the streaming context, in the driver code, using the addStreamingListener method. See the following code:
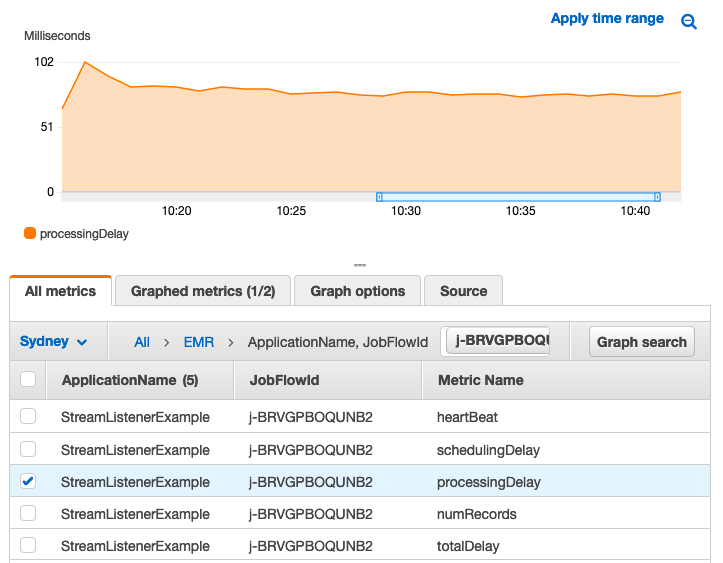
When you run the application, you can find your metrics in CloudWatch in the same account as the one the EMR cluster is running in. See the following screenshot.
Using the sample code
This post provides an AWS CloudFormation template, which demonstrates the code. Download the emrtemplate.json file from the GitHub repo. The template launches an EMR cluster in a public subnet and a Kinesis data stream with three shards with the required default AWS Identity and Access Management (IAM) roles. The sample Spark Kinesis streaming application is a simple word count that an Amazon EMR step script compiles and packages with the sample custom StreamListener.
Using application alarms in CloudWatch
The alerts you need to set up mainly depend on the SLA of your application. As a general rule, you don’t want your batches to take longer than the micro-batch intervals because it causes the scheduled batches to queue and you start falling behind the input stream. Also, if the rate of your receivers reading from the stream is more than what you can process in the batches due to a surge, the read records can spill to disk and cause more delays to shuffle across to other executors. You can set up a CloudWatch alarm to notify you when a processing delay is approaching your application’s batchInterval. For instructions on setting up an alarm, see Using Amazon CloudWatch Alarms.
The CloudFormation template for this post has two sample alarms to monitor. One is based on the anomaly detection band on the processingDelays metric; the second is based on a threshold on a math expression that calculates schedulingDelay ratio to totalDelay or (schedulingDelay / totalDelay) * 100 .
Scaling streaming applications
In terms of scaling, as the amount of data grows, you have more DStream partitions, based on the blockIntervals of the streaming application. In addition to the batches that should catch up with the received records and finish within batch intervals, the receivers should also keep up with the influx of records. The source streams should provide enough bandwidth for the receivers to read fast enough from the stream, and there should be enough receivers reading at the right rate to consume the records from the source.
If your DStreams are backed by receivers and WALs, you need to consider the number of receivers in advance. When you launch the application, the number of receivers may not change without restarting the application.
When a SparkStreaming application starts, by default, the driver schedules the receivers in a round-robin fashion on the available executors unless a preferred location is defined for receivers. When all executors are allocated with receivers, the rest of the required receivers are scheduled on the executors to balance the number of receivers on each executor, and the receivers stay up in the executors as long-running tasks. For more information about scheduling receivers on executors, see ReceiverSchedulingPolicy.scala on GitHub and SPARK-8882 on the Spark issues website.
Sometimes you may want to slow down receivers because you want less data in micro-batches and don’t want to surpass your micro-batch intervals. To slow down receivers, in case you have streaming sources that can hold on to the records when the batches can’t run fast enough to keep up with the surge of records, you can enable the BackPressure feature to adapt to the input rate from receivers. To do so, set spark.streaming.backpressure.enabled to true.
Another factor you can consider is the dynamic allocation for streaming applications. By default, spark.dynamicAllocation is enabled on Amazon EMR, which is mutually exclusive to spark.streaming.dynamicAllocation. If you want the driver to request for more executors for your DStream tasks, you need to set spark.dynamicAllocation.enabled to false and spark.streaming.dynamicAllocation.enabled to true. Spark periodically looks into the average batch duration. If it’s above the scale-up ratio, it requests for more executors. If it’s below the scale-down ratio, it releases the idle executors, preferably those that aren’t running any receivers. For more information, see ExecutorAllocationManager.scala on GitHub and the Spark Streaming Programming Guide.
The ExecutorAllocationManager is already looking into the batch execution average time and requests more executors based on the scale-up and scale-down ratios. Because of this, you can set up automatic scaling in Amazon EMR, preferably on tasks instance groups, to add and remove nodes based on the ContainerPendingRatio and assign PreferredLocation for receivers to core nodes. The example code for this post provides a custom KinesisInputDStream, which allows assigning the preferred location for every receiver you request. It’s basically a function that returns a hostname to preferably place the receiver. The GitHub repo also has a sample application that uses the customKinesisInputDStream and customKinesisReciever, which allows requesting a preferredLocation for receivers.
At scale-down, Amazon EMR nominates the nodes with the fewest containers running for decommissioning in the task instance group.
For more information about setting up automatic scaling, see Using Automatic Scaling with a Custom Policy for Instance Groups. The example code contains a threshold on schedulingDelay. As a general rule, you should base the threshold on the batchIntervals and processingDelay. A growth in schedulingDelay usually means a lack of resources to schedule a task.
The following table summarizes the configuration attributes to tune when you launch your Spark streaming job.
| Configuration Attribute | Default |
spark.streaming.backpressure.enabled |
False |
spark.streaming.backpressure.pid.proportional |
1.0 |
spark.streaming.backpressure.pid.integral |
0.2 |
spark.streaming.backpressure.pid.derived |
0.0 |
spark.streaming.backpressure.pid.minRate |
100 |
spark.dynamicAllocation.enabled |
True |
spark.streaming.dynamicAllocation.enabled |
False |
spark.streaming.dynamicAllocation.scalingInterval |
60 Seconds |
spark.streaming.dynamicAllocation.minExecutors |
max(1,numReceivers) |
spark.streaming.dynamicAllocation.maxExecutors |
Integer.MAX_VALUE |
Monitoring structured streaming with a listener
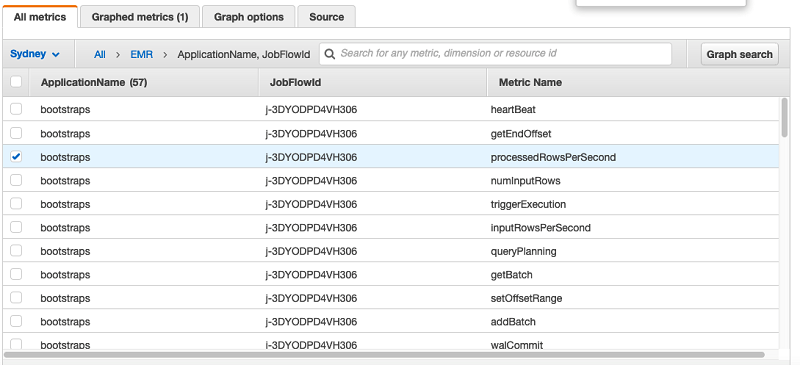
Structured streaming still processed records in micro-batches and triggers queries when there is data from receivers. You can monitor these queries using another listener interface, StreamingQueryListener. This post provides a sample listener for structured streaming on Kafka, with a sample application to run. For more information, see CloudWatchQueryListener.scala GitHub. The following image is a snapshot of few CloudWatch custom metrics the custom StreamingQueryListerer will collect.
Scaling down your EMR cluster
When you launch a Spark streaming application, Spark evenly schedules the receivers on all available executors at the start of the application. When an EMR cluster is set to scale down, Amazon EMR nominates the nodes running fewer tasks in the instance group with an automatic scaling rule. Although Spark receivers are long-running tasks, Amazon EMR waits for yarn.resourcemanager.decommissioning.timeout, or when the NodeManagers are decommissioned, to gracefully terminate and shrink the nodes. You’re always at risk of losing a running executor with a receiver. You should always consider enough Spark block replication and CheckPointing for the DStreams and ideally define a PreferedLocation so you don’t risk losing receivers.
Metrics pricing
In general, Amazon EMR metrics don’t incur CloudWatch costs. However, custom metrics incur charges based on CloudWatch metrics pricing. For more information, see Amazon CloudWatch pricing. Additionally, Spark Kinesis Streaming relies on the Kinesis Client Library, and it publishes custom CloudWatch metrics that also incur charges based on CloudWatch metrics pricing. For more information, see Monitoring the Kinesis Client Library with Amazon CloudWatch.
Conclusion
Monitoring and tuning Spark streaming and real-time applications is challenging, and you must react to environment changes in real time. You also need to monitor your source streams and job outputs to get a full picture. Spark is a very flexible and rich framework that provides multiple options for monitoring jobs. This post looked into an efficient way to monitor the performance of Spark streaming micro-batches using SparkListeners and integrate the extracted metrics with CloudWatch metrics.
About the Author
 Amir Shenavandeh is a Hadoop systems engineer with AWS. He helps customers with architectural guidance and technical support using open-source applications, develops and advances the applications of the Hadoop ecosystem and works with the open source community.