AWS News Blog
New – Amazon CloudWatch Cross-Account Observability

|
Deploying applications using multiple AWS accounts is a good practice to establish security and billing boundaries between teams and reduce the impact of operational events. When you adopt a multi-account strategy, you have to analyze telemetry data that is scattered across several accounts. To give you the flexibility to monitor all the components of your applications from a centralized view, we are introducing today Amazon CloudWatch cross-account observability, a new capability to search, analyze, and correlate cross-account telemetry data stored in CloudWatch such as metrics, logs, and traces.
You can now set up a central monitoring AWS account and connect your other accounts as sources. Then, you can search, audit, and analyze logs across your applications to drill down into operational issues in a matter of seconds. You can discover and visualize metrics from many accounts in a single place and create alarms that evaluate metrics belonging to other accounts. You can start with an aggregated cross-account view of your application to visually identify the resources exhibiting errors and dive deep into correlated traces, metrics, and logs to find the root cause. This seamless cross-account data access and navigation helps reduce the time and effort required to troubleshoot issues.
Let’s see how this works in practice.
Configuring CloudWatch Cross-Account Observability
To enable cross-account observability, CloudWatch has introduced the concept of monitoring and source accounts:
- A monitoring account is a central AWS account that can view and interact with observability data shared by other accounts.
- A source account is an individual AWS account that shares observability data and resources with one or more monitoring accounts.
You can configure multiple monitoring accounts with the level of visibility you need. CloudWatch cross-account observability is also integrated with AWS Organizations. For example, I can have a monitoring account with wide access to all accounts in my organization for central security and operational teams and then configure other monitoring accounts with more restricted visibility across a business unit for individual service owners.
First, I configure the monitoring account. In the CloudWatch console, I choose Settings in the navigation pane. In the Monitoring account configuration section, I choose Configure.

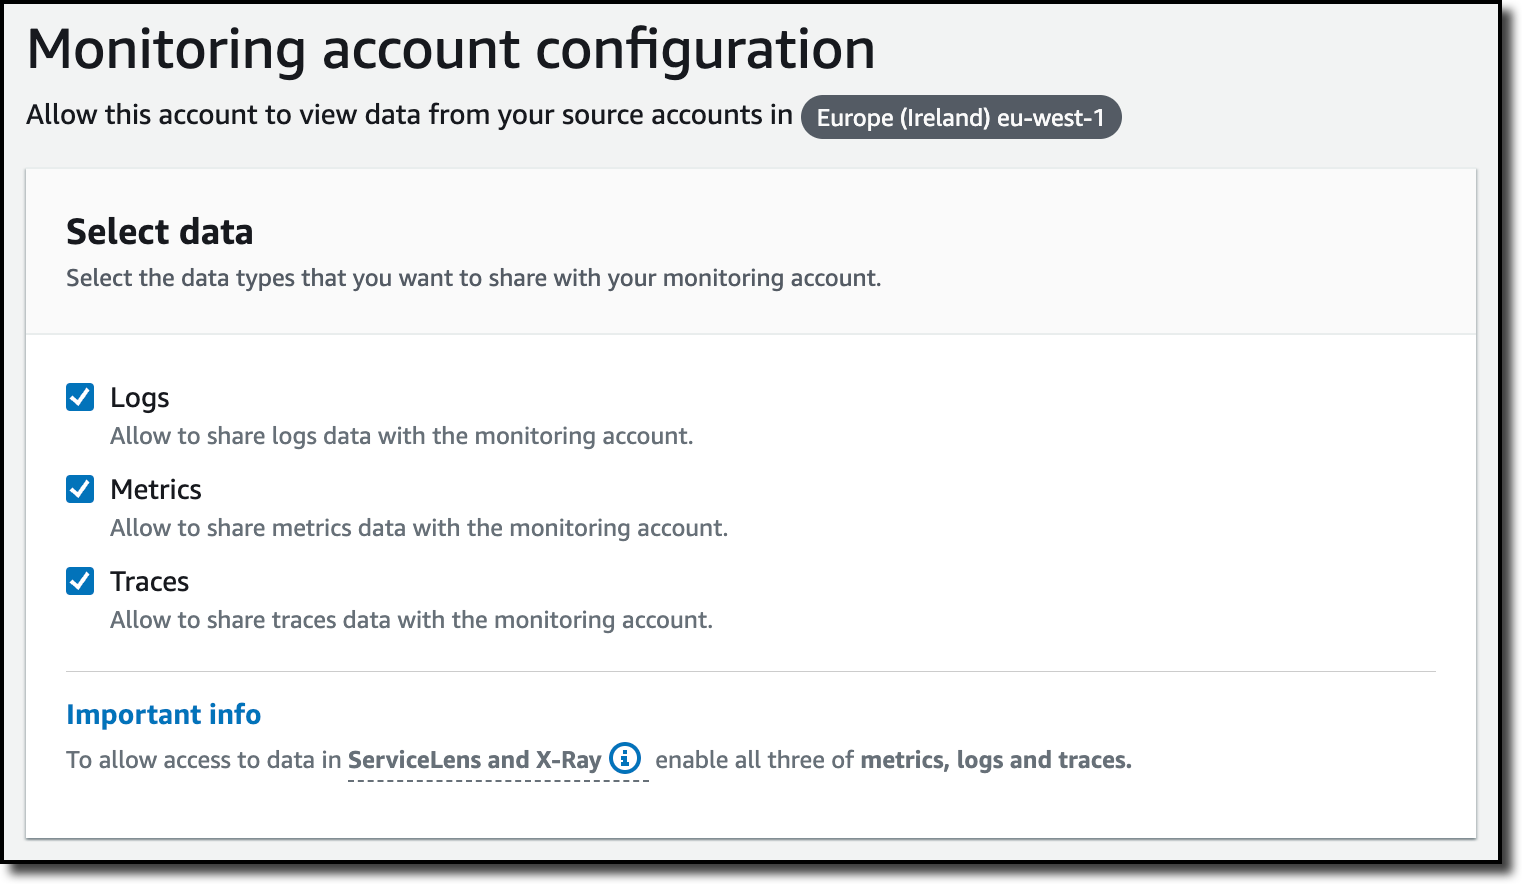
Now I can choose which telemetry data can be shared with the monitoring account: Logs, Metrics, and Traces. I leave all three enabled.
To list the source accounts that will share data with this monitoring account, I can use account IDs, organization IDs, or organization paths. I can use an organization ID to include all the accounts in the organization or an organization path to include all the accounts in a department or business unit. In my case, I have only one source account to link, so I enter the account ID.

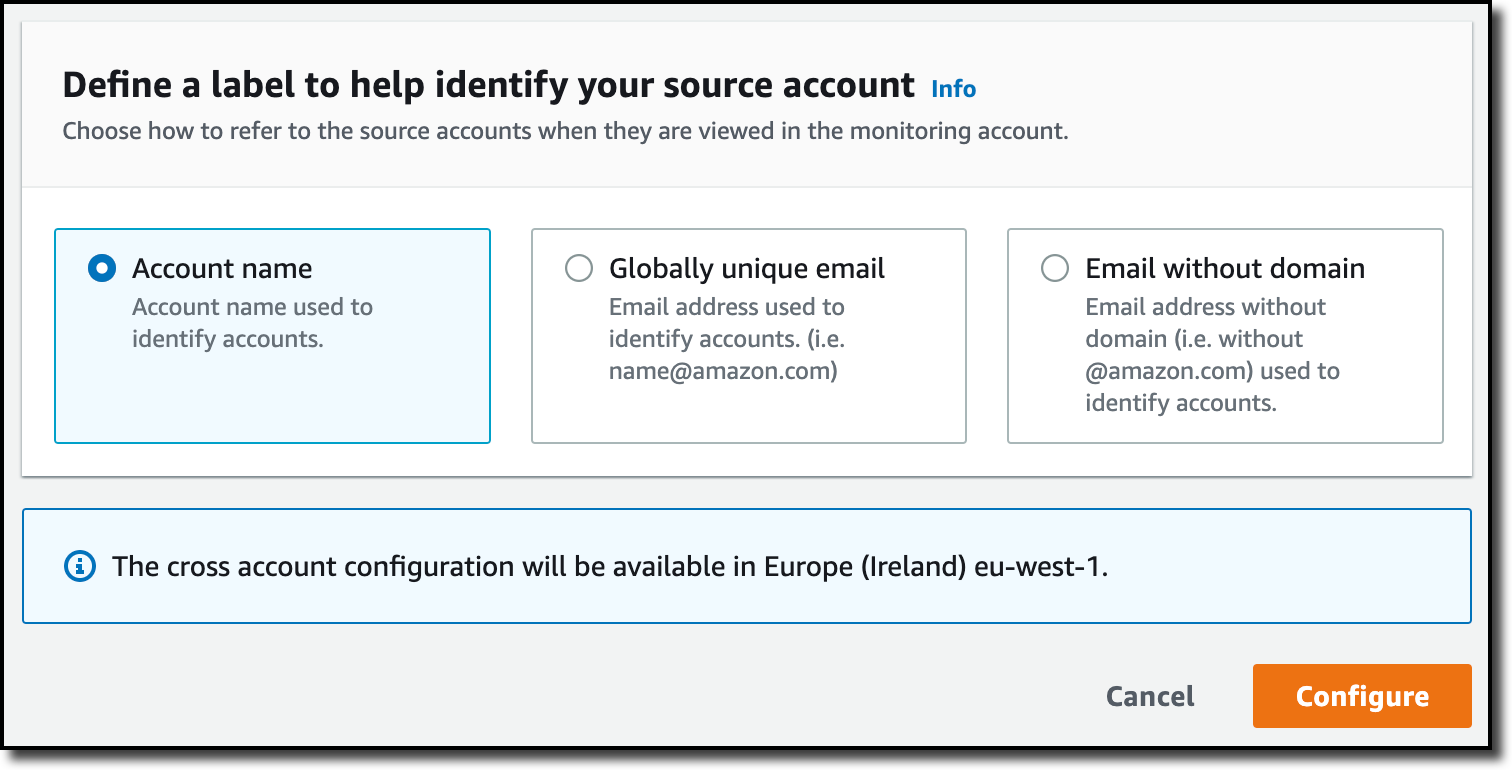
When using the CloudWatch console in the monitoring account to search and display telemetry data, I see the account ID that shared that data. Because account IDs are not easy to remember, I can display a more descriptive “account label.” When configuring the label via the console, I can choose between the account name or the email address used to identify the account. When using an email address, I can also choose whether to include the domain. For example, if all the emails used to identify my accounts are using the same domain, I can use as labels the email addresses without that domain.
There is a quick reminder that cross-account observability only works in the selected Region. If I have resources in multiple Regions, I can configure cross-account observability in each Region. To complete the configuration of the monitoring account, I choose Configure.
The monitoring account is now enabled, and I choose Resources to link accounts to determine how to link my source accounts.

To link source accounts in an AWS organization, I can download an AWS CloudFormation template to be deployed in a CloudFormation delegated administration account.
To link individual accounts, I can either download a CloudFormation template to be deployed in each account or copy a URL that helps me use the console to set up the accounts. I copy the URL and paste it into another browser where I am signed in as the source account. Then, I can configure which telemetry data to share (logs, metrics, or traces). The Amazon Resource Name (ARN) of the monitoring account configuration is pre-filled because I copy-pasted the URL in the previous step. If I don’t use the URL, I can copy the ARN from the monitoring account and paste it here. I confirm the label used to identify my source account and choose Link.
In the Confirm monitoring account permission dialog, I type Confirm to complete the configuration of the source account.
Using CloudWatch Cross-Account Observability
To see how things work with cross-account observability, I deploy a simple cross-account application using two AWS Lambda functions, one in the source account (multi-account-function-a) and one in the monitoring account (multi-account-function-b). When triggered, the function in the source account publishes an event to an Amazon EventBridge event bus in the monitoring account. There, an EventBridge rule triggers the execution of the function in the monitoring account. This is a simplified setup using only two accounts. You’d probably have your workloads running in multiple source accounts.
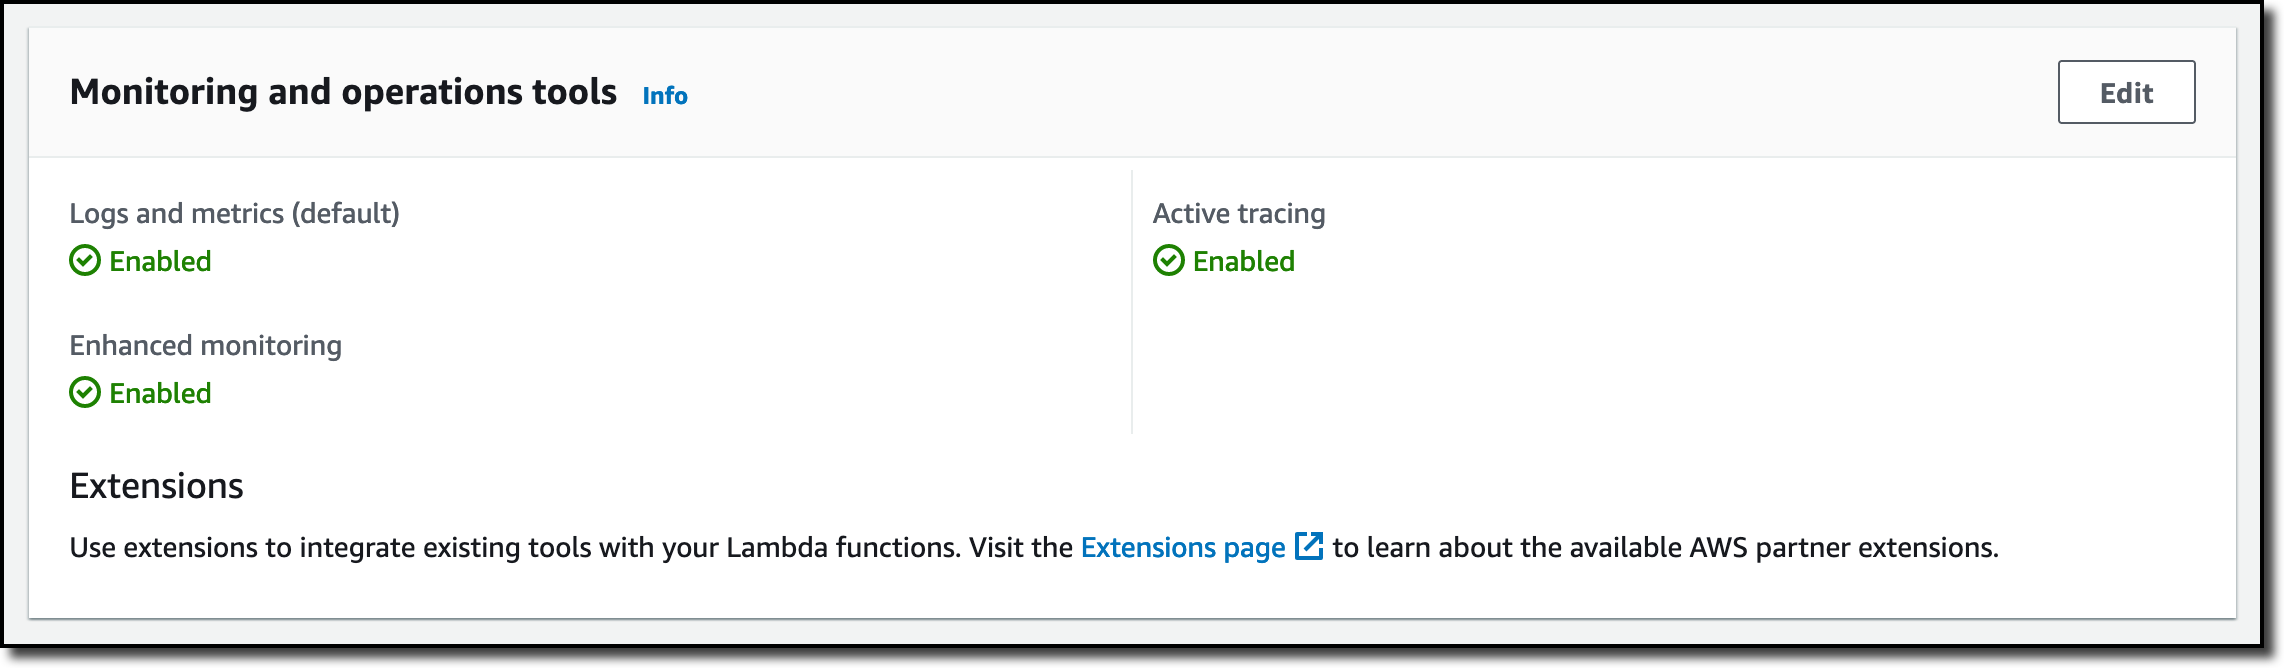
In the Lambda console, the two Lambda functions have Active tracing and Enhanced monitoring enabled. To collect telemetry data, I use the AWS Distro for OpenTelemetry (ADOT) Lambda layer. The Enhanced monitoring option turns on Amazon CloudWatch Lambda Insights to collect and aggregate Lambda function runtime performance metrics.
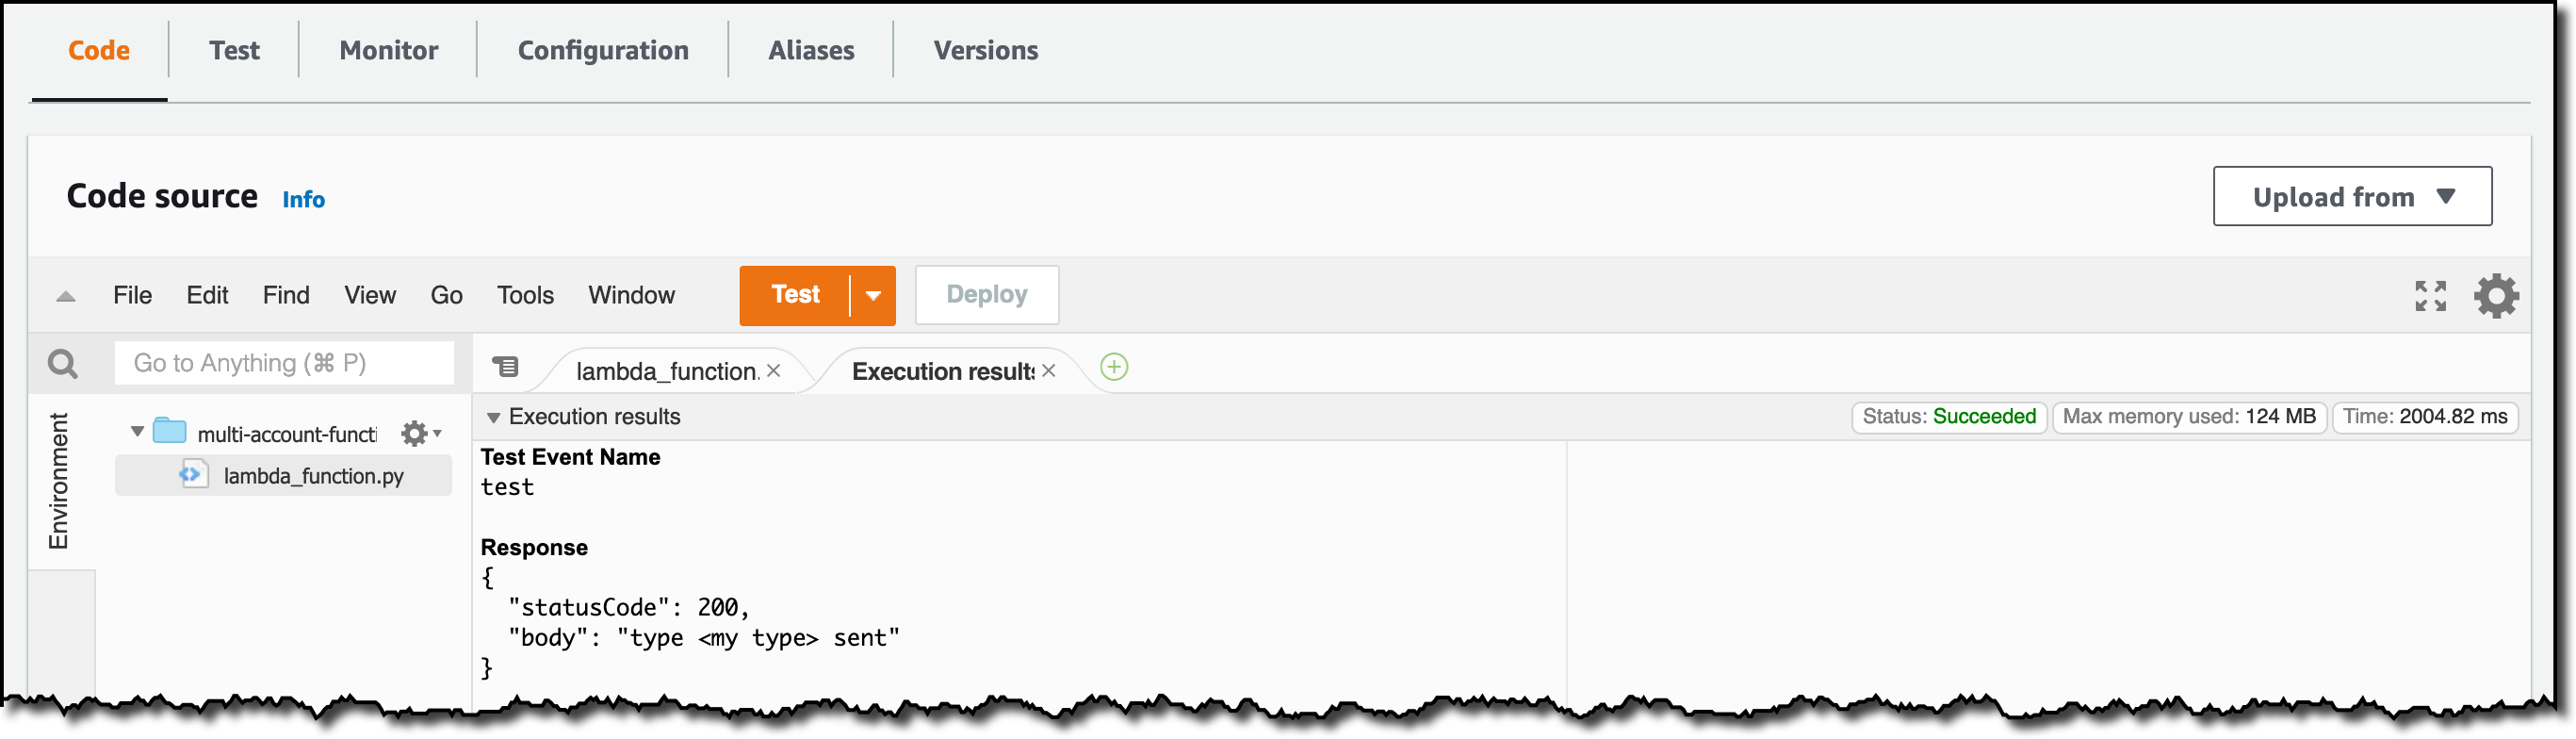
I prepare a test event in the Lambda console of the source account. Then, I choose Test and run the function a few times.
Now, I want to understand what the components of my application, running in different accounts, are doing. I start with logs and then move to metrics and traces.
In the CloudWatch console of the monitoring account, I choose Log groups in the Logs section of the navigation pane. There, I search for and find the log groups created by the two Lambda functions running in different AWS accounts. As expected, each log group shows the account ID and label originating the data. I select both log groups and choose View in Logs Insights.

I can now search and analyze logs from different AWS accounts using the CloudWatch Logs Insights query syntax. For example, I run a simple query to see the last twenty messages in the two log groups. I include the @log field to see the account ID that the log belongs to.

I can now also create Contributor Insights rules on cross-account log groups. This enables me, for example, to have a holistic view of what security events are happening across accounts or identify the most expensive Lambda requests in a serverless application running in multiple accounts.
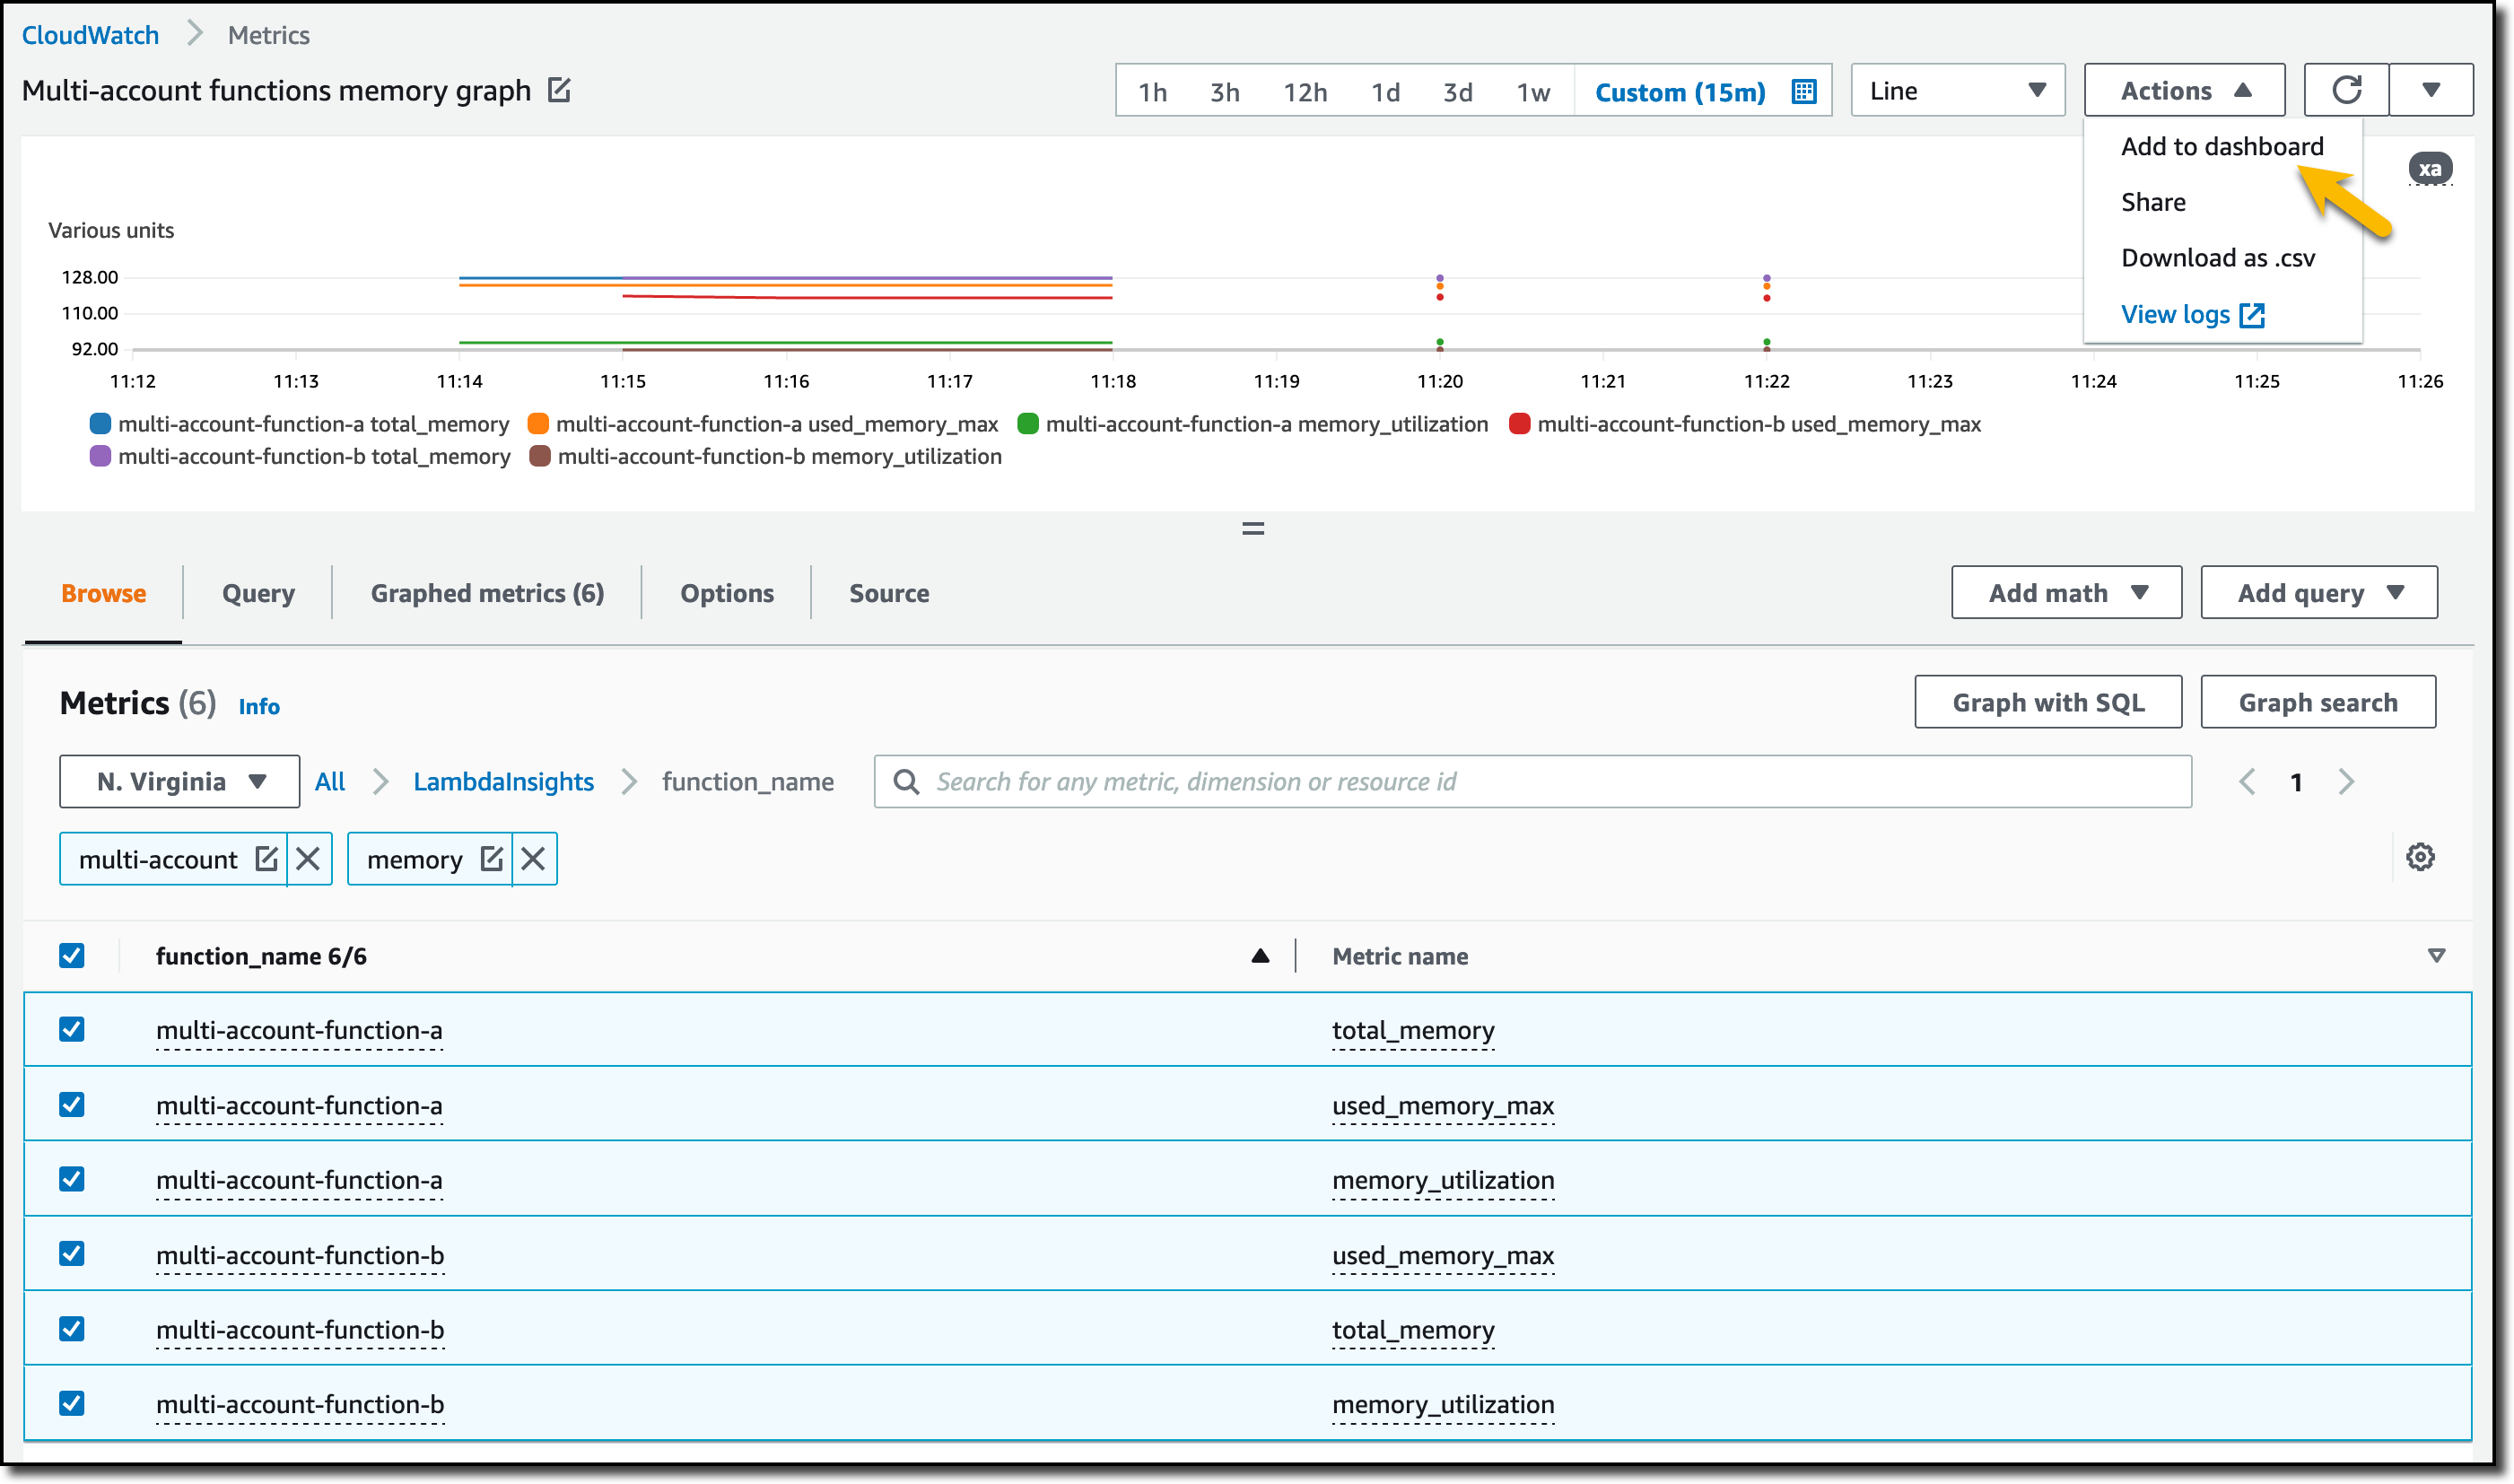
Then, I choose All metrics in the Metrics section of the navigation pane. To see the Lambda function runtime performance metrics collected by CloudWatch Lambda Insights, I choose LambdaInsights and then function_name. There, I search for multi-account and memory to see the memory metrics. Again, I see the account IDs and labels that tell me that these metrics are coming from two different accounts. From here, I can just select the metrics I am interested in and create cross-account dashboards and alarms. With the metrics selected, I choose Add to dashboard in the Actions dropdown.
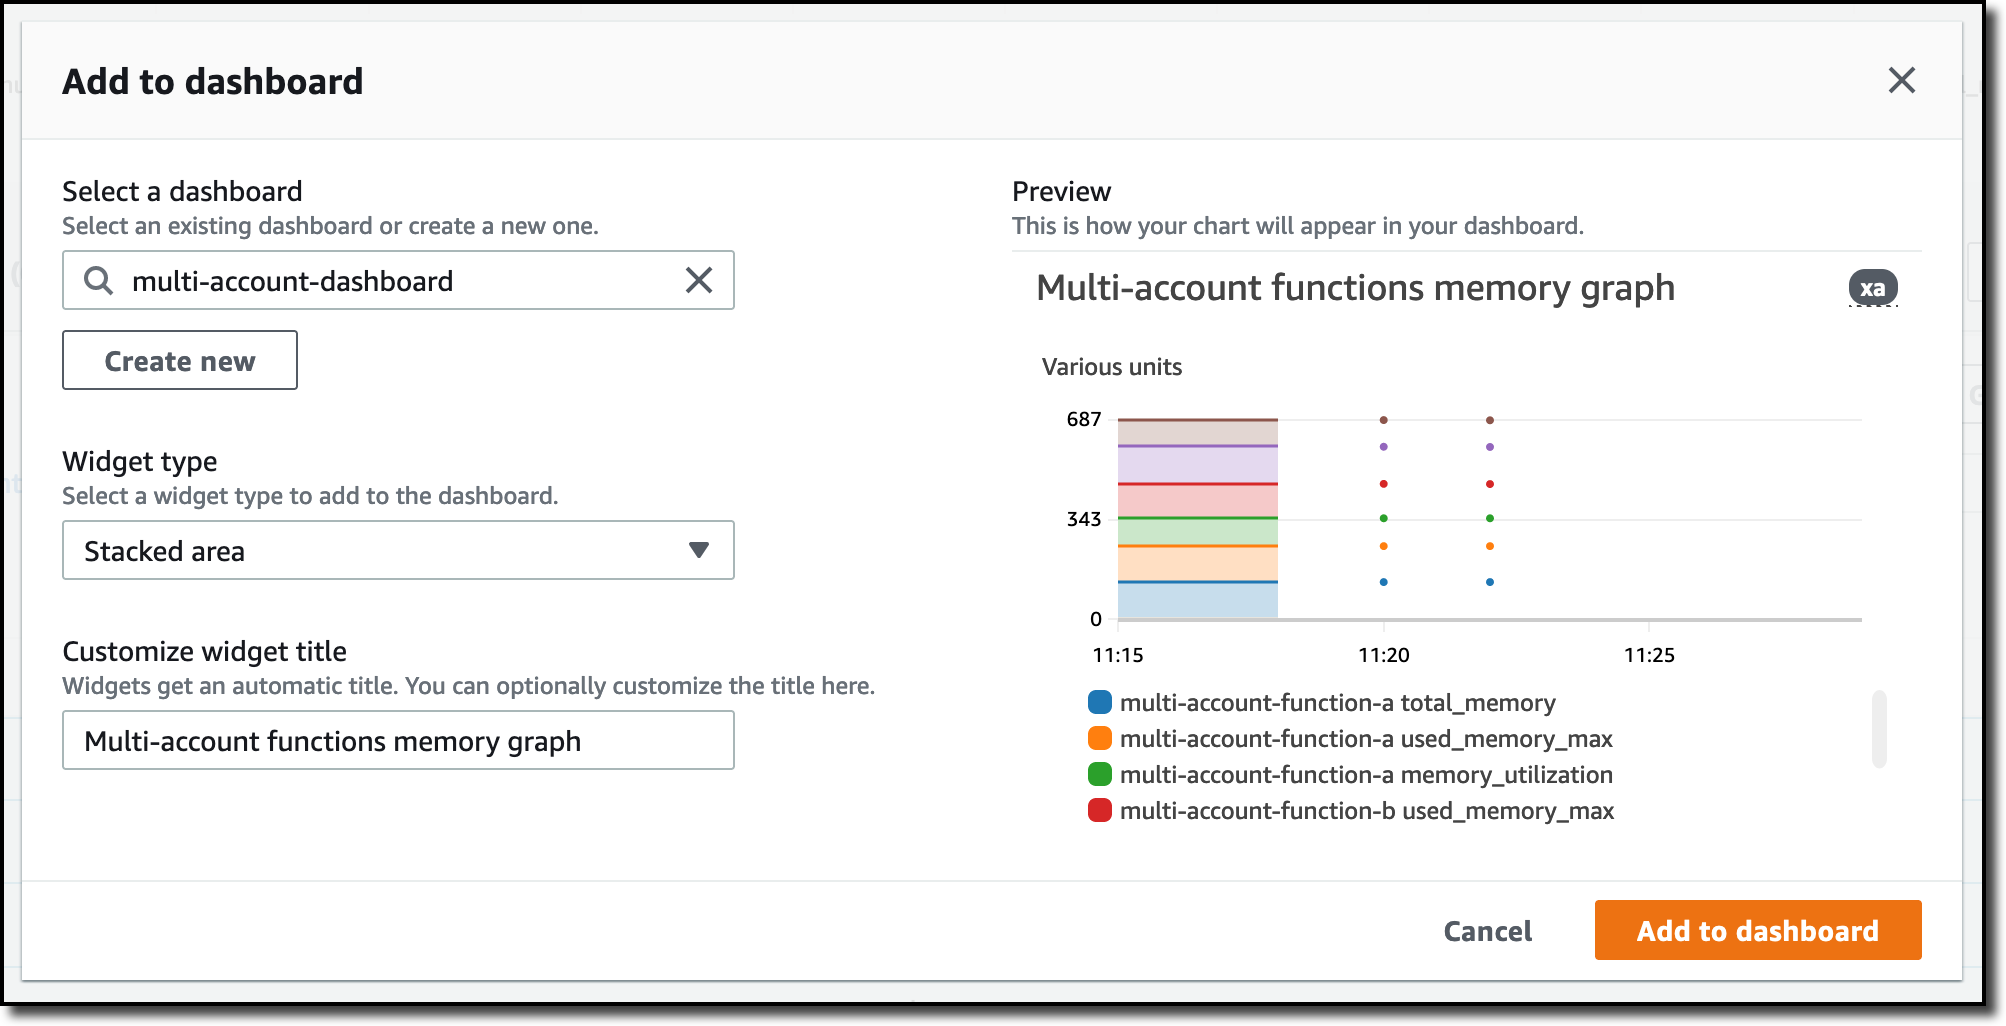
I create a new dashboard and choose the Stacked area widget type. Then, I choose Add to dashboard.
I do the same for the CPU and memory metrics (but using different widget types) to quickly create a cross-account dashboard where I can keep under control my multi-account setup. Well, there isn’t a lot of traffic yet but I am hopeful.

Finally, I choose Service map from the X-Ray traces section of the navigation pane to see the flow of my multi-account application. In the service map, the client triggers the Lambda function in the source account. Then, an event is sent to the other account to run the other Lambda function.

In the service map, I select the gear icon for the function running in the source account (multi-account-function-a) and then View traces to look at the individual traces. The traces contain data from multiple AWS accounts. I can search for traces coming from a specific account using a syntax such as:

The service map now stitches together telemetry from multiple accounts in a single place, delivering a consolidated view to monitor their cross-account applications. This helps me to pinpoint issues quickly and reduces resolution time.
Availability and Pricing
Amazon CloudWatch cross-account observability is available today in all commercial AWS Regions using the AWS Management Console, AWS Command Line Interface (AWS CLI), and AWS SDKs. AWS CloudFormation support is coming in the next few days. Cross-account observability in CloudWatch comes with no extra cost for logs and metrics, and the first trace copy is free. See the Amazon CloudWatch pricing page for details.
Having a central point of view to monitor all the AWS accounts that you use gives you a better understanding of your overall activities and helps solve issues for applications that span multiple accounts.
Start using CloudWatch cross-account observability to monitor all your resources.
— Danilo