The Internet of Things on AWS – Official Blog
Build your pool water temperature monitoring solution with AWS
I live in Toulouse, in the south of France, where the climate is classified as humid subtropical climate (Cfa in the Köppen climate classification). This is why swimming pools are so common here! My household is no exception. But as a geek, I also wanted to monitor the temperature of my swimming pool, consult real-time indicators, and view history.
Let’s have a deep dive (pun intended) together: in this blog post, I demonstrate how to put AWS services together to cost-effectively build a water temperature monitoring solution. By following this demo, you will learn useful tools not just for building your own water temperature monitoring solution, but other creative monitoring solutions as well.
Prerequisites
I had a M5StickC with an NCIR hat, and an AWS account with AWS IoT Core, Amazon Timestream and Amazon Managed Service for Grafana (Preview), which covered everything I needed to get started!
Components overview
M5StickC is a mini M5Stack, powered by ESP32. It is a portable, easy-to-use, open source, IoT development board. M5stickC is one of the core devices in the M5Stack product series. It is built in a continuously growing hardware and software ecosystem. It has many compatible modules and units, as well as the open source and engineering communities that will help maximize your benefits at every step of the development process.
NCIR hat is an M5StickC-compatible infrared sensor. This HAT module integrates MLX90614 which can be used to measure the surface temperature of a human body or other object. Since this sensor measures infrared light bouncing off of remote objects, it senses temperature without the need for physical contact.
AWS IoT Core lets you connect IoT devices to AWS without the need to provision or manage servers. AWS IoT Core can support billions of devices and trillions of messages, and can process and route those messages to AWS endpoints and to other devices reliably and securely. With AWS IoT Core, your applications can keep track of and communicate with all your devices, all the time, even when they aren’t connected.
Amazon Timestream is a fast, scalable, and serverless time series database service for IoT and operational applications that makes it easy to store and analyze trillions of events per day up to 1,000 times faster and at as little as 1/10th the cost of relational databases.
Amazon Managed Service for Grafana (AMG) is a fully managed service that is developed together with Grafana Labs and based on open source Grafana. Enhanced with enterprise capabilities, AMG makes it easy for you to visualize and analyze your operational data at scale. Grafana is a popular open source analytics platform that enables you to query, visualize, alert on and understand your metrics no matter where they are stored.
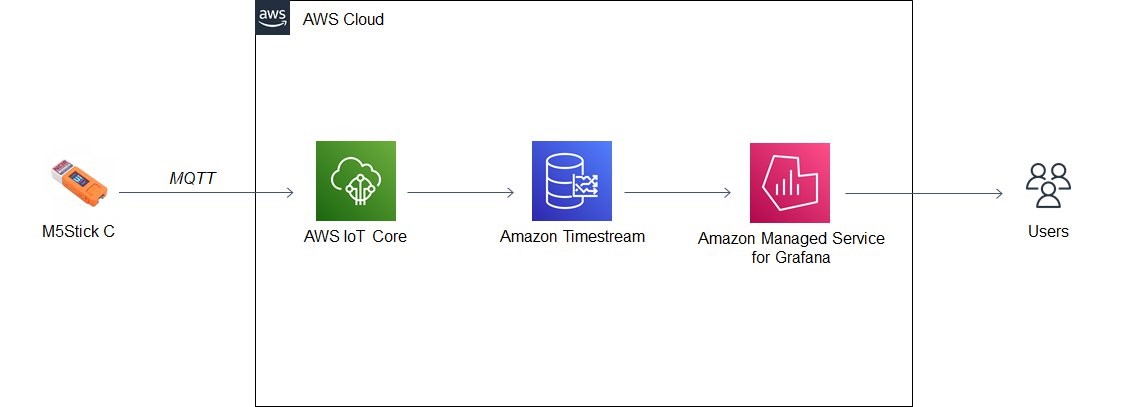
High-level architecture
The following diagram shows the flow of information, starting from the M5stickC, through AWS IoT Core and then Timestream, to the end users viewing the dashboard in AMG.
AWS IoT Core setup
We will start with the following steps:
- Policy creation
- Thing creation, including:
- Certificate creation
- Policy attachment
To create a policy
An AWS IoT Core policy allows you to control access to AWS IoT Core operations that allow you to connect to the AWS IoT Core message bus as well as send and receive MQTT messages.
- Open the AWS Management Console of your AWS account.
- Navigate to the AWS IoT Core service, then open Secure > Policies section.
- Select Create.
- Enter the following values:
- Name: TempCheckerPolicy
- Statements > Advanced
{
  "Version": "2012-10-17",
  "Statement": [
    {
      "Effect": "Allow",
      "Action": "iot:Publish",
      "Resource": "arn:aws:iot:<region>:<account-id>:topic/TempCheckerTopic"
    },
    {
      "Effect": "Allow",
      "Action": "iot:Subscribe",
      "Resource": "arn:aws:iot:<region>:<account-id>:topicfilter/TempCheckerTopic"
    },
    {
      "Effect": "Allow",
      "Action": "iot:Connect",
      "Resource": "*"
    }
  ]
}
- Select Create.
To create a thing
- In the AWS Management Console, open AWS IoT Core.
- In the Manage > Things section, select Create.
- Select Create a single thing.

- Create a thing type with the following information:
- Name: M5Stick
- Description: An M5StickC with NCIR hat.

- Select Create thing type.
- On the next page, fill in the thing creation form with the following:
- Name: TempChecker
- Thing type: select M5Stick
- Select Next.

To add a certificate for your thing and attach a policy
- In the “One-click certificate creation (recommended)” panel, select Create certificate.

The certificate is immediately created. - Download the certificate, along with public and private keys.
- Select Attach a policy.

- Select the TempCheckerPolicy policy, then select Register Thing.

M5Stick setup
Now that AWS IoT Core is ready to receive IoT (MQTT) messages, let’s take care of the thing itself.
The M5Stick supports multiple development platforms: UIFlow, Arduino, and FreeRTOS. In this use case, I used UIFlow visual programming capabilities (using Blockly+Python) along with its AWS IoT built-in library to easily build and deploy my business logic.
Note: You can find more information here about how to install UIFlow IDE and how to “burn” UIFlow firmware on the M5StickC.
We need to build and deploy a program on the M5Stick that will run continuously. It contains all the necessary instructions to take the temperature sensor data and send it to AWS IoT Core. The algorithm is simple:
- Initiate the communication with AWS IoT Core.
- Initialize the M5StickC internal clock with NTP.
- Start a loop that repeats every second with the following:
- Get the temperature from the NCIR hat.
- Publish a JSON-formatted message containing the temperature and the current timestamp.
I added a visual indication of the temperature on the LCD screen, as well as LED signals with publishing MQTT messages.
As Werner Vogels, AWS CTO, says, “everything fails all the time”, so to reduce errors, I added try-catch components to debug and recover from errors.
In the AWS IoT block, use the private key and certificate files you just downloaded to set the keyFile and certFile values.
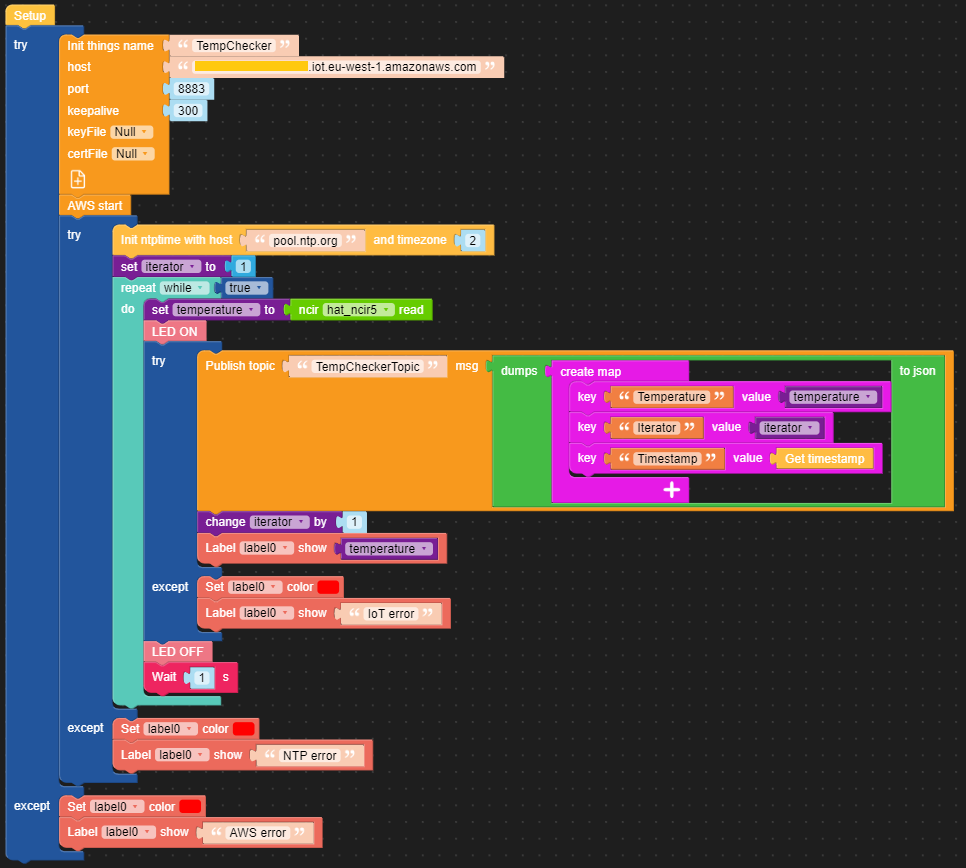
UIFlow translates the blocks into micropython.
from m5stack import *
from m5ui import *
from uiflow import *
from IoTcloud.AWS import AWS
import ntptime
import hat
import json
import time
import hat

setScreenColor(0x111111)
hat_ncir5 = hat.get(hat.NCIR)
iterator = None
temperature = None
label0 = M5TextBox(5, 72, "1", lcd.FONT_Default, 0xFFFFFF, rotate=0)

from numbers import Number

try :
  aws = AWS(things_name='TempChecker', host='<endpoint>.iot.eu-west-1.amazonaws.com', port=8883, keepalive=300, cert_file_path="/flash/res/c47c10a25d-certificate.pem", private_key_path='')
  aws.start()
  try :
    ntp = ntptime.client(host='pool.ntp.org', timezone=2)
    iterator = 1
    while True:
      temperature = hat_ncir5.temperature
      M5Led.on()
      try :
        aws.publish(str('TempCheckerTopic'),str((json.dumps(({'Temperature':temperature,'Iterator':iterator,'Timestamp':(ntp.getTimestamp())})))))
        iterator = (iterator if isinstance(iterator, Number) else 0) + 1
        label0.setText(str(temperature))
        pass
      except:
        label0.setColor(0xff0000)
        label0.setText('IoT error')
      M5Led.off()
      wait(1)
    pass
  except:
    label0.setColor(0xff0000)
    label0.setText('NTP error')
  pass
except:
  label0.setColor(0xff0000)
  label0.setText('AWS error')
Amazon Timestream setup
Now we configure the storage for our temperature data. Amazon offers the broadest selection of purpose-built databases to support different use cases. In this case, the right tool for the right job is Timestream.
Our use case is clearly related to time series data. Timestream is the dedicated service to manipulate this type of data using SQL, with built-in time series functions for smoothing, approximation, and interpolation. Amazon Timestream also supports advanced aggregates, window functions, and complex data types such as arrays and rows. And Amazon Timestream is serverless – there are no servers to manage and no capacity to provision. More information in the documentation.
To create a database in Timestream
- Open Timestream in the AWS Management Console.
- Select Create database.
- Enter the following information:
- Configuration: Standard database
- Name: TempCheckerDatabase
- Encryption: aws/timestream
- Confirm by selecting Create database.

To create a table
On the next page, we create our table.
- Select your newly created database, open the Tables tab, and select Create table.
- Set the following values:
- Table name: Temperature
- Data retention:
- Memory: 1 day
- Magnetic: 1 year

AWS IoT Core destination setup
Our storage is ready to receive data from AWS IoT Core.
Let’s configure the IoT rule that triggers when our M5StickC sends data. This will run the action to insert data into Timestream.
- Open AWS IoT Core in the AWS Management Console.
- In the Act > Rules section, select Create, and then enter the following:
- Name: TempCheckerRule
- Description: Rule to handle temperature messages
- Rule query statement:
SELECT Temperature FROM 'TempCheckerTopic'

- In the “Set one or more actions” panel, select Add action. Select Write a message into a Timestream table, then Configure action.

- Select the Timestream database and table we just created. Add the following dimension:
- Dimension Name: Device
- Dimension Value: M5stick
- Next, we need to create an AWS IAM role to allow the service to access the database. Select Create role, and then enter the following:
- Name: TempCheckerDatabaseRole

- Name: TempCheckerDatabaseRole
- Review your selections, and then confirm the action by selecting Add action.

- In the “Error action” panel, select Add action. Select Send message data to CloudWatch logs, select Configure action.

- Select Create a new resource to be redirected to Cloudwatch.
- Create a log group named TempCheckerRuleErrors.
- In the action configuration wizard, refresh the resources list and select the newly created log group.
- We need to create an AWS IAM role to allow the service to access Cloudwatch. Select Create role, then enter the following name:
- Name: TempCheckerCloudwatchRole

- Name: TempCheckerCloudwatchRole
- Confirm the action by selecting Add action.

- Confirm the rule creation by selecting Create rule.

We now have a valid rule that feeds the Timestream database with the temperature data sent by the M5StickC.
Amazon Managed Service for Grafana setup
Next, let’s visualize this data.
Note: At the time of writing, AMG is still in preview.
- Open the AMG console, then choose Create workspace and enter the following:
- Workspace name: TempCheckerWorkspace
- Choose Next.

You are prompted to enable AWS Single Sign-On (SSO) before you can begin managing it. If you have already performed these actions in your AWS account, you can skip this step.

AMG integrates with AWS SSO so that you can easily assign users and groups from your existing user directory such as Active Directory, LDAP, or Okta within the Grafana workspace and single sign-on using your existing user ID and password. You can find more information in this blog post. - Select Create user.
- Enter your email address, along with your first and last name, then confirm by selecting Create user.

The AWS Organization and AWS SSO should be enabled in seconds. You will receive a few emails in parallel: one for AWS Organization setup validation, and one for for AWS SSO setup validation. Remember to check them out and complete the validation steps. - For permission type, use the default Service managed permissions, allowing AWS to manage IAM roles. This ensures that evolutions in AMG that require updates in IAM will be automatically propagated and service will not be interrupted. Select Next.

- Because I built this for a personal project, I can use “Current account” to manage the authorizations in this AWS account. Complex organizations will want to leverage their AWS Organization Units.
- To allow our workspace to access Timestream data source, select Amazon TimeStream, then select Next.

A warning panel should appear, stating “you must assign user(s) or user group(s) before they can access Grafana console.” To assign users, use the following steps: - Select Assign user.
- Select the user you just created and confirm by selecting Assign user.

Once the Grafana workspace is created, the link will be provided on this page.
To configure a Grafana dashboard
- Log in with AWS SSO.
- On the welcome page, navigate to Create > Dashboard.
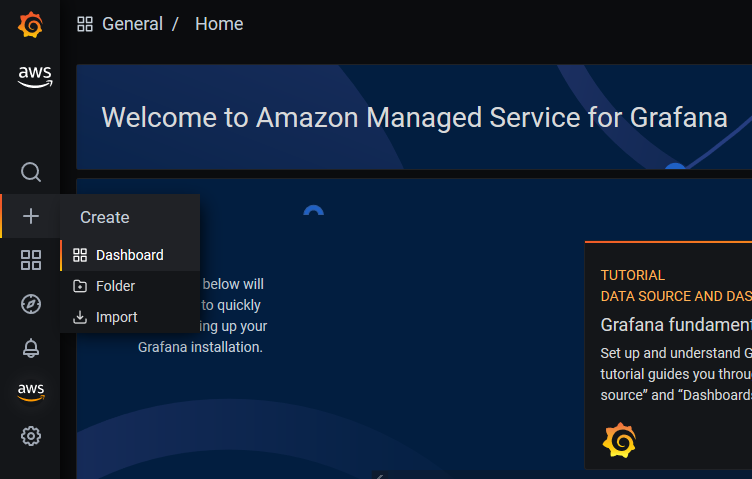
In Grafana, each dashboard contains one or more panels. The panel is the basic visualization building block. With the exception of a few special purpose panels, a panel is a visual representation of data over time. This can range from temperature fluctuations to the current server status to a list of logs or alerts. There are a wide variety of style and formatting options for each panel. Panels can be moved, rearranged, and resized.
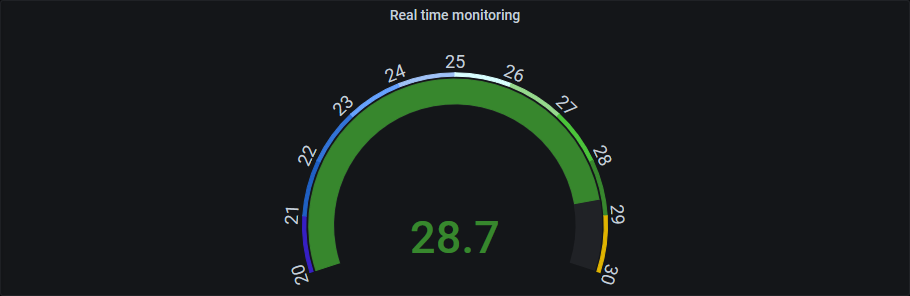
We start by adding a panel for the real-time temperature display. For this, a gauge will give us a quick and colorful overview.
To configure a temperature gauge panel
- Add a new panel and select Amazon Timestream as data source.
- Enter the following query to retrieve the latest temperature value inserted in the database:
SELECT measure_value::double AS temperature
FROM "TempCheckerDatabase".Temperature
ORDER BY time DESC
LIMIT 1
- On the right, in Panel configuration, set the panel name to “Real time monitoring” and select the Gauge visualization.

- In the Field configuration, set the Min and Max options, as well as the relevant thresholds. I chose a progressive rainbow from blue to red as the temperature is expected to increase.


- Select Save, and you will see your gauge.
To configure a temperature history panel
The second panel is a temperature history panel which will retrieve the historical data, filtered by the period selected by the user in Grafana.
- Add a panel and select Amazon Timestream as data source.
- Enter the following statement in order to query the database with the relevant filters:
SELECT ROUND(AVG(measure_value::double), 2) AS avg_temperature, BIN(time, $__interval_ms) AS binned_timestamp
FROM "TempCheckerDatabase".Temperature
WHERE $__timeFilter
AND measure_value::double < 100
AND measure_value::double > 20
GROUP BY BIN(time, $__interval_ms)
ORDER BY BIN(time, $__interval_ms)
- On the right, in Panel configuration, set the Panel title to Trend and select the Graph visualization.

- Select Apply to finalize the second panel.
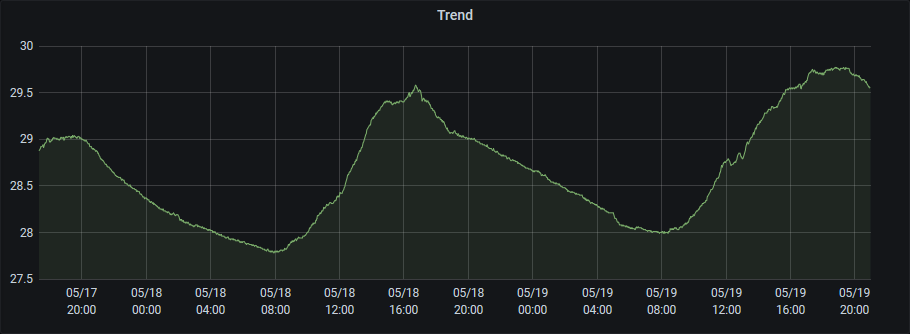
Now we have created two panels in our Grafana dashboard: one that displays current temperature on a gauge and one that shows historical temperature on a graph.
Pricing
To understand the cost of this project using AWS’s pay-as-you-go services, we will use the following assumptions:
- The M5StickC is connected permanently to send 1 message per second.
- Every IoT message is written to the time series database, for around 40 bytes each.
- 1 Grafana Editor license active, as I am the only user of my personal dashboard.
Cost breakdown
(Note: Please check following pricing pages to ensure the current pricing)
- AWS IoT Core costs $3.42/month for the connectivity, messaging, and rules engine.
- Amazon Timestream, after 1 year of data stored, will cost $1.64/month for the storage and queries.
- Amazon Managed Service for Grafana is billed $9.00/month for every editor license.
Total cost
The total monthly cost for our complete solution is $3.42 + $1.64 + $9.00 = $14.06/month
Cleaning up
If you followed along with this solution, complete the following steps to avoid incurring unwanted charges to your AWS account.
AWS IoT Core
- In the Manage section, delete the Thing and Thing type.
- In the Secure section, remove the Policy and Certificate.
- In the Act section, clean up the Rule.
Amazon Timestream
- Delete the database, this will also delete the table.
Amazon Managed Service for Grafana
- Delete the whole workspace.
AWS IAM
- Delete the roles created along the way.
Amazon CloudWatch
- Delete the relevant Log groups.
Conclusion
In this post, I demonstrated how to set up a simple end-to-end solution to monitor the temperature of your swimming pool. The solution required minimal coding: only 2 SQL queries for Grafana. If you want to try it, you can mock the M5stickC by creating an AWS Lambda function in your AWS account with the following code. Give it an IAM role with access rights to AWS IoT Core.
import boto3
import datetime
import time
import math
import json

iot_client=boto3.client('iot-data')
topic = "TempCheckerTopic"

def lambda_handler(event, context):

    i = 0
    while i < 800:
        i += 1

        # Calculating seconds from midnight
        now = datetime.datetime.now()
        midnight = now.replace(hour=0, minute=0, second=0, microsecond=0)
        seconds = (now - midnight).seconds

        # Calculating fake temperature value
        temperature = round(math.sin(seconds/600) * 5 + 25, 2)

        # Preparing payload
        payload = json.dumps({"Iterator": i,
                              "Temperature": temperature,
                              "Timestamp": now.timestamp()})

        # Publishing to IoT Core
        iot_client.publish(topic=topic, payload=payload)

        # Waiting for 1 second before next value
        time.sleep(1)

    return {
        'statusCode': 200
    }
Thanks for reading this blog post where I demonstrated how to use AWS IoT Core, Timestream, and AMG together to build a smart water temperature monitoring solution for my pool. I hope the demonstration and lessons learned inspire you to bring your innovative ideas to life! Learn more about Connected Home Solutions with AWS IoT.
About the author
 Jérôme Gras is a Solutions Architect at AWS. He is passionate about helping industry customers build scalable, secure, and cost-effective applications to achieve their business goals. Outside of work, Jérôme enjoys DIY stuff, video games, and board games with his family.