AWS News Blog
New – CloudTrail Integration with CloudWatch Logs; 2 Partner Solutions

|
As you may know, AWS CloudTrail records API activity in your AWS account and delivers a log file with the recorded API activity to a designated S3 bucket (see my post, AWS CloudTrail – Capture AWS API Activity, for more info). Earlier this year we announced CloudWatch Logs and gave you the ability to store and monitor OS and application log files. As I told you at the time, CloudWatch Logs gives you the ability to monitor for specific phrases, values or patterns.
CloudTrail, Meet CloudWatch
Today, we are announcing CloudTrail integration with CloudWatch Logs. This integration enables you to receive SNS notifications from CloudWatch, triggered by specific API activity captured by CloudTrail.
With SNS notifications, you can take immediate action when a pattern of interest is detected. You can contact the affected user to learn more, automatically create a trouble ticket, or initiate other troubleshooting operations. For example, you can create a CloudWatch Logs metric filter that watches for API calls related to a VPC, then create a CloudWatch metric and CloudWatch alarm and receive SNS notifications when the metric count exceeds the threshold values you specify.
Once you turn on this integration from the CloudTrail console, CloudTrail will deliver log files containing API activity to the CloudWatch log group that you specify:
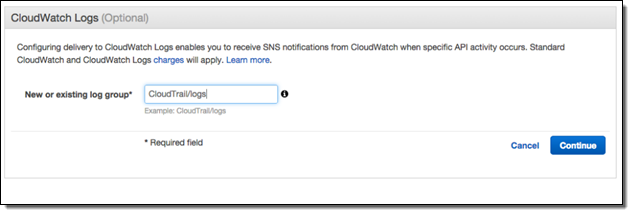
As with any AWS feature, you can turn on this integration using the AWS Command Line Interface (AWS CLI) or one of the AWS SDKs. CloudTrail will continue to deposit log files in the designated S3 bucket even after you enable this new integration feature.
Setting Metrics, Filters, and Alarms
Now that I have turned on the integration, I need to create CloudWatch metric filters, metrics and alarms to receive SNS notifications and take immediate action. Suppose I want to receive an SNS notification whenever an authorization failure occurs for your AWS account. We can set this up in three steps!
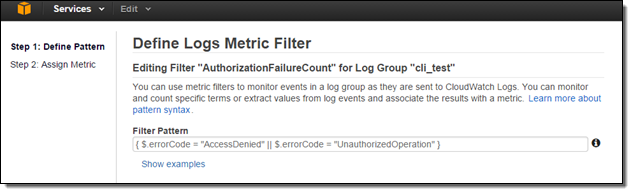
Since, CloudTrail provides an error code in its payload whenever an API call fails due to improper or insufficient permission, I can scan the CloudTrail events for the strings “AccessDenied” and “UnauthorizedOperation” using a Metric Filter:
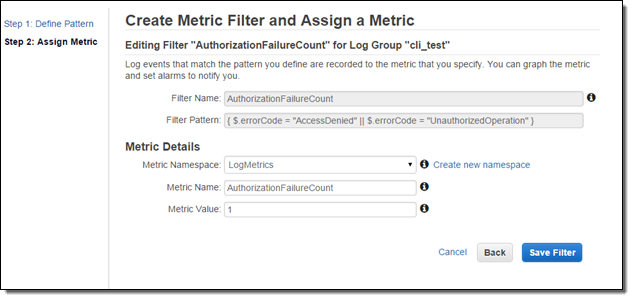
Now I need to set the filter up so that it generates a CloudWatch metric named “AuthorizationFailureCount” in the “LogMetrics” namespace. Each occurrence of “AccessDenied” or “UnauthorizedOperation” will increase the value (count) of the metric by 1:
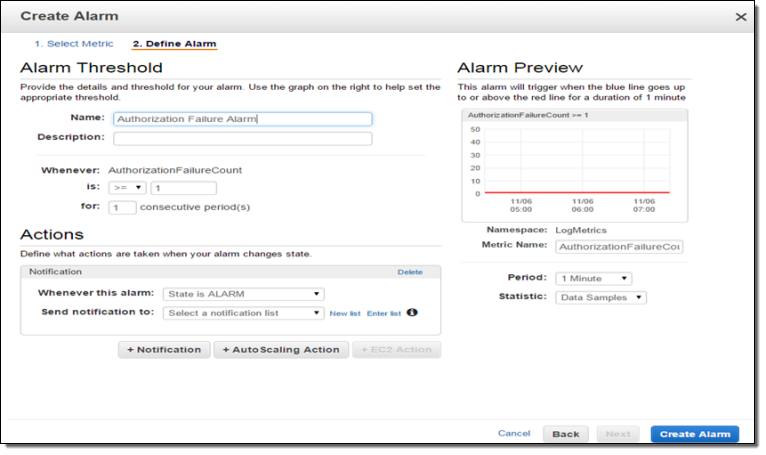
Now I can create a CloudWatch alarm and set up a threshold. Since I want to now about every authorization failure, I will set the alarm threshold so that the alarm will fire if one or more failures occur per minute. You can, of course, customize this as needed.
I can test this by creating an email subscription to my SNS topic and then initiating an operation that results in a failed authorization. The notification text will read as follows:
You are receiving this email because your Amazon CloudWatch Alarm “AuthorizationFailureCount” in the US – N. Virginia region has entered the ALARM state, because “Threshold Crossed: 1 datapoint (3.0) was greater than the threshold (1.0).” at “Wednesday 05 November, 2014 19:12:58 UTC
As you can see, the process of connecting CloudTrail to CloudWatch and setting up SNS notifications takes just a few minutes. The CloudTrail team is very interested in your feedback on this new feature. They are particularly interested in learning more about specific APIs and API activities you would like to monitor. Please visit the CloudTrail Forum and leave some feedback for them!
Pricing and Availability
This integration is currently available in the Regions where CloudWatch Logs are supported: US East (N. Virginia),US West (Oregon), and Europe (Ireland). You will incur standard CloudWatch logs and CloudWatch charges.
Support from Partners
AWS Partners CloudNexa and Graylog2 have announced tools that analyze CloudTrail log files.
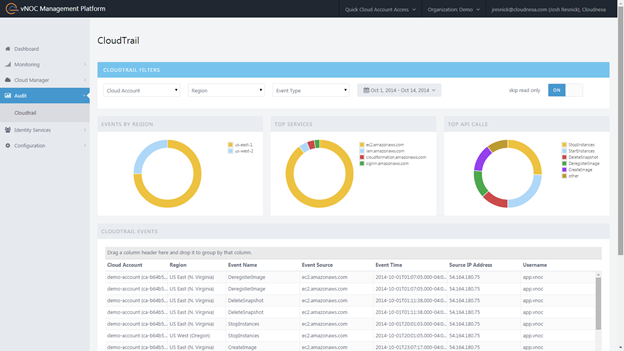
CloudNexa (a premier consulting partner and AWS reseller) provides Cloud Management as a Service. They are providing their new CloudTrail functionality at no charge at part of their vNOC Platform. You can use this tool to view CloudTrail events by region or to look at the most popular API Calls and most frequently used services. You can also filter out irrelevant events and quickly drill down to those that are of interest to you. Here’s a snapshot of the VNOC dashboard:
To learn more, visit their site or watch their one minute video.
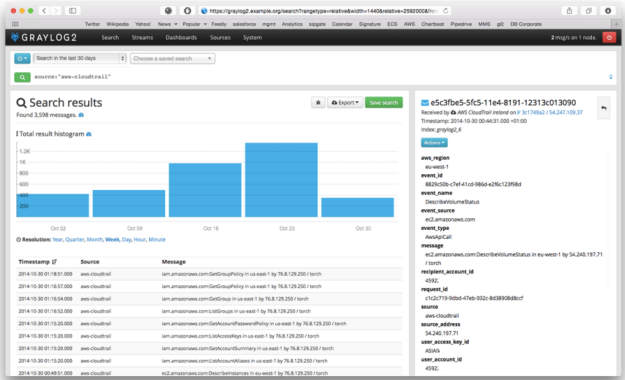
Graylog2 is an open source solution that allows you to combine log files from CloudTrail with your operating system or application logs. Once these events are ingested, Graylog2 enables you to perform quick searches on vast amounts of data, correlate events from multiple sources and create your dashboards on the data.
To learn more, visit their site or watch their one minute video.
— Jeff;