AWS Partner Network (APN) Blog
Big Data Analytics with Amazon EMR and Esri’s ArcGIS GeoAnalytics Engine
By Sid Singh, Sr. Manager, Tech BD – AWS
By Jeff DeMuth, Sr. Solutions Architect, Esri – AWS
By Arif Masrur, Sr. Solution Engineer, Data Science & Analytics – Esri
By Thomas Fair, Technical Director, Mapping, Location Services & Analytics – Esri
 |
| Esri |
 |
Data is growing in all aspects of our world; every vertical and technical domain is being pushed to the limit by growing data—geospatial is no exception.
Until the recent launch of Esri’s ArcGIS GeoAnalytics Engine, a geospatial library for Spark, it was difficult at best to perform geospatial analysis in the Hadoop framework. Many customers are moving to data lake architectures and have copied their datasets into a database to be able to run geospatial functions against it.
Esri is an AWS Public Sector Partner with the AWS Public Safety and Disaster Response Competency. Inspiring positive change in industry and society through mapping and geospatial analytics is at the heart of Esri’s business.
GeoAnalytics on Amazon EMR, which is a managed Hadoop service, now unlocks the ability to do massive parallel analysis and transformation. Customers can unlock insights in data lakes with over 120 geospatial functions and directly against Amazon Simple Storage Service (Amazon S3) data lake.
GeoAnalytics seamlessly integrates with Amazon EMR and can be deployed with an Esri-provided bootstrap script at EMR cluster creation. If you are unfamiliar with Amazon EMR, you can read through the getting started guide.
In this post, we will cover ArcGIS GeoAnalytics Engine on Amazon EMR and how its geospatial capabilities can complement your current analytics workflows. We’ll talk about a few geospatial concepts and walk through setting up an environment.
Brief Introduction to ArcGIS GeoAnalytics Engine
Esri’s ArcGIS GeoAnalytics Engine has three characteristics:
- Provides a cloud-native and Spark-native library for spatial big data analytics.
- Data scientists and GIS analysts can quickly access and exploit an off-the-shelf spatial analytics library that works with other analysis packages. It offers a comprehensive solution that eliminates the need to jump between packages and platforms, as users get access to the largest number of spatial tools and functions in a single library directly within their preferred analytics platform.
- Users can write, publish, and visualize analytics results where they need them. It can write back to any data source with a Spark connector that supports the write capability, for example, to data lakes and databases, data warehouses, and also business intelligence (BI) and GIS applications.
The GeoAnalytics Engine supports different types of spatial functions and tools, such as constructors that are used to create spatial features from data. This includes functions for generating points, multi-point features, and polygons.
GeoAnalytics Engine provides different types of spatial functions and specialized tools, such as constructors that are used to create spatial features from data. This includes functions (ST_point, ST_multipoint, ST_Linestring, ST_polygon) for generating points, multi-point features, lines, and polygons.
There are also accessors that retrieve values from data, such as accessing spatial reference values for a coordinate system, as well as geometric attributes for a feature or object. Some functions (ST_intersects, ST_overlap) allow users to perform relationship tests to identify features that are spatially related to one another.
Furthermore, there are tools for spatial operations (FindDwellLocations,GWR, FindHotSpots) that can help model spatially varying relationships and detect incidents, anomalies, and hotspots. With binning functions (Figure 1), massive datasets can be quickly aggregated at scale to highlight patterns. To learn more about available functions and tools, and to get started please see the product page.
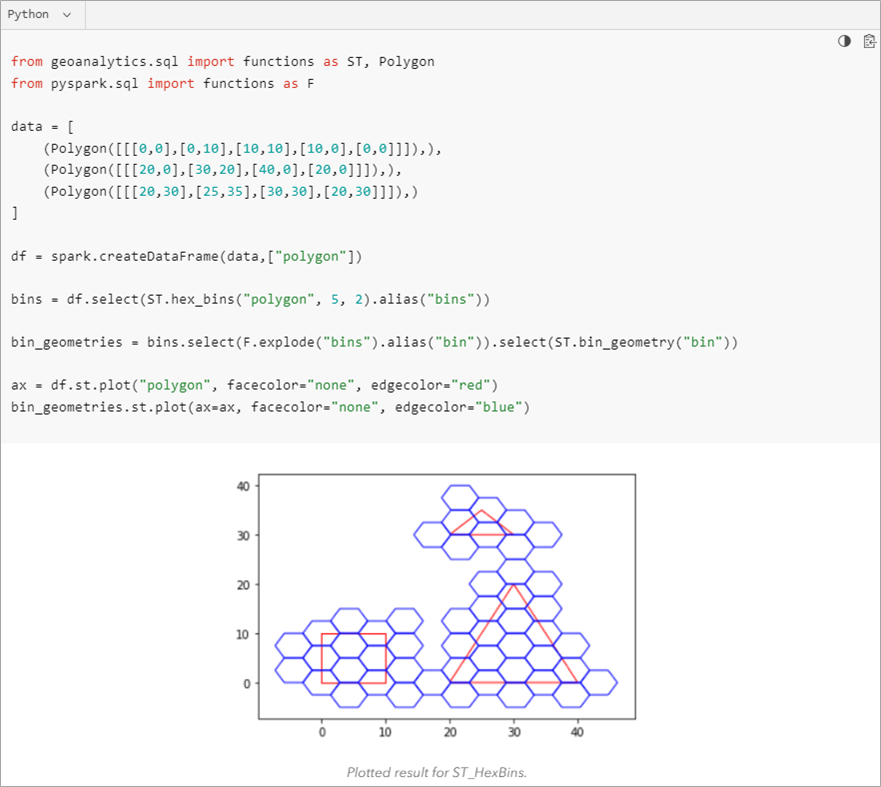
Figure 1 – Example codes for one of the spatial binning functions in GeoAnalytics Engine.
Improving Data Science Workflow: Faster, Automated Spatial Indexing
Data scientists across sectors regularly need to deal with the infamous five Vs of big data: volume, velocity, variety, validity, and vinculation. They often need to build location-based data into their analytics and machine learning (ML) models. As these datasets capture relationships among real-world entities and events, data science workflows require joining many attributes from diverse sources. They need to vinculate (or bind) multifaceted relationships through spatial/spatiotemporal joins and relationships tests, which can be computationally intensive.
GeoAnalytics Engine has functions and tools that support automatic spatial indexing, allowing users to perform optimized spatial joins and other analysis operations immediately. To alleviate this process, GeoAnalytics Engine offers functions and tools that support automatic spatial indexing, allowing users to perform optimized spatial joins and other analysis operations immediately. It leverages Spark to dramatically reduce processing and analysis time.
Esri’s internal benchmark testing has shown that GeoAnalytics Engine provides significantly better performance when running big data spatial analytics compared to open-source packages. The performance gains increase as the size of the data increases, so users will see even better performance for larger datasets. One benchmark test showed a single-machine deployment of GeoAnalytics Engine performed 17X faster than open-source tools when performing spatial intersection relationship tests against a dataset with 11 million polygons.
Esri also examined performance of GeoAnalytics Engine by joining two input datasets with varied sizes, up to millions of data records and types (such as points and polygons). The table below shows compute times for each join scenario that was tested on a single and multi-machine spark cluster.
| Inputs | Compute Time (Seconds) | ||
| Left Dataset | Right Dataset | Single Machine | Multi-Machine |
| 50 polygons | 6K points | 6 | 5 |
| 3K polygons | 6K points | 10 | 5 |
| 3K polygons | 2M points | 19 | 9 |
| 3K polygons | 17M points | 46 | 16 |
| 220K polygons | 17M points | 80 | 29 |
| 11M polygons | 17M points | 515 (8.6 min) | 129 (2.1 min) |
| 11M polygons | 19M points | 1,373 (22 min) | 310 (5 min) |
Deployment
Next, let’s walk through a typical deployment and some sample code. Follow these steps to launch and configure your Amazon EMR cluster with GeoAnalytics.
- To start, Navigate to Esri’s GeoAnalytics setup page which has the steps for configuring the bootstrap and launching an initial cluster.
- Once your cluster has launched and is in a “waiting state,” we can create and attach a notebook.
- On the EMR left-hand navigation, click on Notebooks and enter a Notebook name.
- Under Choose an existing cluster, click Choose and select the cluster we just created
- Click Create Notebook. The notebook instance will only take a minute or two to create and spin up. You are redirected to the notebook page where you can click Open in Jupyter to begin.
- Click New in the top-right corner. You can select either Python3 or PySpark.
You will be dropped into a blank notebook and you are ready to go. You can run a few commands like the one below to get started. This example shows a sample registration and print command to show the newly-added geospatial functions.

Figure 2 – Example GeoAnalytics initialization and authorization.
Big Data Analytics Use Case
Now that you have learned how to deploy the engine in an Amazon EMR cluster and set up a notebook, let’s walk through an example use case. Here, we examine a publicly available New York 311 call dataset. The 311 system provides non-emergency services to city residents through various channels such as phone calls and smartphone apps. This dataset has ~27 million records, but we can analyze billions of records given data availability.
Our overarching goal is to uncover spatio-temporal patterns of long-response-calls types that will help city governments plan and allocate resources for efficient 311 calls response. The dataset has been uploaded to an Amazon S3 bucket as CSV file format.
In the notebook, we import essential GeoAnalytics and PySpark libraries, authenticate the engine, and load in the data directly from S3 bucket into a PySpark dataframe. After that, we geo-enable the data with point geometry.
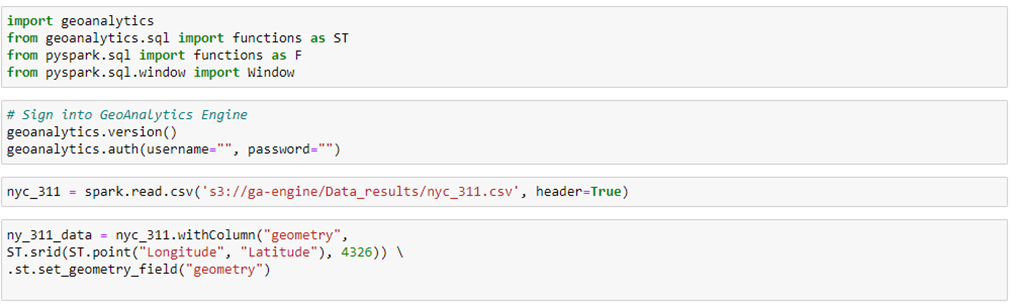
Figure 3 – Example workflow for importing essential libraries, authenticating the engine, and data ingestion and geo-enablement.
After checking some data samples, we identify the existence of NULL values in different attributes, inappropriate attributes names, and many redundant attributes and data samples for our analytics goal. Therefore, we need to clean and filter the data, as follows:
- Create timestamp columns.
- Calculate the duration it takes to close a 311 call request.
- Remove records of erroneous (negative) duration values.
- Create a column with cleaned call (request for assistance) type names.
- Remove null points.
- Perform attribute and spatial selections; select only a subset of columns and then remove points that are outside of New York City.
Once our data is ready, we move to the analytics phase to 1) identify spatial patterns of mean call response time, and 2) measure the longest 311 response times for each call type and identify groups of longest-response-calls types that are near each other in space and time.
Toward fulfilling these two objectives, we aggregate the cleaned data points into hexagonal bins (size = 500 m) with the AggregatePoints tool to understand the spatial extent as well as patterns of mean call response time, which can help understand how quickly calls are assisted by the city authority. Next, we identify significant groups of call types with the longest (more than the mean duration plus three standard deviations) 311 response times using GroupByProximity tool.
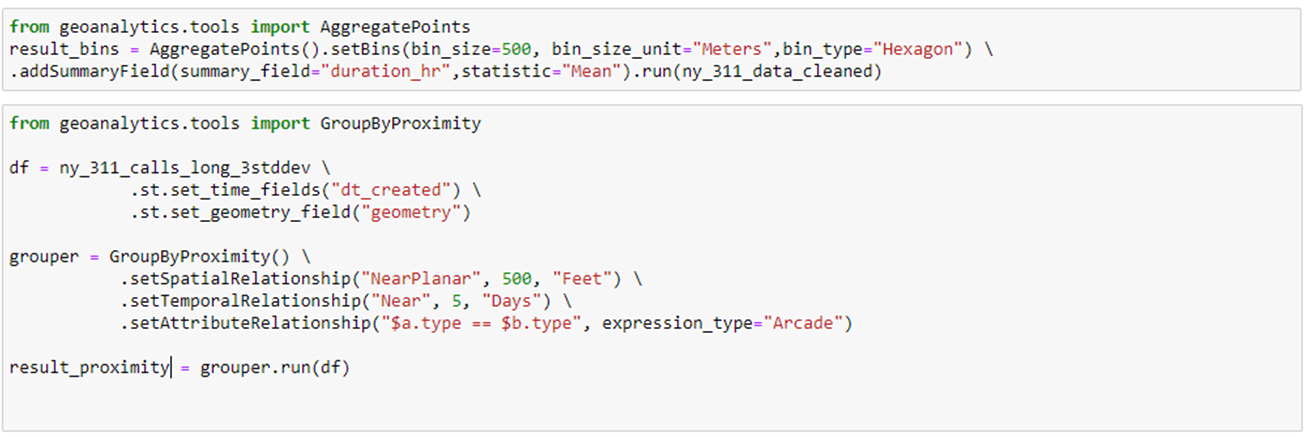
Figure 4 – Example workflow using Aggregate Points and GroupByProximity tools in GeoAnalytics Engine.
We then publish both results as feature layers in ArcGIS Online using ArcGIS API for Python and create thematic maps of mean response times (using standard deviation classification) and call types.
Finally, embed those layers as web maps back in the Amazon EMR notebook environment. Note that some of these visualizations may require installing the notebook locally.
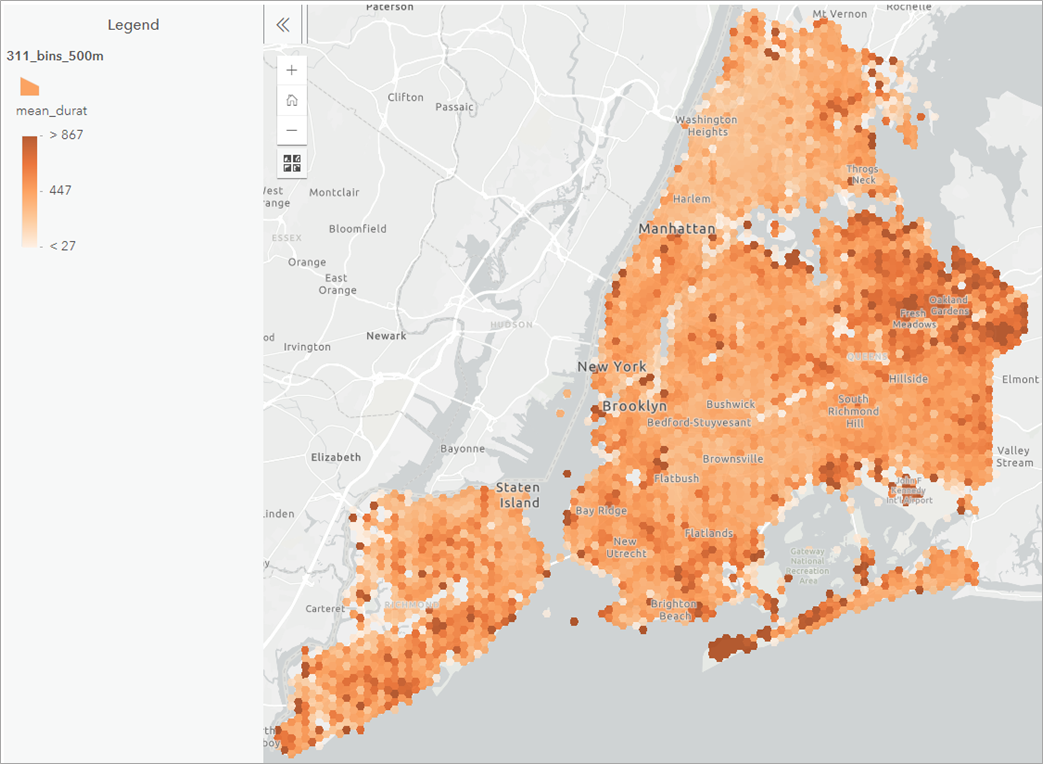
Figure 5 – Spatial patterns of mean call response time aggregated within 500-meter HexBins.
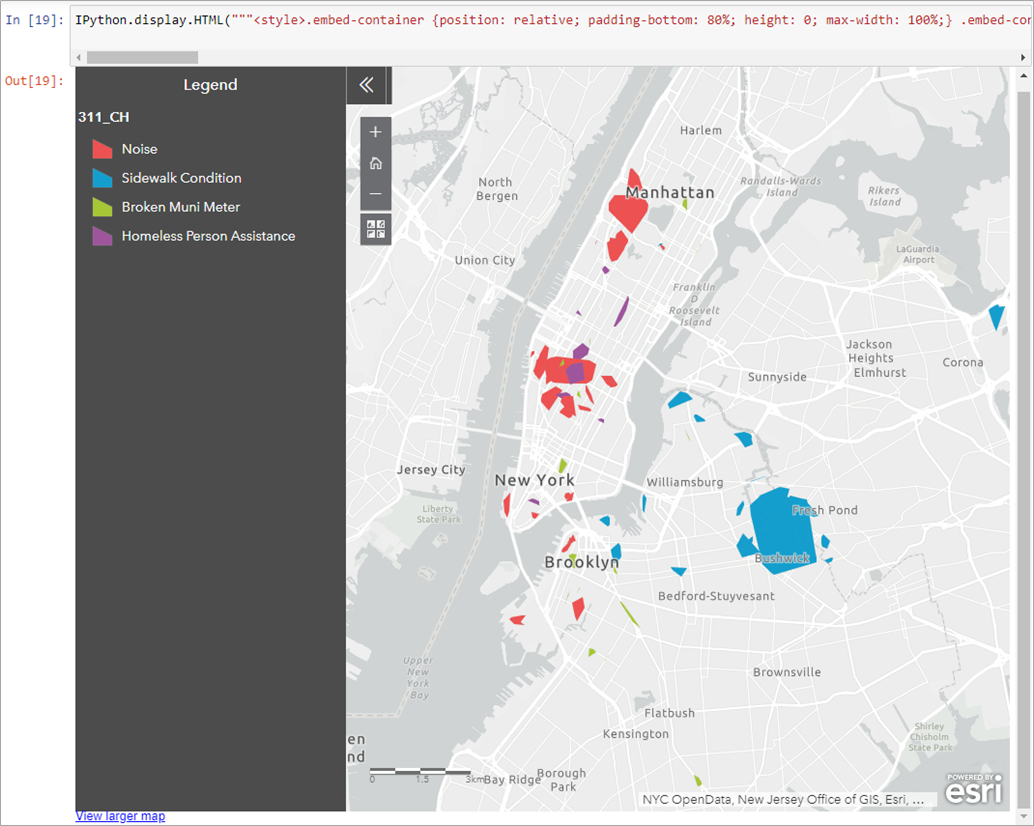
Figure 6 – Spatial patterns of types of call types or ‘assistance requests’ made through 311 calls.
Through these interactive visualizations, we can easily identify where, how quickly, and what types of assistance is provided in New York City. For instance, there are a considerable number of 311 calls about noise around mid- and lower-Manhattan area, whereas calls regarding sidewalk conditions are prevalent around Brooklyn and Queens. These quick data-driven insights can help decision makers initiate actionable measures.
Conclusion
In this post, we deployed an Amazon EMR cluster with Esri’s ArcGIS GeoAnalytics Engine, and now you are able to start analyzing your big data.
The GeoAnalytics use case demo shows a sample GeoAnalytics workflow where the data is being analyzed and visualized in a notebook. Every component of EMR can be fully automated to then take your notebook code and deploy EMR as a transient instance. Users can leverage the code from notebook and use EMR’s “Submit Spark Job” capabilities to run that workflow automatically or as part of a pipeline.
Please reach out to your AWS and Esri account teams for details around the launched features and to understand how they can help solve your business needs. Be sure to check out the AWS Open Data Registry and Amazon Data Exchange for more datasets to explore and correlate.
To contact Esri about getting access to GeoAnalytics Engine, complete the form at the bottom of the product page.
.

.
Esri – AWS Partner Spotlight
Esri is an AWS Public Sector Partner with the AWS Public Safety and Disaster Response Competency. Inspiring positive change in industry and society through mapping and geospatial analytics is at the heart of Esri’s business.