AWS Partner Network (APN) Blog
Integrating Kasten K10 with Amazon GuardDuty for Security Monitoring
By Mike Carcerano, Principal Product Manager – Veeam
By Bill Quigley, Partner Solutions Architect – AWS
By Mike Strossman, Partner Solutions Architect – AWS
 |
| Veeam |
 |
With the ever-increasing amount of data flowing through the cloud, it’s critical to protect against the rising wave of cyber-attacks. The adoption of Security Information and Event Management (SIEM) systems aims to detect these threats in real-time and respond quickly to minimize damage.
Kasten K10 by Veeam makes backing up and restoring data easy in the event of a security breach or unintended or unauthorized data manipulation. It’s a powerful cloud-native application that automates application stack replication to a standby cluster for fast failovers. It also securely replicates backups to off-site storage, protects against broad infrastructure and hardware failures, and provides robust ransomware protection.
K10’s cloud-native philosophy inherently makes it easy to integrate into security monitoring systems without much effort. Security monitoring is an important part of every cloud application, and any third-party application launched in a cloud environment should be able to be easily monitored for any possible threat. K10 is no exception and integrates natively with security monitoring systems such as Amazon GuardDuty by making use of the Kubernetes audit.
In this post, we’ll discuss the Kubernetes Audit and how Kasten K10 natively integrates with it, explore how to configure Amazon GuardDuty, and find K10 events in Amazon CloudWatch logs which GuardDuty pulls from.
Veeam is an AWS Storage Competency Partner and AWS Marketplace Seller that provides a single platform for modernizing backup, accelerating hybrid cloud and securing your data.
Amazon GuardDuty
GuardDuty is a security monitoring service provided by Amazon Web Services (AWS) that analyzes activity within your account from a multitude of data sources, and provides security correlations based on a set of finding types for each of these.
The one we’re most concerned about in this context is the Amazon Elastic Kubernetes Service (Amazon EKS) control plane logs which gather the Kubernetes audit logs to help protect and detect suspicious activity within your clusters.
When you start a cluster in Amazon EKS, it passes an audit policy that gathers logs from all registered API groups and flows them directly into Amazon CloudWatch. From there, you can export your data to other third-party software.
You can view the list of Kubernetes audit finding types that EKS protection for GuardDuty provides for threat detection within your clusters. If one of these types is triggered, you’ll see a finding in your GuardDuty dashboard with more information on what caused it. We’ll take a look at this in the sections below.
Kubernetes Audit and Kasten K10
All activity that’s processed by the kube-apiserver can be logged into an audit event type which can be used for security monitoring. This means any calls to the core Kubernetes API, or to an extended API setup via the aggregation layer, could be logged.
The criteria for logging events is based on the audit policy that’s supplied to the server on startup. In a managed service such as EKS, you cannot customize the server, but the generated audit policy file for EKS pulls all registered API groups and logs them at the metadata level. For more information on the Kubernetes audit, see the documentation.
Configuring your cluster’s audit log will depend on your Kubernetes distribution. For example, when deploying with k3d, use the following flags to launch the kube-apiserver with a log audit backend:
There are two backend types for the kube audit: log and webhook. The log backend logs the audit event locally and is ephemeral, while the webhook backend allows you to send the data to an external server. Extra options are provided for each type for flexible configuration but must be passed in as flags to the kube-apiserver on startup, something you may not have access to depending on where your clusters are deployed.
The kube audit is extendable, meaning you can write new backends if they implement the backend interface and pass them to extended API servers to add functionality as to where the audit data is sent.
The audit event type logs at four different levels: None, Metadata, Request, and RequestResponse. All of these add more information to the event object that’s logged, culminating in the full request and response body logged in the RequestResponse level. There is a potential scalability issue depending on how open the audit policy is, how big each audit event object is (Metadata vs. RequestResponse), and backend type.
Metadata provides the best balance between information for threat detection and scalability, with an example for getting a K10 passkey object shown:
You can see the sourceIPs, userAgent, and user being provided. Some Kubernetes managed service providers will add extra information such as credentials, which we’ll show in the below section as applies to Amazon EKS.
For a self-deployed Kubernetes cluster, a good policy to include all current K10 groups and resources would be the following:
We don’t include the list verb as the user interface (UI) makes many calls that can quickly overwhelm the logs. Some of the groups have the resources listed, and these can be easily changed to only show what you’re interested in.
They also all are shown at the Metadata level, but some could be added at the RequestResponse level to show the request and response body if interested in capturing that level of detail, such as in the upcoming event custom resource.
How K10 Activity Gets Captured by the Kube Audit
There are many custom resources that power K10, created either via a Custom Resource Definition or the Aggregated API.
The API groups and associated resources created by the CRD’s are:
And those created from the Aggregated API:
You can see a list of these by running kubectl get apiservice | grep kio.kasten.io which will also show you the version and how they were created.
No matter how these custom resources are interacted with, the interaction is processed through the kube-apiserver. This flow creates an audit event based on the criteria set forth in the audit policy and flags passed to the kube-apiserver, such as which backend type to use, log or webhook, and configurable options for each.
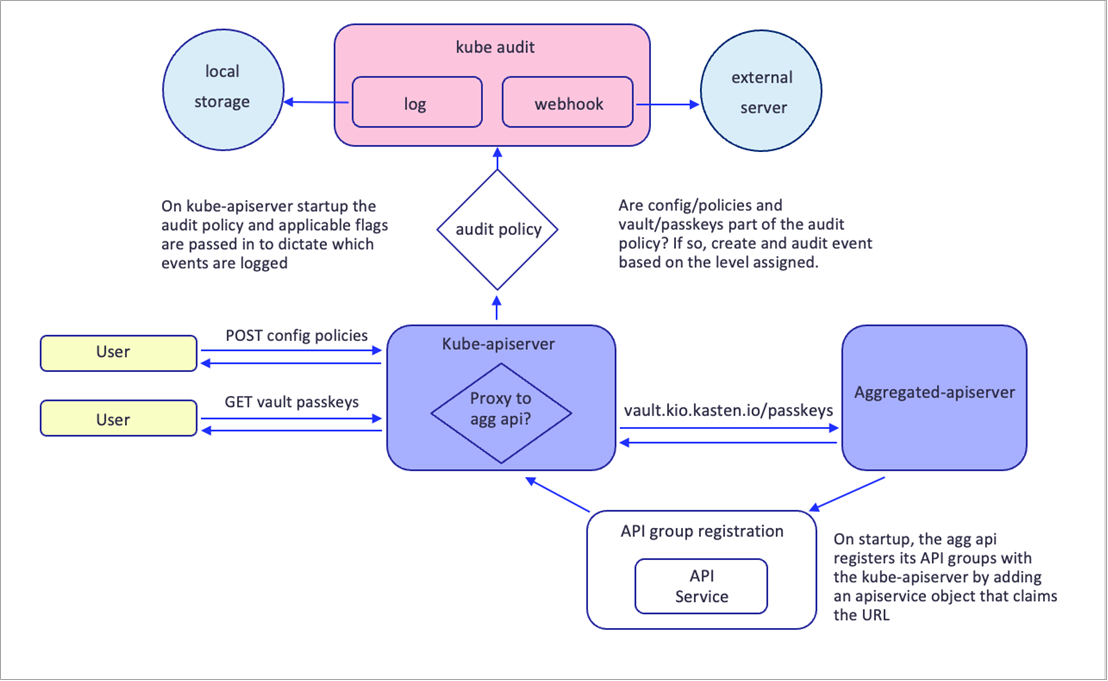
Figure 1 – Kubernetes auditing flow.
This means all external interactions with K10 natively leverage the Kubernetes audit, and any security monitoring system that uses it as a data source can be used to monitor K10 for security.
Activity within K10 that does not relate to a custom resource will not be logged by the kube audit, since these were never processed by the kube-apiserver and thus were not related to the core Kubernetes API, or extended APIs via the aggregation layer.
Since this will be a custom resource created by the Aggregated API, all activity will flow through the kube-apiserver and allow for the creation of audit events per the audit policy.
To get more specific information about each of these internal events, the audit event level would need to be Request or RequestResponse. This implies that managed services such as EKS will not log this information, and an extended backend will need to be built within K10 that provides this functionality.
Technical Quick Start Guide
Check out this how-to guide to see how you can deploy Amazon GuardDuty in conjunction with Kasten by Veeam’s K10 to monitor your cluster’s posture.
Conclusion
Data protection and management is at the core of Kasten K10 by Veeam, and its resulting architecture makes it a cloud-native application which natively integrates into Amazon GuardDuty.
To achieve this, it leverages the Kubernetes audit logs that are generated when requests come through the kube-apiserver; these requests are made on K10 custom resources that were created via CRD’s and the Aggregated API.
Out of the box, K10’s architecture enables customers to leverage GuardDuty for protection with as little as a few clicks.
Kasten by Veeam is a leader in Kubernetes backup and disaster recovery. Kasten K10 helps enterprises overcome Day 2 data management challenges to confidently run applications on Kubernetes. For additional information visit the Kasten website, and explore the latest release of Kasten K10 backup and migration resources.
You can also learn more about Veeam in AWS Marketplace.
.

.
Veeam – AWS Partner Spotlight
Veeam is an AWS Storage Competency Partner that provides a single platform for modernizing backup, accelerating hybrid cloud and securing your data.
Contact Veeam | Partner Overview | AWS Marketplace | Case Studies