AWS Partner Network (APN) Blog
Monitoring Kubernetes Environments with AWS and New Relic’s Cluster Explorer
By JF Joly, Product Manager for Kubernetes at New Relic
 |
Over the past few years, Kubernetes has solidified itself as a pivotal tool at thousands of organizations that have adopted container-based application architectures.
Kubernetes provides development teams with the tools and capabilities they need to deliver real customer value in far shorter time than more traditional architectures.
However, as these customers start to operate their Kubernetes environments at scale, it becomes more complex and requires special focus on monitoring for performance and health.
In this post, I will explain a few of the challenges with monitoring Kubernetes environments at scale, and show you how to implement monitoring with the New Relic Cluster Explorer that is included with the Kubernetes integration.
New Relic is an AWS Partner Network (APN) Advanced Technology Partner with the AWS Container Competency. New Relic helps customers to monitor applications and infrastructure performance so they can quickly resolve issues and improve digital customer experiences.
Challenges
Before we dive into the implementation, let’s first understand some of the challenges and questions faced by customers when running Kubernetes at scale.
As a Kubernetes environment scales and becomes more complex, it gets harder to answer some very basic—but very important—questions: What is the health of my cluster? What is the hierarchy and the health of the elements (nodes, pods, containers, and applications) within my cluster?
At Amazon Web Services (AWS), it’s essential for customers to have the tools they need to get useful answers to these questions. This enables organizations to take a proactive approach to monitoring the health and performance of their Kubernetes environments—at any scale and at any level of complexity.
There’s also the question of how teams can adapt and adjust their troubleshooting processes as a Kubernetes environment continues to scale. It can already be difficult to untangle the dependencies between applications and infrastructure; or to drill down into and navigate all of the entities—containers, pods, nodes, deployments, namespaces, and so on—that may be involved in a troubleshooting effort.
As complexity increases, so does the effort and expense required to find and fix problems—ideally, before they impact customers.
Addressing these questions quickly and consistently is key to helping ensure customers are successful at running their Kubernetes workloads on AWS. This is where the New Relic and AWS partnership becomes so critical.
While a managed Kubernetes service like Amazon Elastic Kubernetes Service (Amazon EKS) frees you from having to manage infrastructure, the ephemeral nature of applications deployed to a Kubernetes clusters means you need advanced monitoring at the cluster, node, pod, container, and application levels.
The New Relic Kubernetes cluster explorer gives you these infrastructure-centric and application-centric views into your clusters. Monitoring Kubernetes running AWS environments with New Relic provides total visibility, alerting, and dashboards for all Kubernetes entities that live among your applications.
Let’s dive into New Relic’s Cluster Explorer to see how it can help customers address these questions and challenges.
New Relic Cluster Explorer
The New Relic Cluster Explorer provides a multidimensional representation of a Kubernetes cluster. It allows teams to drill down into Kubernetes data and metadata in a high-fidelity, curated user interface that simplifies complex environments.
Teams can observe performance and dependencies across Kubernetes environments, and can troubleshoot failures, bottlenecks, and other abnormal behavior.
Figure 1 below shows an example of how teams can quickly drill down into the details of their pods without losing context of the cluster as a whole.
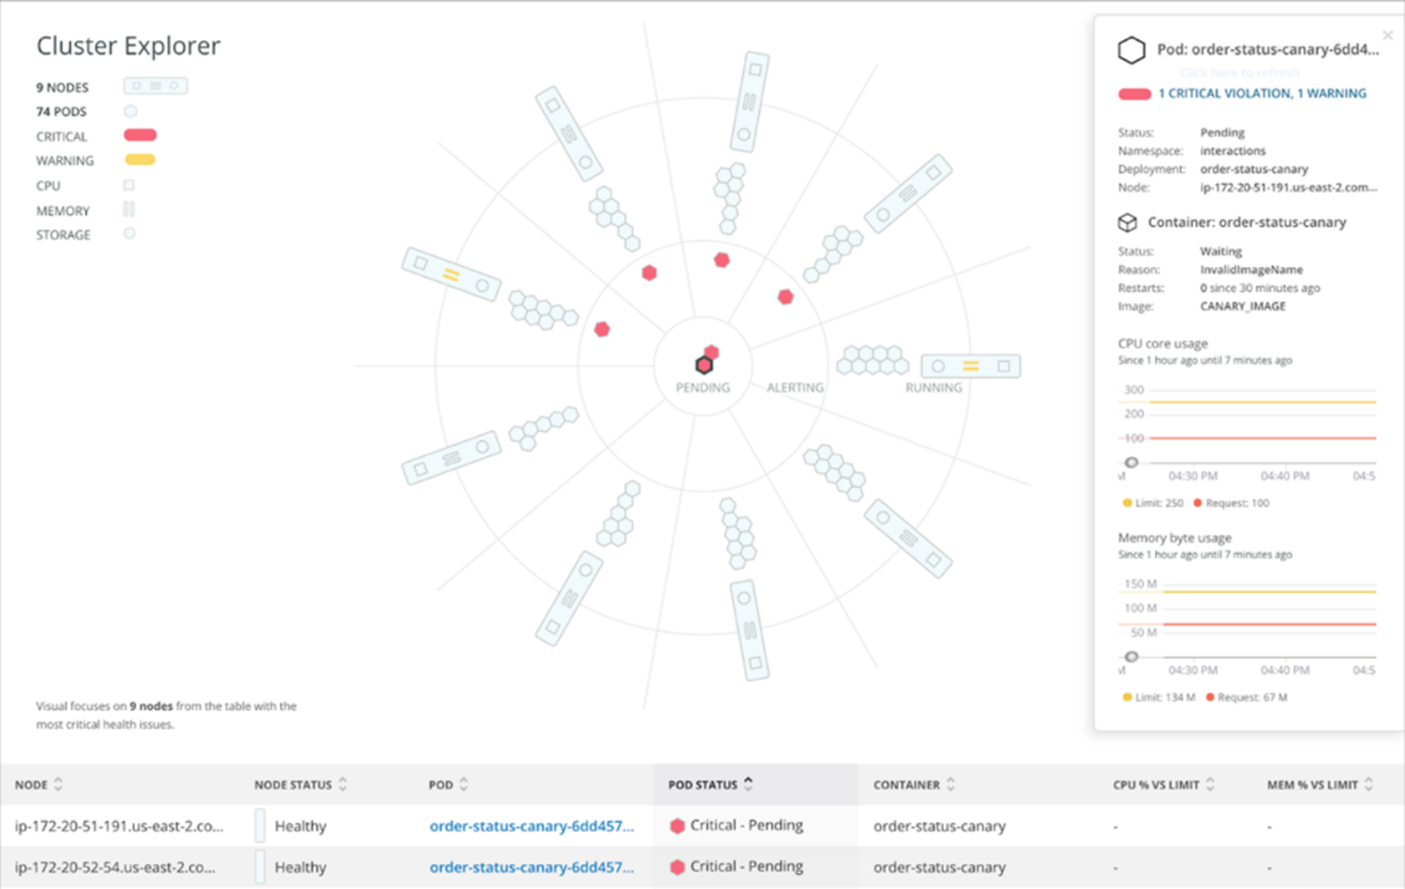
Figure 1 – See at-a-glance details of your cluster and pods.
Additionally, by monitoring Kubernetes events, New Relic customers are able to correlate the health status of their Kubernetes cluster and objects with the events in Kubernetes for faster troubleshooting and issue resolution.
This means users can proactively set up alerts on Kubernetes events to resolve an issue before it affects the availability and performance of their services to truly understand the impact of events.
In Figure 2, you can see an example of how to select a pod within your cluster and see the number of events related to it, as well as greater detail using the “Show Pod Events” option.
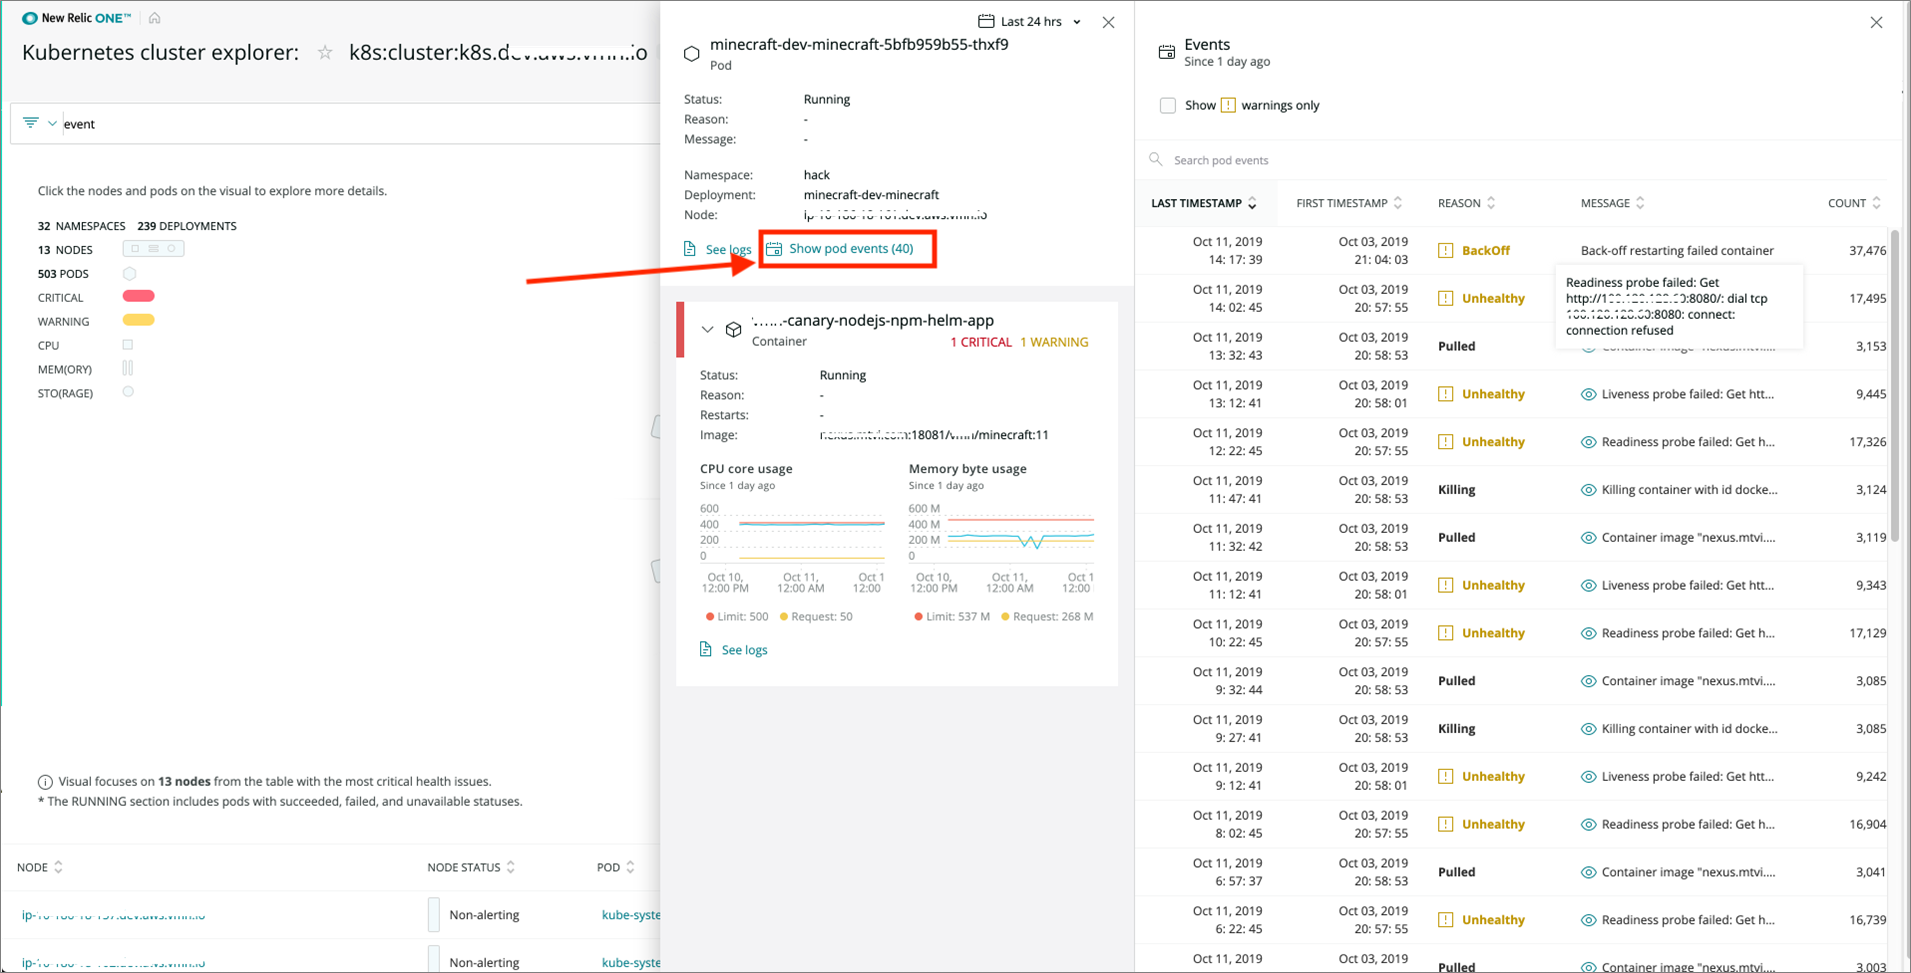
Figure 2 – Quickly see events related to a pod.
This powerful monitoring is quick and easy for customers to get up and running. By leveraging these solutions, you can quickly and gain immediate insights into how your applications and infrastructure are running on Kubernetes.
Prerequisites
Before continuing, you will need to either have an existing New Relic account, or sign up for a free one. The steps in this post will leverage the “License Key” provided with your account.
Also, for the sake of this post, we’ll be leveraging eksctl (a tool to make it easier to spin up and manage an EKS cluster) and kubectl, which will need to be installed and configured to complete the instructions below.
For instructions on how to install these binaries, visit the Getting Started with kubectl Guide.
Creating an Amazon EKS Cluster and Nodes
The first thing we’ll need to do is create an Amazon EKS environment using eksctl. To do this, run the following command:
This will take 10-15 minutes to get up and running. During this time, eksctl will create an EKS cluster named “eks-newrelic-cluster” at Kubernetes version 1.14. It will also create a nodegroup with three worker nodes. We’ll be installing the New Relic Cluster Explorer as a daemon set on those nodes later.
You can test that the cluster is available using the following command:
kubectl get svc
This should show you something similar to the following output:
NAME TYPE CLUSTER-IP EXTERNAL-IP PORT(S) AGE
svc/kubernetes ClusterIP 10.100.0.1 <none> 443/TCP 1m
Next, we can test to see if our nodes are up and connected to the cluster:
kubectl get nodes
This should return three nodes:
NAME STATUS ROLES AGE VERSION
ip-192-168-15-201.us-west-2.compute.internal Ready <none> 2d5h v1.13.8-eks-cd3eb0
ip-192-168-68-163.us-west-2.compute.internal Ready <none> 2d5h v1.13.8-eks-cd3eb0
ip-192-168-82-10.us-west-2.compute.internal Ready <none> 2d5h v1.13.8-eks-cd3eb0
When the nodes show a “Ready” status, you’re ready to install the New Relic components.
Installing New Relic Kubernetes Integration
You can read the full instructions, but the Amazon EKS pertinent instructions are below.
First, install kube-state-metrics and get it running on the cluster. For example, for version, 1.7.2:
curl -L -o kube-state-metrics-1.7.2.zip https://github.com/kubernetes/kube-state-metrics/archive/v1.7.2.zip && unzip kube-state-metrics-1.7.2.zip && kubectl apply -f kube-state-metrics-1.7.2/kubernetes
Next, download the integration configuration file:
curl -O https://download.newrelic.com/infrastructure_agent/integrations/kubernetes/newrelic-infrastructure-k8s-latest.yaml
In the configuration file, add your New Relic license key and a cluster name to identify your Kubernetes cluster. Both values are required.
env:
- name: NRIA_LICENSE_KEY
value: YOUR_LICENSE_KEY
- name: CLUSTER_NAME
value: YOUR_CLUSTER_NAME
It’s recommended you do not change the NRIA_PASSTHROUGH_ENVIRONMENT or NRIA_DISPLAY_NAME value in your configuration file.
Using kubectl, confirm that kube-state-metrics is installed:
kubectl get pods --all-namespaces | grep kube-state-metrics
Next, create the daemon set:
kubectl create -f newrelic-infrastructure-k8s-latest.yaml
Confirm the daemon set has been created successfully by looking for newrelic-infra in the results generated by this command:
kubectl get daemonsets
To confirm the integration has been configured correctly, wait a few minutes and then run this New Relic Insights query to see if data has been reported:
SELECT * FROM K8sPodSample since 1 day ago
Exploring the Cluster Explorer
Now that you have the New Relic Kubernetes integration installed, you can start monitoring your cluster within the Cluster Explorer.
Log into your New Relic account and go to the Kubernetes tab. You should now see the Cluster Explorer.
The Cluster Explorer employs a distinctive design that shows the entire cluster. It can easily shift its focus to hotspots within the cluster, though, with the most critical elements appearing in the middle. It visualizes the cluster as a series of four concentric rings:
- The outer ring shows the nodes of the cluster, with each node displaying CPU, memory, and storage performance metrics that provide an at-a-glance understanding of the node’s overall health.
- The next ring reveals information about the distribution and status of the pods associated with a selected node.
- The third ring displays pods that have breached an alerting threshold—indicating that these pods may have health issues even if they are still running.
- Finally, the inner ring displays pods that are not running or that Kubernetes is unable to schedule—due to a lack of resources, for example, or because the wrong container image was specified.
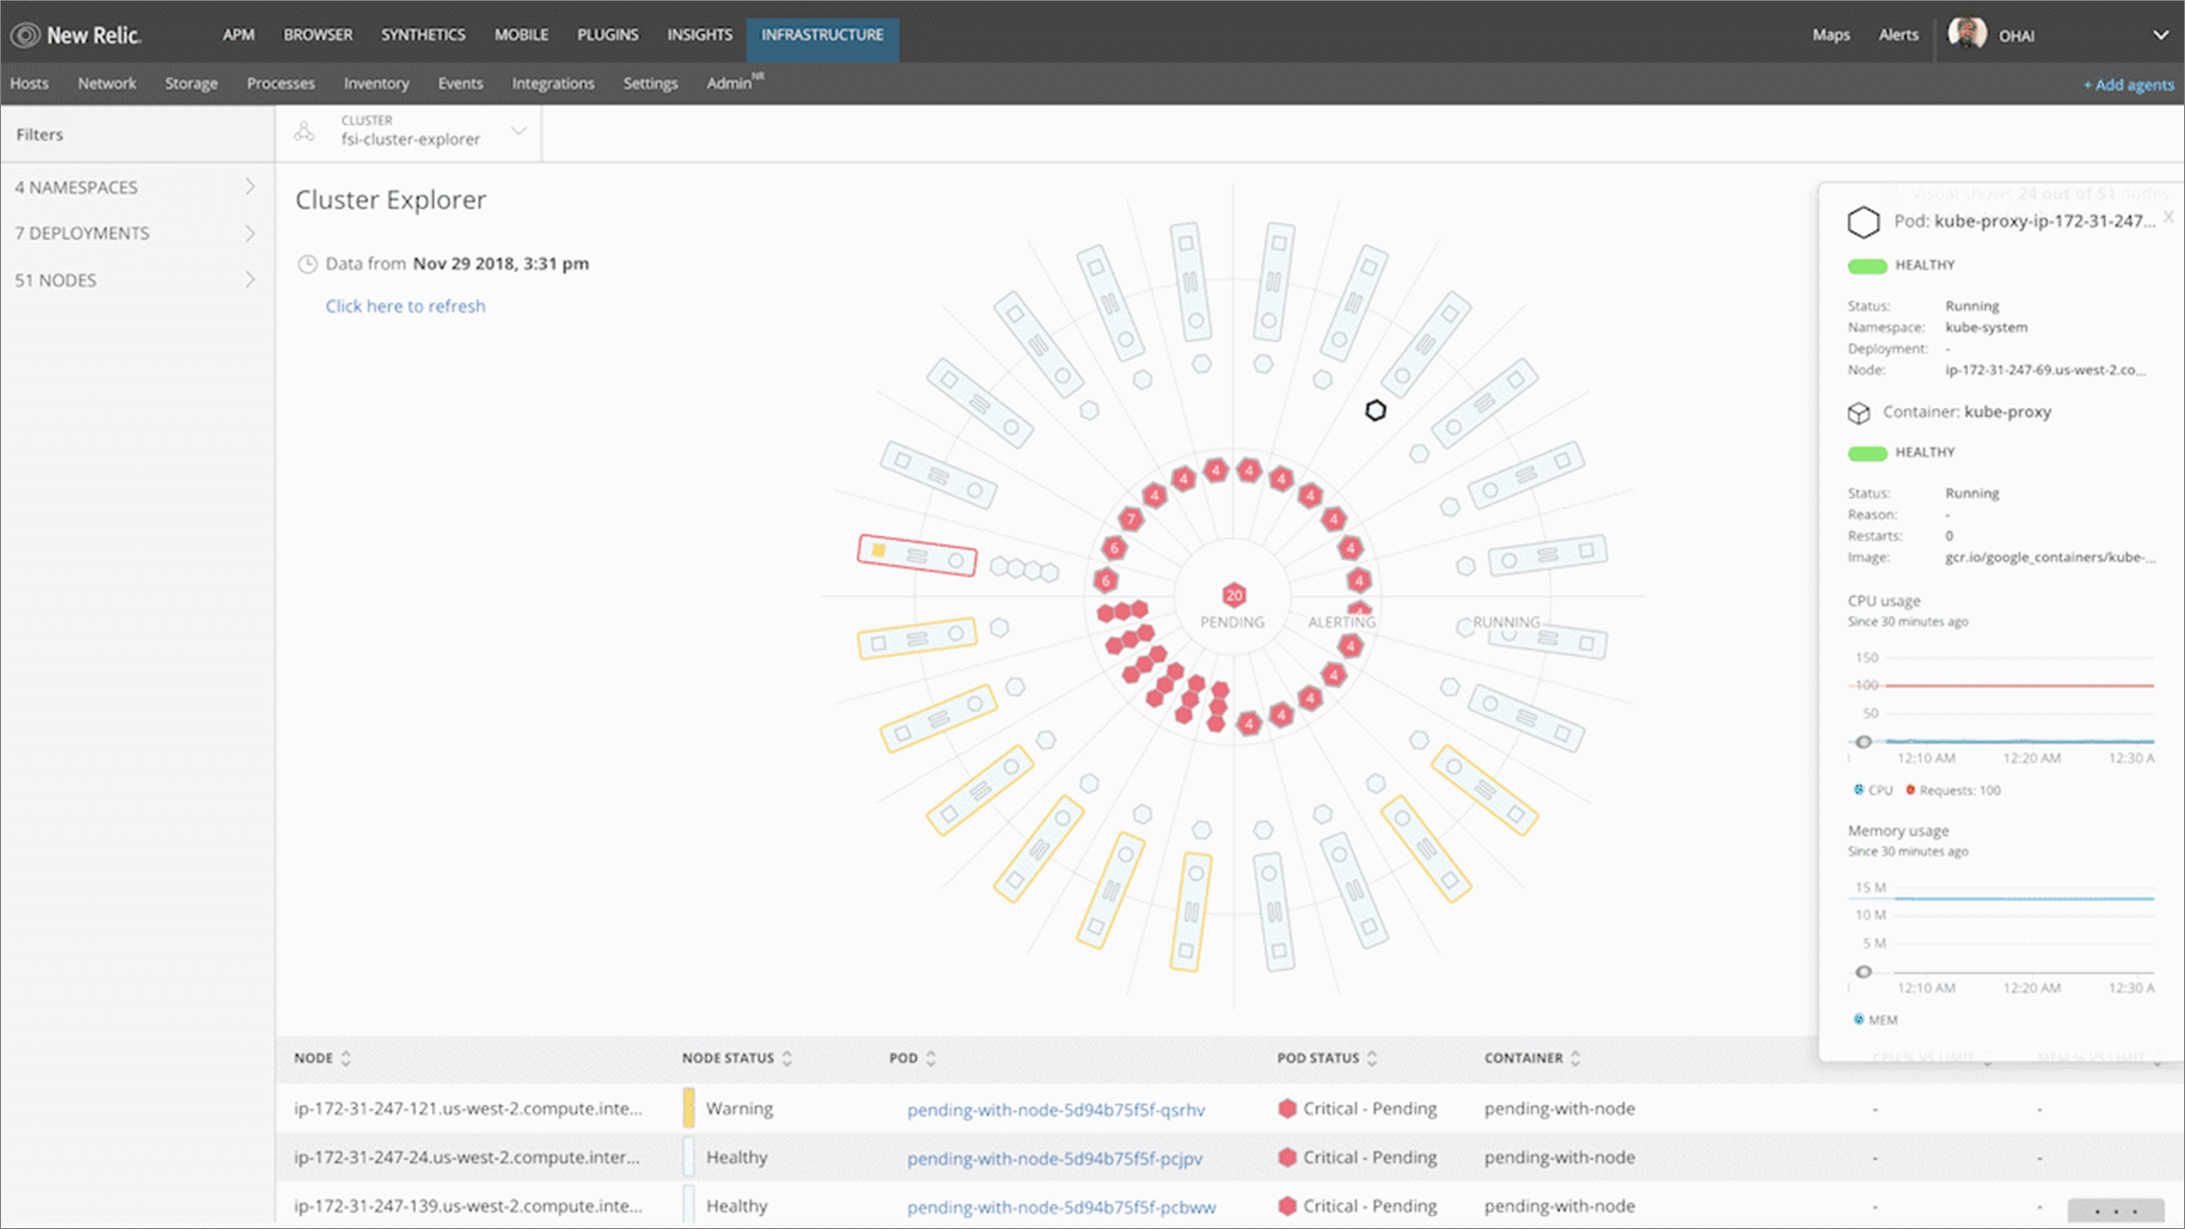
Figure 3 – Visualizing your entire cluster lets you see hot spots that may need your attention.
The Cluster Explorer allows you to drill down almost instantly into relevant and highly detailed low-level metrics. It also has the ability to display application and infrastructure metrics and objects side-by-side, scoped to the context of a specific Kubernetes node, pod, or container, or of a specific application transaction trace.
No matter what role a team members plays, the curated user experience and visualizations in Cluster Explorer are powerful and intuitive and can provide value in different ways in a variety of situations.
Tearing it All Down
After you’re done exploring the New Relic Cluster Explorer, you can run the following command to de-provision the resources you spun up to prevent any unwanted expenses from your testing:
eksctl delete cluster --name=eks-newrelic-cluster
The nodegroup will have to complete the deletion process before the EKS cluster can be deleted. The total process will take approximately 15 minutes, and can be monitored via the AWS CloudFormation Console.
More Clusters to Explore
New Relic is dedicated to providing the most comprehensive and robust monitoring possible. Which is why we have extended the capabilities of the cluster explorer to include Prometheus and logging.
Prometheus OpenMetrics Integration
The New Relic Prometheus OpenMetrics integration collects metrics from endpoints compatible with the Prometheus standard, and enables customers to collect metrics from hundreds of services, including the Kubernetes ecosystem.
For any teams running Prometheus, this means there’s no longer the context-switching, nor is there a need to manage Prometheus servers anymore.
To install the Prometheus OpenMetrics integration, follow these steps and see the documentation:
- Download the yaml file.
- Update LICENSE_KEY and cluster_name.
- Comment out the except block to capture all metrics.
- Optional: add pod label prometheus.io/scrape=true, and the New Relic Prometheus integration will pick it up (most services already set this flag).
- kubectl apply -f nri-prometheus.yaml
In Figure 4, you see an example of the Prometheus OpenMetrics integration using data pulled directly from the cluster.
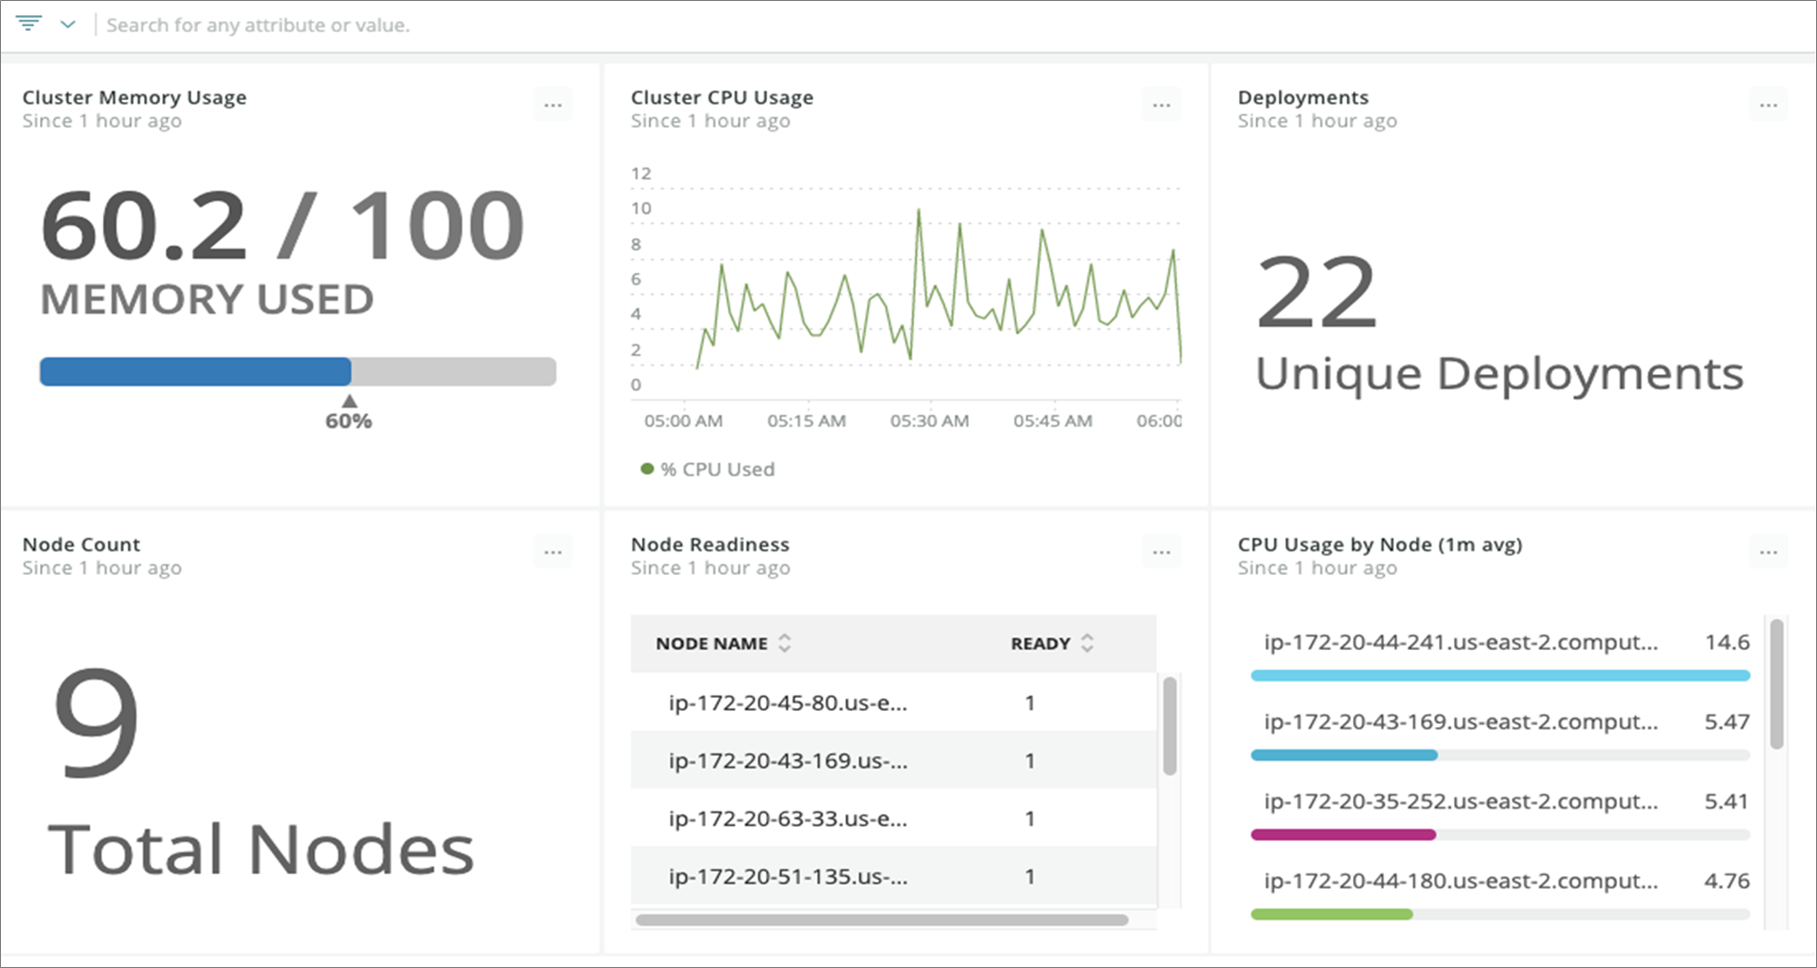
Figure 4 – Prometheus OpenMetrics integration allows you to visualize metrics related to your cluster.
Logs in Context
The addition of New Relic logs allows users to bring all Kubernetes data together into one view.
Available in the Kubernetes Cluster Explorer side pane, the logging feature provides a near-instant search with full contextual log information. Logs in context then correlates log messages with application, infrastructure, Kubernetes and events data.
This gives teams end-to-end visibility, as well as a level of depth and detail that simply isn’t available when you work with siloed sources of log data.
To install logging, follow these steps and see the documentation:
- Install the New Relic Fluent Bit output plugin for Kubernetes
- Update LICENSE_KEY
- kubectl apply -f
In Figure 5, you can see that by clicking the “See Pods” link from the detail view of a pod in the side pan, you can quickly search the logs related to that pod.
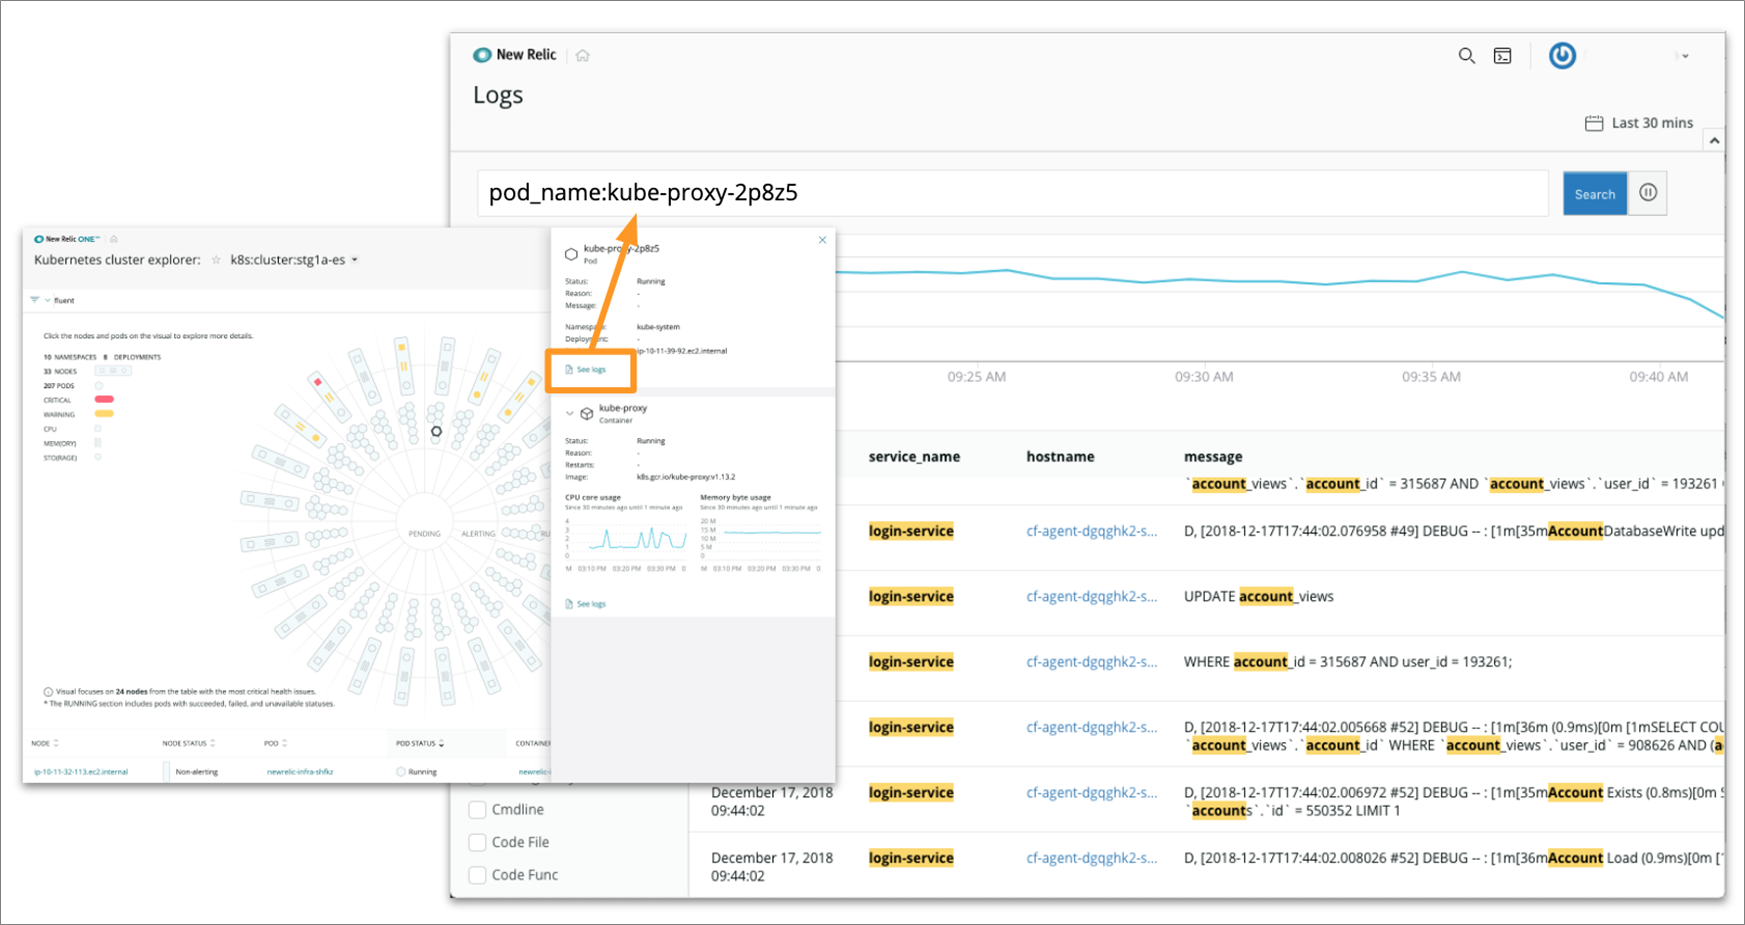
Figure 5 – Search logs quickly with full contextual log information.
Summary
The New Relic Cluster Explorer is a powerful feature that provides immediate and valuable insights into a customer’s Kubernetes workloads.
With minimal configuration, you are able to see where issues might exist within your environments and applications and start taking action quickly to address and mitigate them before they impact customers.
In today’s increasingly competitive business landscape, this can make a real impact on both the short and long-term success of a business.
AWS Quick Starts
The walkthrough I’ve shared in this post is great for testing on an example cluster, but many of you may be just getting started and want to get up and running using a best-practices approach.
To help support this, New Relic and AWS have created a Quick Start for deploying New Relic Infrastructure on AWS, which includes the New Relic Cluster Explorer. AWS Quick Starts reduce hundreds of manual procedures into just a few steps, so you can build your production environment quickly and start using it immediately.
This reference deployment uses the Amazon EKS Architecture Quick Start as a foundation to provide a fully managed, highly available, and certified Kubernetes-conformant control plane.
The content and opinions in this blog are those of the third party author and AWS is not responsible for the content or accuracy of this post.
.

.
New Relic – APN Partner Spotlight
New Relic is an AWS Container Competency Partner. They help customers to monitor applications and infrastructure performance so they can quickly resolve issues and improve digital customer experiences.
Contact New Relic | Solution Overview | AWS Marketplace
*Already worked with New Relic? Rate this Partner
*To review an APN Partner, you must be an AWS customer that has worked with them directly on a project.