AWS Partner Network (APN) Blog
Monitoring the Health of Amazon Lightsail Instances with Datadog
By Ryan Warrier, Product Manager – Datadog
By Igor Alekseev, Partner Solutions Architect – AWS
 |
| Datadog |
 |
Amazon Lightsail is a virtual private server (VPS) provider and the ideal service for simple workloads, quick deployments, or when getting started on Amazon Web Services (AWS).
For example, with Lightsail you can easily create custom web sites with instances preconfigured with WordPress, Magento, Prestashop, or Joomla. You can also launch environments preconfigured for popular development stacks like LAMP, Nginx, and MEAN, or common database engines.
For more advanced architectures, load balancing and containers are available with Lightsail. Regardless of your architecture complexity, as you productionize your Lightsail workloads there is an increased need for comprehensive and in-depth monitoring.
Datadog is an AWS Partner that provides a monitoring and security platform for cloud applications. Datadog’s software-as-a-service (SaaS) platform integrates and automates infrastructure monitoring, application performance monitoring, and log management to provide unified, real-time observability of a customers’ entire technology stack.
In this post, we’ll explore how monitoring Lightsail workloads with Datadog can help you ensure application performance and control costs.
Importance of Monitoring Lightsail
Monitoring the health and performance of your Lightsail infrastructure has a number of benefits. First and foremost, it helps prevent downtime and customer disruptions to your applications, and can reduce the mean time to recovery (MTTR) when issues do occur.
Secondly, because AWS gives customers the ability to scale up and down their compute and storage in response to business demand, monitoring enables customers to take advantage of cost-saving measures while helping understand and plan for future capacity needs.
Lightsail provides a variety of instance types which vary in their memory, storage, processing, and transfer capabilities. Right-sizing is the process of picking the right instance to optimize your costs while making sure not to run out of resources so your application performance suffers. It’s an ongoing process, and resources that closely match your workload today may become overprovisioned tomorrow.
Monitoring is essential to right-sizing, and it’s important to monitor your Lightsail instances continuously and over a longer period of time, as seasonal patterns may emerge that will help scale up/down your instances.
Using this information, you might scale up by adjusting your instance plan without changing your architecture, or alternatively might be at the point where you should consider introducing a load balancer. Monitoring your instances gives you a better view of your application’s current performance and better prepare you for the future challenges.
Tracking Key Metrics with the Datadog Agent
Using Datadog, you can easily monitor all of the important utilization metrics for your Lightsail instances: CPU, memory, storage, and data transfer. All of these resources are limited based on your Lightsail instance plan, and can have significant application performance implications if utilization nears or exceeds the plan limits.
The easiest way to monitor these key metrics is with the Datadog Agent. This is a lightweight open-source software you can directly install on your instances which aggregates observability data (metrics, logs, events, traces) and makes it available to you in the Datadog app. The Agent comes with over 50 metrics enabled by default at 15-second granularity, including the ones most important to monitoring Lightsail.
For tracking total CPU utilization, you will want to look at several Datadog metrics:
system.cpu.system– % CPU spent running the kernel.system.cpu.user– % CPU spent running user processes (your app, for example).system.cpu.iowait– % CPU spent waiting for I/O operations to complete.system.cpu.stolen– % CPU spent waiting for the hypervisor to service another virtual CPU.
Datadog gives you a detailed breakdown of what your CPU is spending time on, so summing those metrics together gives you a composite overall CPU utilization percentage. You can then use that to know if you’re underutilizing your processing capacity on your Lightsail instance.
For tracking memory usage, the key metric you will want to observe is system.mem.pct_usable. This metric shows the fraction of RAM unused and is the one to use to alert you if the amount of available memory goes below a certain threshold.
For disk space, the system.disk.in_use metric indicates the fraction of total storage being utilized. It’s important to make sure this value stays <1, as that would indicate you have used up your allotted storage space and will now be charged overage.
Finally, to monitor data transfer quotas, you’ll want to look at the system.net.bytes_rcvd and system.net.bytes_sent metrics which track the number of bytes per second received by and sent from your Lightsail instance, respectively. Summing these two metrics together and doing a roll-up over a longer period of time can help you determine if you’re going to exceed the allotted data transfer limit for your current instance plan.
Monitoring in the Datadog App
Now that we know about the Datadog Agent and some of the key metrics, let’s see how you can use Datadog’s application to monitor Lightsail instances.
Once the agent is installed, a good place to start is the infrastructure list. Here, you can see a high-level overview of all your monitored Lightsail instances. You can filter the list of instances by specific attributes or custom tags, and can sort by CPU metrics such as overall percentage utilization or percent of I/O wait time. You can also see any other additional integration you added to monitor specific workloads running on your Lightsail instances.
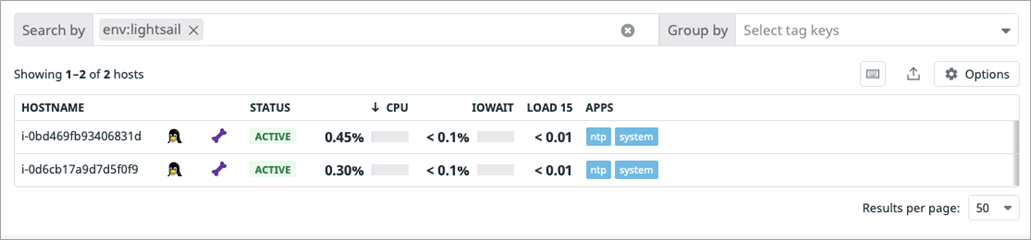
Figure 1 – Infrastructure list.
For any specific instance, you can click on it to drill down into more details about the instance specifications.
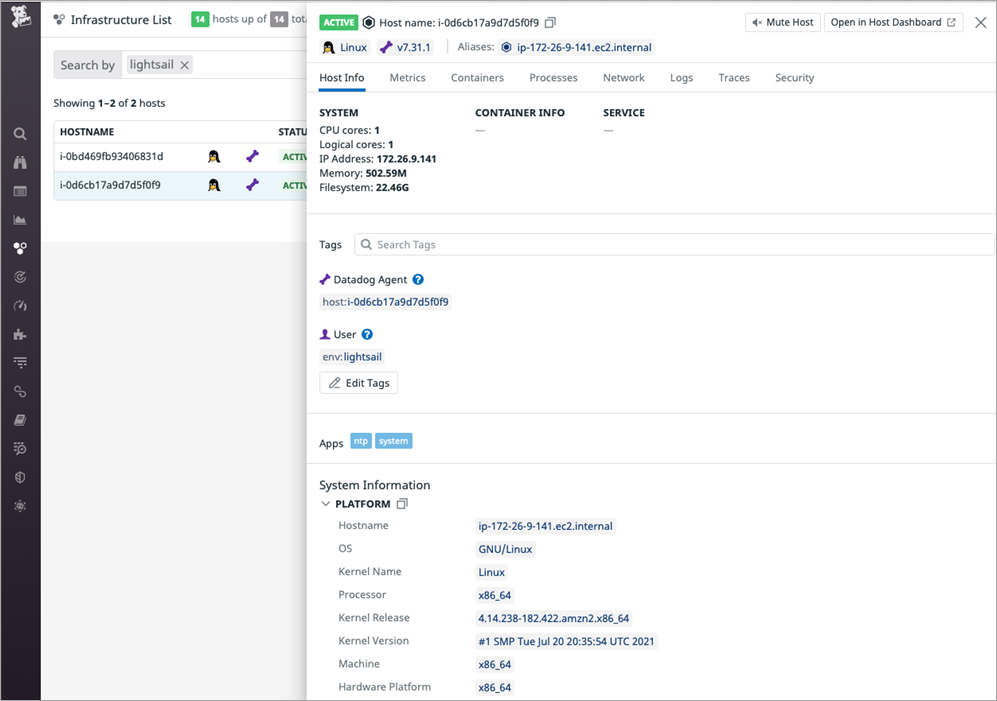
Figure 2 – Host details.
You can also open a prebuilt “Host Dashboard” that graphs many of the key metrics discussed earlier with no additional configuration needed.
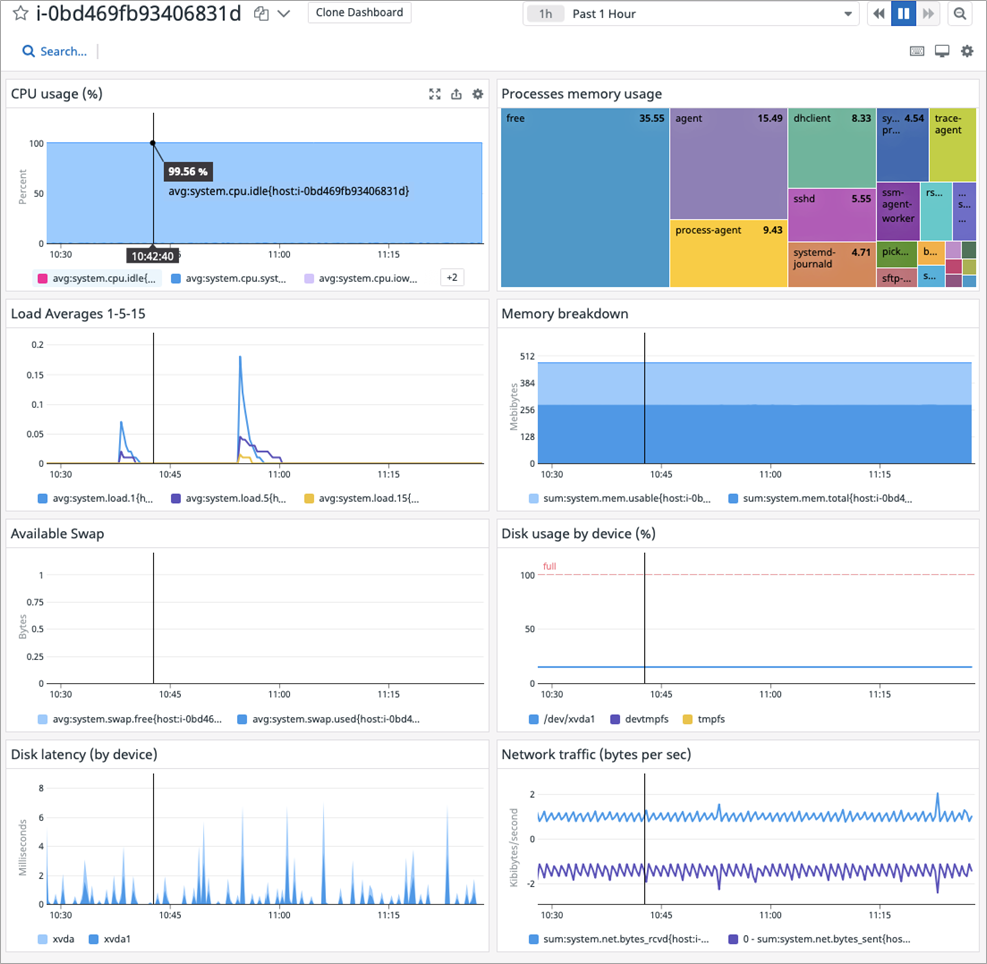
Figure 3 – Host dashboard.
If you find the pre-built dashboard doesn’t show what you want, or is too overwhelming, you can easily clone and then customize the dashboard with easy drag-and-drop widgets and no coding or special language required.
A common customization is to make a dashboard that gives an overview of the health across all instances and not just a single instance.
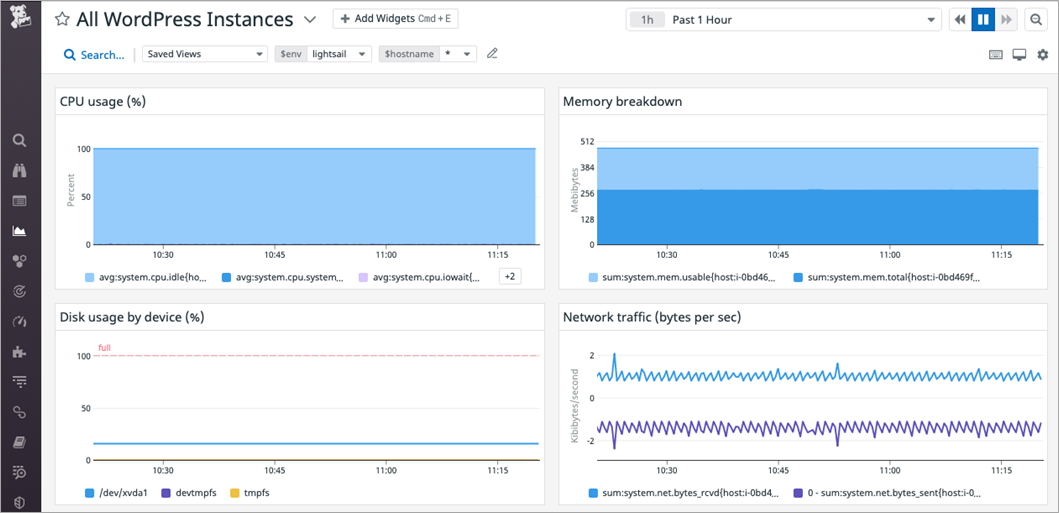
Figure 4 – Custom dashboard example.
Once you have the right level of visibility into the key metrics on your Lightsail instances, you’ll want to make sure you can be alerted if any key resource consumption metrics are too high for any of your instances. You can accomplish that easily by creating Datadog metric monitors.
Below is a sample monitor you could create around system.mem.pct_usable.
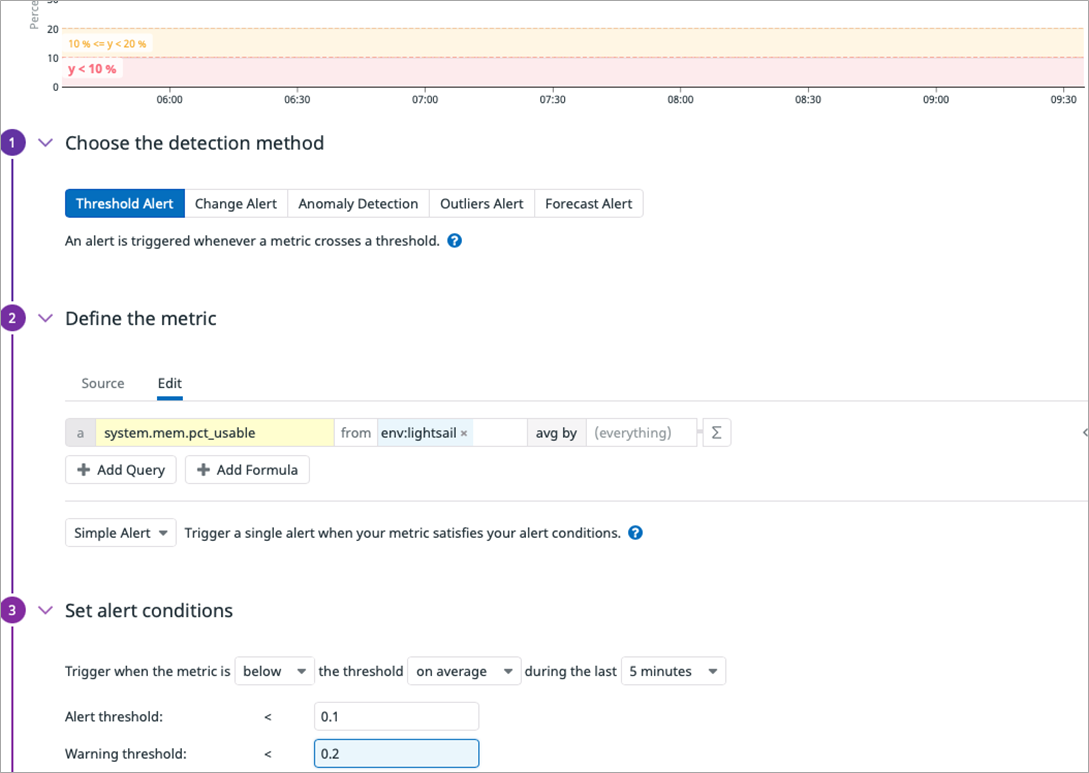
Figure 5 – Monitor creation.
You can set a warning threshold of <0.2 to let you know there was less than 20% of allocated memory available on average over the past five minutes, and an alert threshold of <0.1 for when it’s in the danger zone. You can then customize who and when to notify team members when the warning or alert threshold is reached.
Monitoring Lightsail at Greater Depth
What we covered in this post are the essentials for monitoring the health of your Lightsail instances with Datadog, but there is a lot more you may want to monitor as you scale up your Lightsail usage.
Datadog has over 500 integrations with the most popular software and vendors so you can directly monitor what you are running on Lightsail. For example, if you’re running software such as MySQL, PostgreSQL, or Nginx on Lightsail, Datadog has out-of-the-box integrations you can configure via the Agent to collect key metrics and logs from those services to ensure their performance.
Additionally, you could use Datadog’s powerful Application Performance Monitoring product to get insights at the application request level, and better understand traffic patterns, what your users are doing, and the experience they are having.
Getting Started with Amazon Lightsail
It’s easy to provision a Lightsail instance. Just select location, platform, blueprint or operating system (OS). Then, select your pricing and you are done.
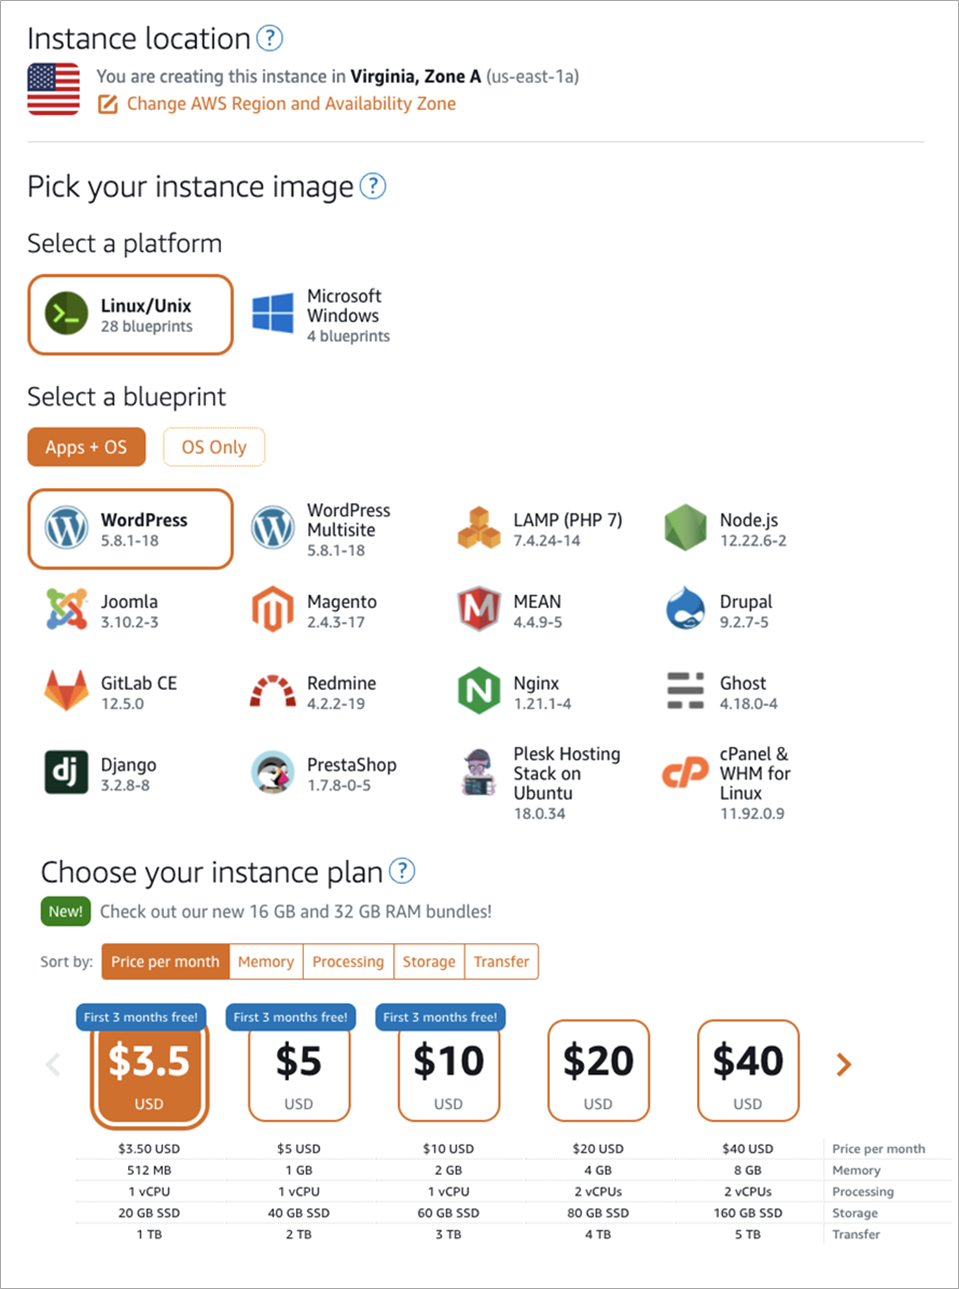
Figure 6 – Lightsail host creation.
Installing Datadog Agent
Installing the Datadog Agent on your Lightsail instance is easy, too. Click on the shell icon in the top right corner to open the Lightsail browser-based SSH shell.
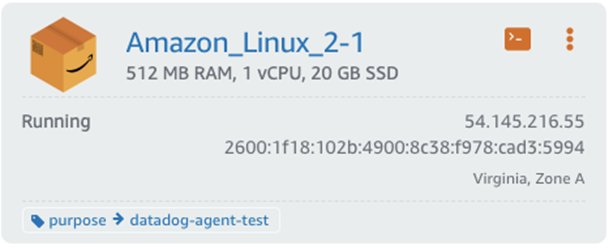
Figure 7 – Lightsail host details.
Next, paste the single-line command and hit enter. You can generate this command in Datadog user interface by going to Integrations > Agent. In our examples, we used an Amazon Linux-based instance. For detailed instructions on installing the Agent on other operating systems, please refer to the Datadog documentation.
Single-line command to install Datadog Agent:
DD_AGENT_MAJOR_VERSION=7 DD_API_KEY=XXXXXXXXXX DD_SITE="datadoghq.com" bash -c "$(curl -L https://s3.amazonaws.com/dd-agent/scripts/install_script.sh)"
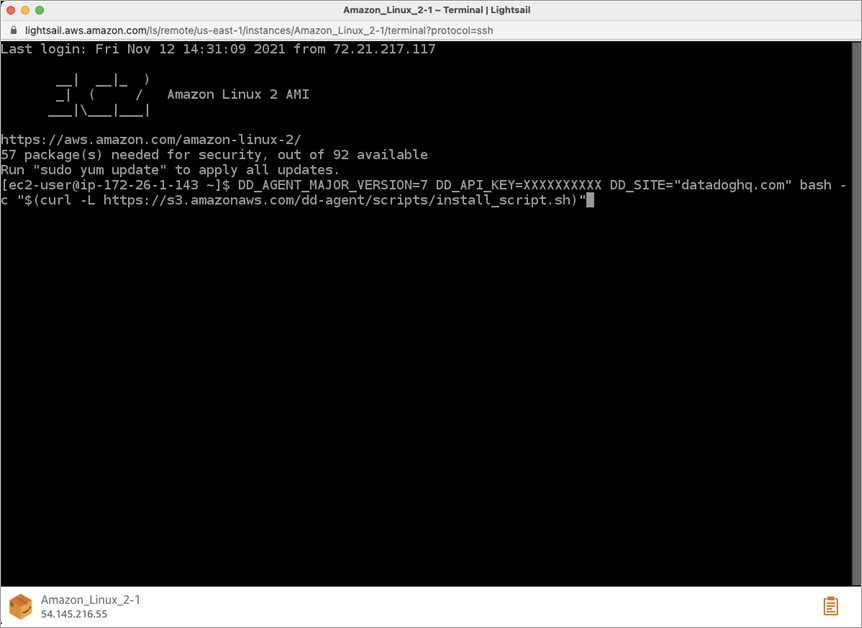
Figure 8 – Lightsail Linux host command line shell.
Once the installation finishes, you can verify the Agent status by running this command in the browser shell:
sudo systemctl status datadog-agent
You should get this output:
Next, you can see your newly added host in the list of hosts.
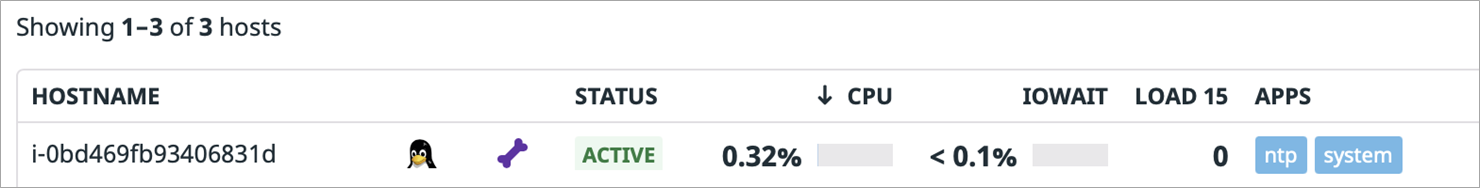
Figure 9 – Lightsail host with Agent icon.
Conclusion
Amazon Lightsail gives you an easy way to run simpler workloads and provision your infrastructure with pre-configured applications, databases, and many popular development stacks. With Datadog, you can easily monitor the health and performance of your Lightsail applications.
In this posts, we’ve shown how to configure Datadog to monitor a Lightsail instance. Once configured, Datadog automatically gives you visibility into a comprehensive set of the most important performance metrics.
Using Datadog’s easy-to-use dashboards, monitors, and default 15-month metric retention period allows you to detect longer-term patterns (holiday, monthly, weekend spikes). This enhanced visibility enables you to right-size your instances and reduce costs while serving your customers better.
If you would like to try it yourself, sign up for a 14-day free trial of Datadog if you don’t already have an account. If you’re not already using Lightsail, sign up or visit the getting started page for more tutorials and resources.
.

.
Datadog – AWS Partner Spotlight
Datadog is an AWS Partner that provides a monitoring and security platform for cloud applications.
Contact Datadog | Partner Overview | AWS Marketplace
*Already worked with Datadog? Rate the Partner
*To review an AWS Partner, you must be a customer that has worked with them directly on a project.