AWS Partner Network (APN) Blog
Running SQL on Amazon Athena to Analyze Big Data Quickly and Across Regions
By Ori Nakar, Principal Engineer, Threat Research at Imperva
 |
 |
Data is the lifeblood of a digital business and a key competitive advantage for many companies holding large amounts of data in multiple cloud regions.
At Imperva, an AWS Partner Network (APN) Advanced Technology Partner, we protect web applications and data assets. Our threat research group is constantly looking through huge amounts of data to detect cyber attacks and obtain useful business insights.
A public example of Imperva’s threat analytics is the Cyber Threat Index—a high-level, monthly report and measurement of the global cyber threat landscape.
Imperva’s data pipeline starts with raw data streamed to Amazon Simple Storage Service (Amazon S3). We then use extract, transform, and load (ETL) jobs to process the data by SQL using Amazon Athena, as described in this Imperva blog post.
For each use case, Imperva:
- Filters the data
- Groups it
- Joins it with internal and/or external data
- Converts it to columnar format
We end up with hundreds of tables, which we can query at any time. We can also persist the results and reuse the processed data.
Naturally, all of this power can lead to complexity. For instance, now that we have the data, how can we find the insights it contains? Are we able to analyze the data when spans multiple cloud regions?
In this post, we examine how you can use SQL to analyze big data directly, or to pre-process the data for further analysis by machine learning. We’ll also describe the benefits and limitations of using SQL, and provide examples of clustering and data extraction.
Why Use SQL for Big Data Analytics?
Clustering and other data analysis methods using SQL can help you analyze data quickly, so you can win quickly or fail fast. It’s a simple yet powerful language.
In the following examples, I’ll show you how to use SQL’s WITH clause to write programmatic queries. The WITH clause makes it possible to split a SQL query into multiple steps. It makes your SQL readable, and makes it possible to reuse data from previous steps—just like in programming.
Example 1: Clustering Time-Based Data
Let’s first explain the difference between clustering and grouping. Grouping is very common in SQL. It uses the GROUP BY clause to put data into groups that share the same exact values. Clustering, on the other hand, groups data according to similarities, even if the actual values are somewhat different.
The Problem
In SQL, it’s very common to use the GROUP BY clause to group data by discrete values. But how can you group continuous values such as timestamps?
One simple and effective way is by transforming the data by timeslots. For example, you can state the hour, or the beginning of a five-minute timeslot, and then group the data accordingly. Grouping by timeslots is limited, since the events you’re looking for may span multiple timeslots.
The Solution: Grouping and Clustering Time-Based Data
Assume we have a table with id and time columns, and we want to group or cluster the data. We can use the following SQL command to group the data.
For time-based clustering, we use the analytic functions LEAD and SUM. In the following example, we use LEAD to first find gaps of more than 300 seconds. Then, we use SUM to summarize the number of gaps before each ID so we can calculate a cluster ID.
These are results we obtained for each method, grouping by time slot and clustering.
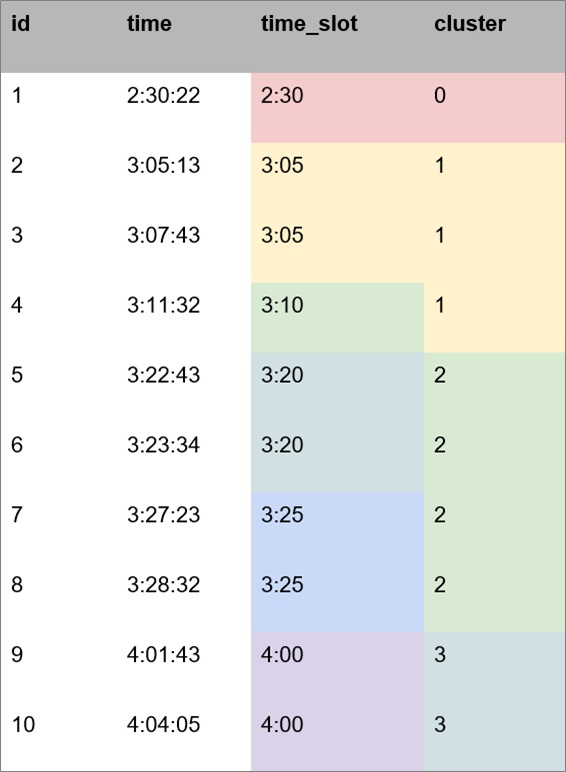
Figure 1 – Results of SQL grouping vs. SQL clustering.
In the time slots grouping, we got six groups, but only four clusters

Figure 2 – SQL created six groups and four clusters.
Both methods are simple. We found clustering better for our use cases since it allows us to find large sequential data, removes duplications, and returns meaningful insights instead of raw data. We prefer using it whenever possible.
A real-word example of the benefits of clustering over grouping is the vulnerability scanner used in a Web Application Firewall domain. A vulnerability scanner can run a long time on a single site checking lots of requests detected as malicious. From our perspective, running such a scan is a single incident, and clustering detects it as expected.
Figure 3 shows another comparison of grouping vs. clustering. Around 100 million daily attacks are grouped into 20 million incidents by timeslots, or into 10 million incidents using time-based clustering.

Figure 3 – Another example of results obtained by grouping and clustering.
Clustering is crucial for further analysis, as it helps remove a lot of noise from the data.
Amazon Athena makes it easy to use analytic functions such as LEAD and SUM from our example. By combining aggregate functions with each other, you can construct complex analytics with ease.
For a list of the aggregate functions supported by Amazon Athena, see the Prestodb documentation.
Example 2: Data Extraction and Grouping by Prefix
In many cases, we store unstructured data in our tables for later processing. One way to do that is by loading the unstructured data into memory, and writing code to go over it line by line. However, if we do it this way, we may face performance, memory, or costs issues.
To avoid those issues, we prefer to process the data—or at least do some of the processing—before we move to the code stage.
Here is an example for extracting URLs from a column with large text. This is how it’s done by SQL using Amazon Athena.
First, we use SELECT to look for URLs in the text column. Then we use CROSS JOIN to group them so we have a list of unique URLs and the number of hits per URL. This initial processing is done by the query engine in Amazon Athena.
Next, we want to group those URLs by prefixes, and get the number of hits per prefix. Using prefixes in addition to URLs returns better results than using URLs alone. We decided to do it using the Python pygtrie library in GitHub. It allows grouping by prefixes, and by using the PrefixSet class, we get only the common prefixes.
To find the URLs or prefixes with more than 100 hits, we ran this code per domain.
When we go over prefixes instead of only full URLs, we find even more data. In addition, the found data is more general (prefix vs. full URL). This technique improves the threat detectability of our security feeds.
We couldn’t use the Amazon Athena query engine for the pygtrie query (it cannot be done by SQL), but we use it as often as possible, and for the rest of our code.
Example 3: Querying Data from Multiple Cloud Regions
Data privacy regulations such as the General Data Protection Regulation (GDPR) in Europe add a twist to our queries. So do performance and cost considerations. Our data is stored in multiple regions, how can we query it?
We can either query the data:
- From within each region and aggregate the results.
- Across all the regions once, from inside one of the regions.
Imperva’s security researchers and data scientists prefer using multi-region tables, and in most of their use cases the source region is not important.
Here is how we run a single query across multiple regions.
The downside of using a single query is that data has to be transferred between regions, which takes longer and costs more. To reduce both time and cost, we use columnar format because it transfers only the relevant data between regions, not all the data.
With a query engine per region you get better performance, but you have to aggregate the results by yourself, which may not be a simple task.
Amazon Athena allows both options, since you don’t need to manage your own query engine.
Conclusion
Clustering and other data analysis methods using SQL can help you analyze your data quickly, In some cases, using SQL can completely replace the use of complex methods. In other cases, it can pre-process the data to simplify the next steps in the data pipeline.
By using Amazon Athena, you can run SQL on large amounts of data at low cost. You can also run SQL on data stored in multiple regions. The best way to know if it works for you is to try it on your own data.
The content and opinions in this blog are those of the third party author and AWS is not responsible for the content or accuracy of this post.
.

.
Imperva – APN Partner Spotlight
Imperva is an APN Advanced Technology Partner. Once deployed, Imperva’s solutions proactively identify, evaluate, and eliminate current and emerging threats, so you never have to choose between innovating for customers and protecting what matters most.
Contact Imperva | Solution Overview | AWS Marketplace
*Already worked with Imperva? Rate this Partner
*To review an APN Partner, you must be an AWS customer that has worked with them directly on a project.