AWS News Blog
Amazon Kinesis Update – Amazon Elasticsearch Service Integration, Shard-Level Metrics, Time-Based Iterators

|
September 8, 2021: Amazon Elasticsearch Service has been renamed to Amazon OpenSearch Service. See details.
Amazon Kinesis makes streaming data easy in the cloud.The Amazon Kinesis platform is comprised of three distinct services: Kinesis Streams allows developers to build their own stream processing applications; Kinesis Firehose simplifies the process of loading streaming data into AWS for storage and analytics; Kinesis Analytics supports the analysis of streaming data using standard SQL queries.
Many AWS customers use Kinesis Streams and Kinesis Firehose as a component of their real-time streaming data ingestion and processing systems. They appreciate the ease of use that comes with a fully managed service, and invest their development time in their application instead of spending time managing their own streaming data infrastructure.
Today we are announcing three new features for Amazon Kinesis Streams and Amazon Kinesis Firehose:
- Elasticsearch Integration – Amazon Kinesis Firehose can now stream data to an Amazon Elasticsearch Service cluster.
- Enhanced Metrics – Amazon Kinesis now sends shard-level metrics to CloudWatch each minute.
- Flexibility – Amazon Kinesis now allows you to retrieve records using time-based shard iterators.
Amazon Elasticsearch Service Integration
Elasticsearch is a popular open-source search and analytics engine. Amazon Elasticsearch Service is a managed service that makes it easy for you to deploy, run, and scale Elasticsearch in the AWS Cloud. You can now arrange to deliver your Kinesis Firehose data stream to an Amazon Elasticsearch Cluster. This will allow you to index and analyze server logs, clickstreams, and social media traffic.
The incoming records (Elasticsearch documents) are buffered in Kinesis Firehose according to a configuration that you specify, and then automatically added to the cluster using a bulk request that indexes multiple documents simultaneously. The data must be UTF-8 encoded and flattened into single JSON object before it is sent to Firehose (see my recent blog post, Amazon Kinesis Agent Update – New Data Preprocessing Feature, to learn more about how to do this).
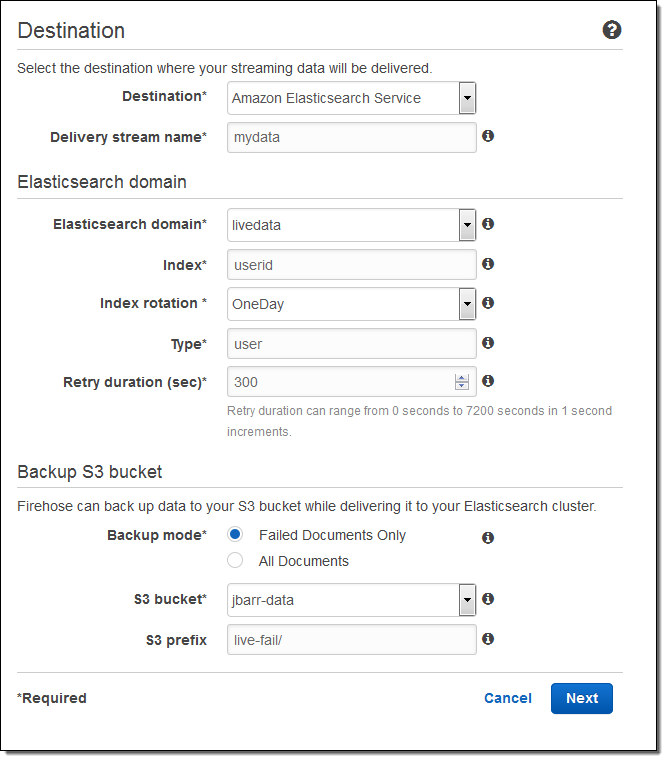
Here’s how to set this up using the AWS Management Console. I choose the destination (Amazon Elasticsearch Service) and set the delivery stream name, then I choose one of my Elasticsearch domains (livedata in this example), set up the index, and choose the index rotation (none, hourly, daily, weekly, or monthly). I also designate an S3 bucket that will receive a backup of either all documents or failed documents (my choice):
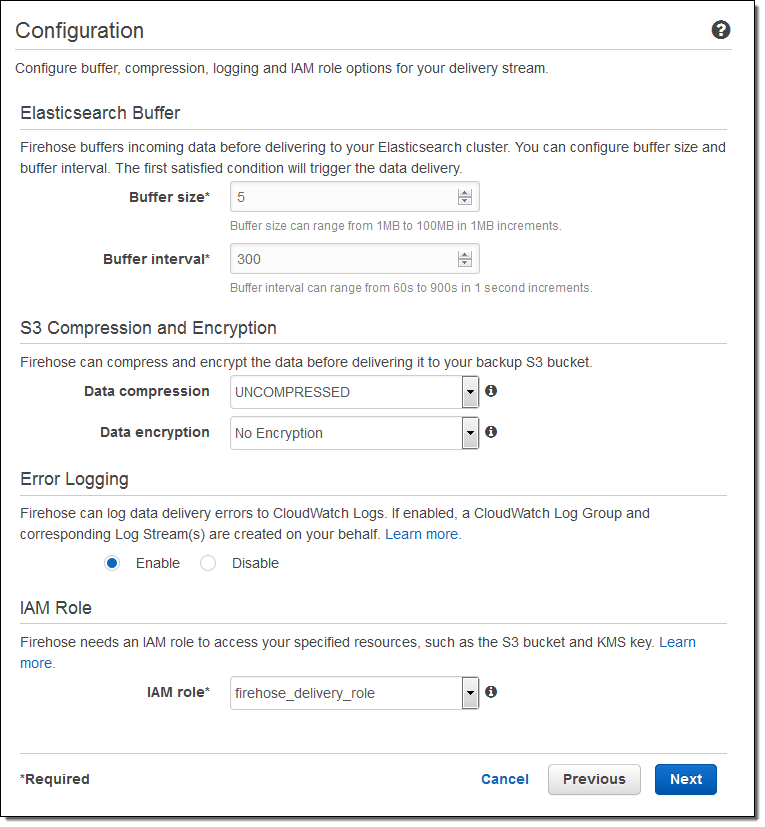
Then I set the buffer size, choose some compression and encryption options for the data that will be sent to my S3 bucket, set up logging (if desired), and pick an appropriate IAM role:
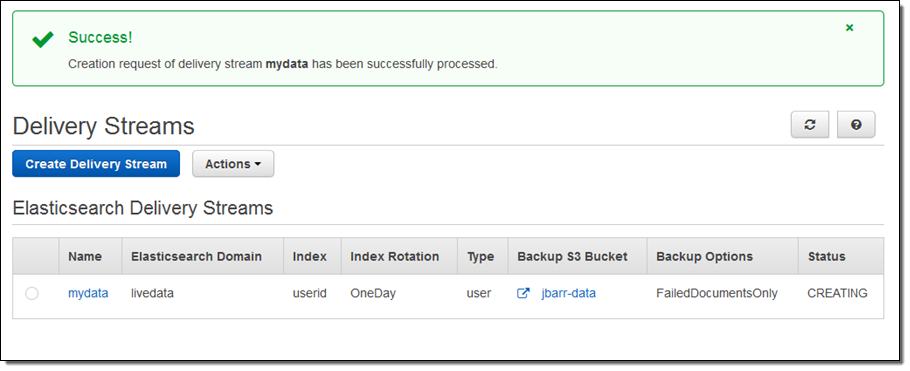
The stream will be ready for use in a minute or so:
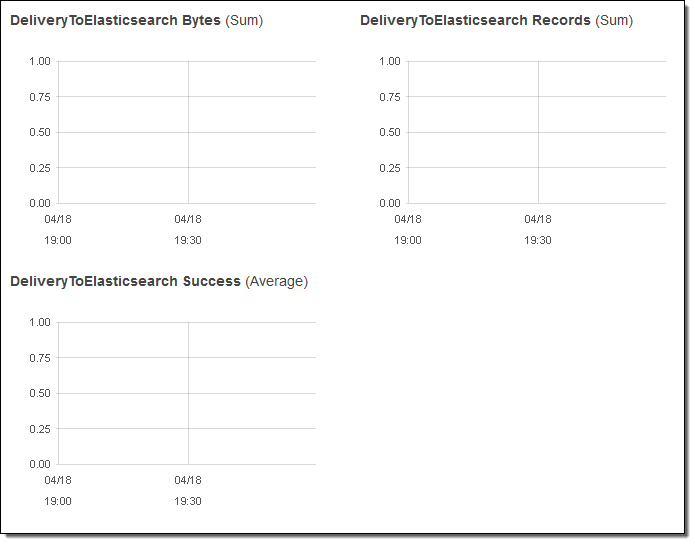
I can view the delivery metrics in the Console:
Once the data starts to arrive in Elasticsearch I can explore it visually using Kibana or by writing queries in the Elasticsearch query language.
Putting this all together, this integration greatly simplifies the process of capturing and delivering your streaming data to your Elasticsearch cluster. There’s no need to write any code or to build your own data ingestion tools.
Shard-Level Metrics
Each Kinesis stream is composed of one or more shards, each of which provides a fixed amount of read and write capacity. Each time you add a shard to a stream, you increase the capacity of the stream.
In order to provide you with increased visibility into the performance of each shard, you can now enable a set of shard-level metrics. There are 6 metrics per shard, each reported once per minute and charged at the usual per-metric CloudWatch pricing. These metrics will allow you to see if a particular shard is running hotter than the others and to locate and root out any inefficiencies in your end-to-end streaming data delivery pipeline. For example, you can identify the shard(s) that are receiving records at a rate too high too handle and the shard(s) that are being read by applications at lower throughput than expected.
Here are the new metrics:
IncomingBytes – The number of bytes that have been successfully PUT to the shard.
IncomingRecords – The number of records that have been successfully PUT to the shard.
IteratorAgeMilliseconds – The age (in milliseconds) of the last record returned by a GetRecords call against a shard. A value of 0 means that the records being read are completely caught up with the stream.
OutgoingBytes – The number of bytes that have been retrieved from the shard.
OutgoingRecords – The number of records that have been retrieved from the shard.
ReadProvisionedThroughputExceeded -The number of GetRecords calls that have been throttled for exceeding the 5 reads per second or 2 MB per second shard limits.
WriteProvisionedThroughputExceeded – The number of records that have been rejected due to throttling for exceeding the 1000 records per second or 1 MB per second shard limits.
You can enable these metrics by calling the EnableEnhancedMonitoring function. As always, you can use the CloudWatch APIs to aggregate them across any desired time period.
Time-Based Iterators
Your application reads data from a Kinesis stream by creating an iterator on the desired shard using the GetShardIterator function and specifying the desired starting point. In addition to the existing starting point options (at or after a sequence number, oldest record, or newest record) you can now specify a timestamp. The value (specified in Unix epoch format) indicates the timestamp of the oldest record that you would like to read and process.
— Jeff;