AWS News Blog
CloudFront Update – Trends, Metrics, Charts, More Timely Logs
The Amazon CloudFront team has added a slew of analytics and reporting features this year. I would like to recap a pair of recent releases and then introduce you to the features that we are releasing today. As you probably know, CloudFront is a content delivery web service that integrates with the other parts of AWS for easy and efficient low-latency delivery of content to end users.
CloudFront Usage Charts
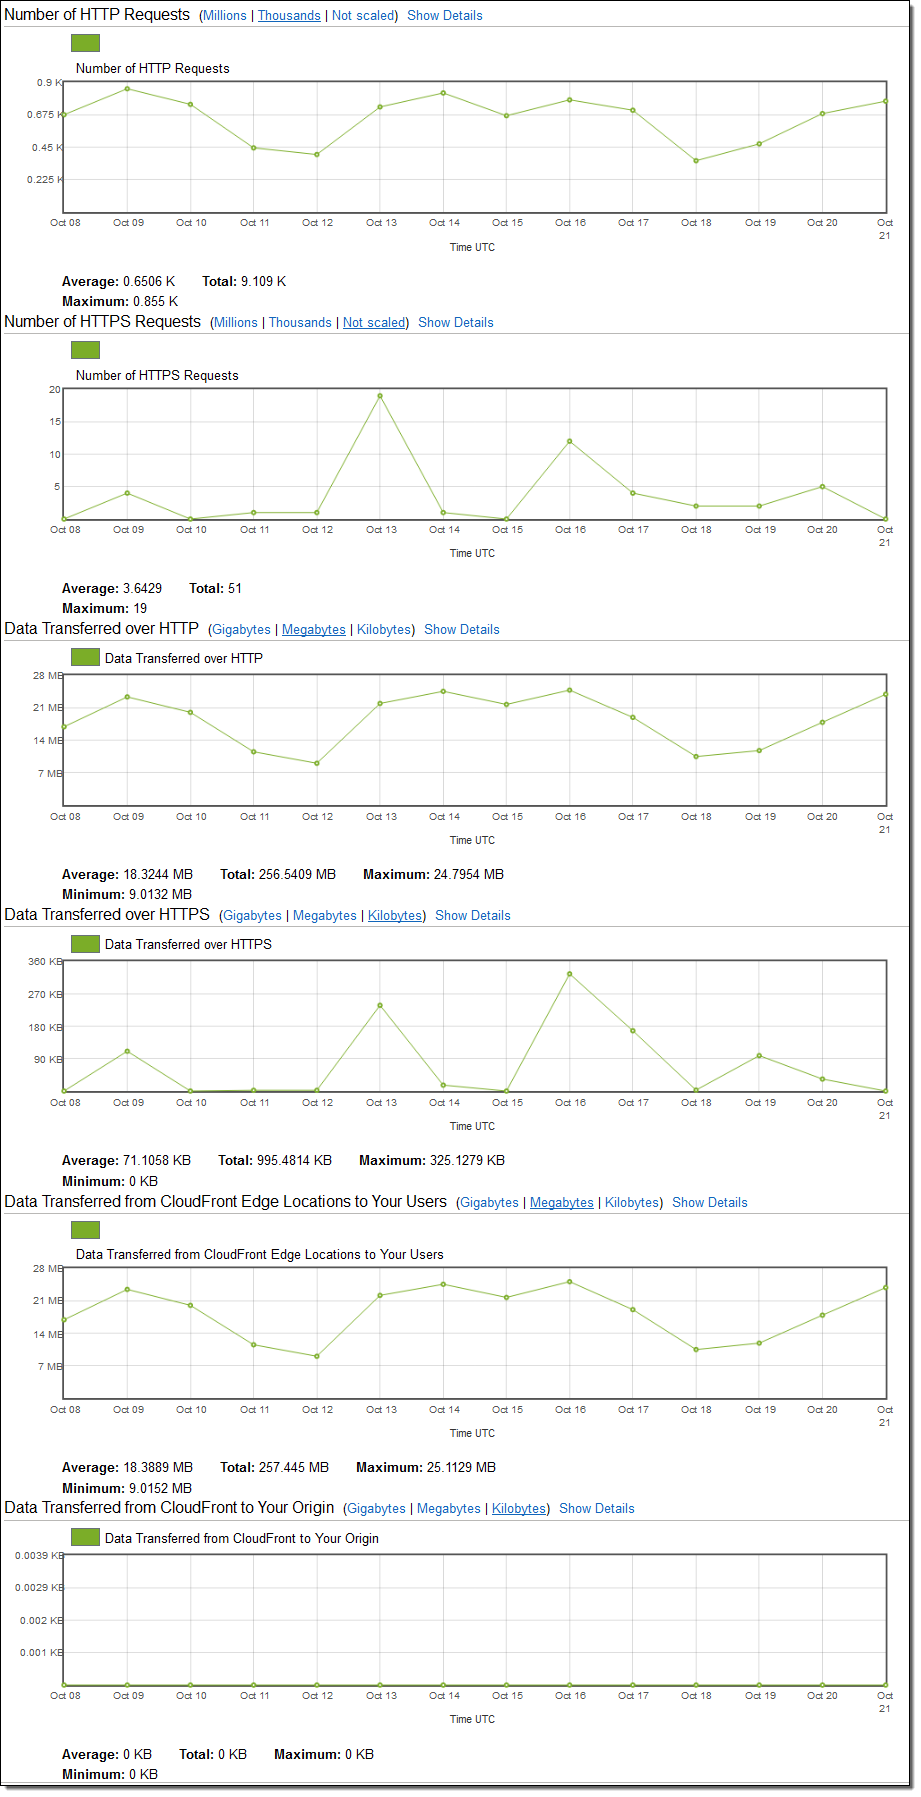
We launched a set of CloudFront Usage Charts back in March. The charts let you track trends in data transfer and requests (both HTTP and HTTPS) for each of your active CloudFront web distributions. Data is shown with daily or hourly granularity. These charts are available to you at no extra charge. You don’t have to make any changes to your distribution in order to collect the data or to view the charts. Here is a month’s worth of data for one of my distributions:
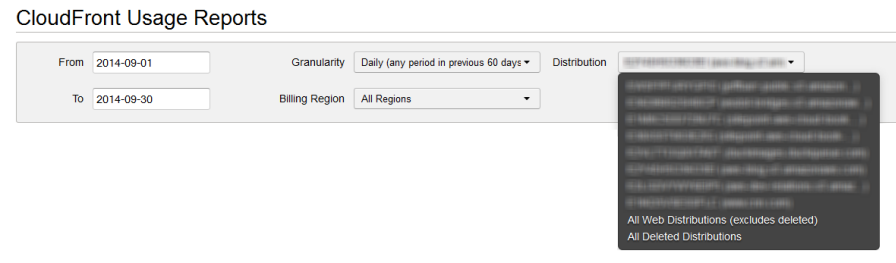
You can easily choose the distribution of interest, the desired time period and the reporting granularity:
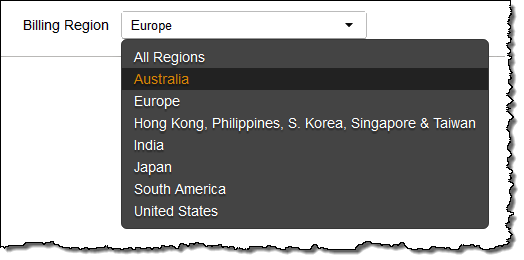
You can also narrow down the reports by billing region:
Operational Metrics
Earlier this month CloudFront began to publish a set of Operational Metrics to Amazon CloudWatch. These metrics are published every minute and reflect activity that’s just a few minutes old, giving you information that is almost real-time in nature. As is the case with any CloudWatch metric, you can display and alarm on any of the items. The following metrics are available for each of your distributions:
- Requests – Number of requests for all HTTP methods and for both HTTP and HTTPS requests.
- BytesDownloaded – Number of bytes downloaded by viewers for GET, HEAD, and OPTIONS requests.
- BytesUploaded – Number of bytes uploaded to the origin with CloudFront using POST and PUT requests.
- TotalErrorRate – Percentage of all requests for which the HTTP status code is 4xx or 5xx.
- 4xxErrorRate – Percentage of all requests for which the HTTP status code is 4xx.
- 5xxErrorRate – Percentage of all requests for which the HTTP status code is 5xx.
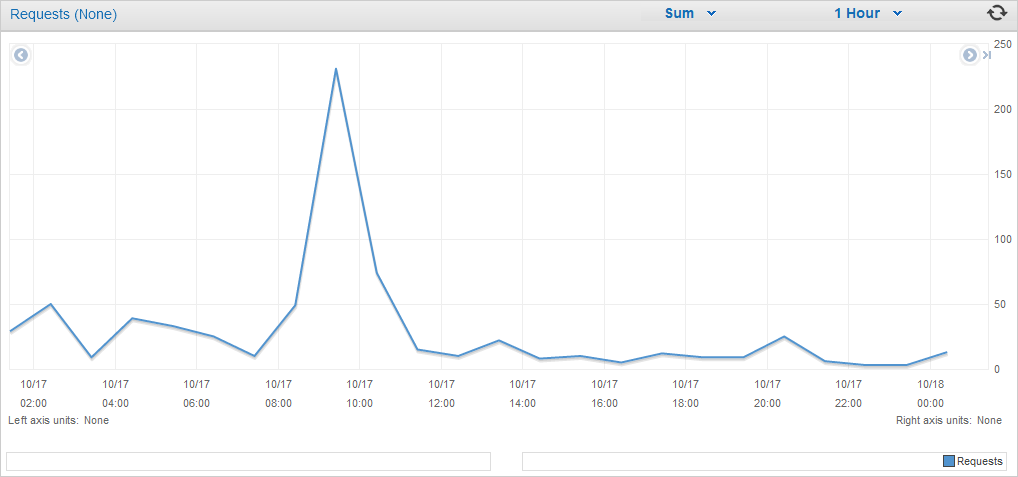
The first three metrics are absolute values and make the most sense when you view the Sum statistic. For example, here is the hourly request rate for my distribution:
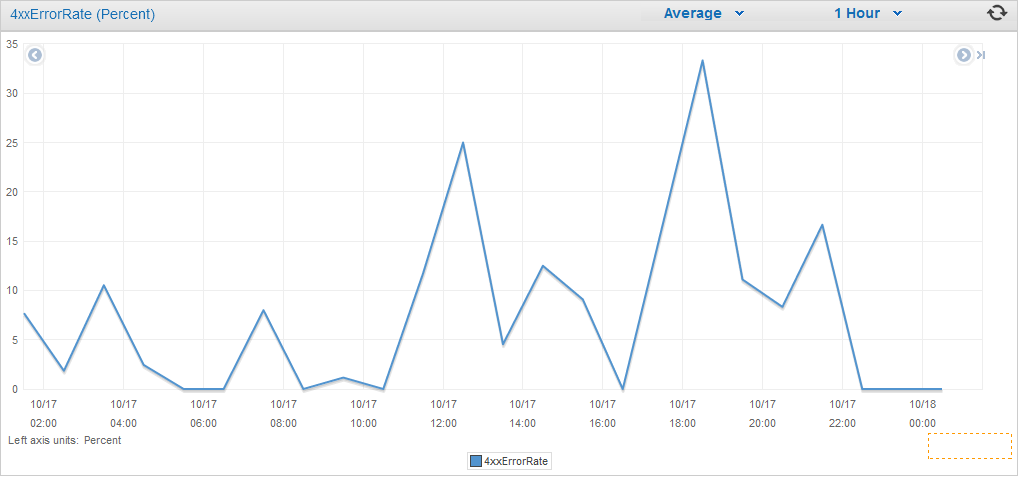
The other three metrics are percentages and the Average statistic is appropriate. Here is the error rate for my distribution (I had no idea that it was so high and need to spend some time investigating):
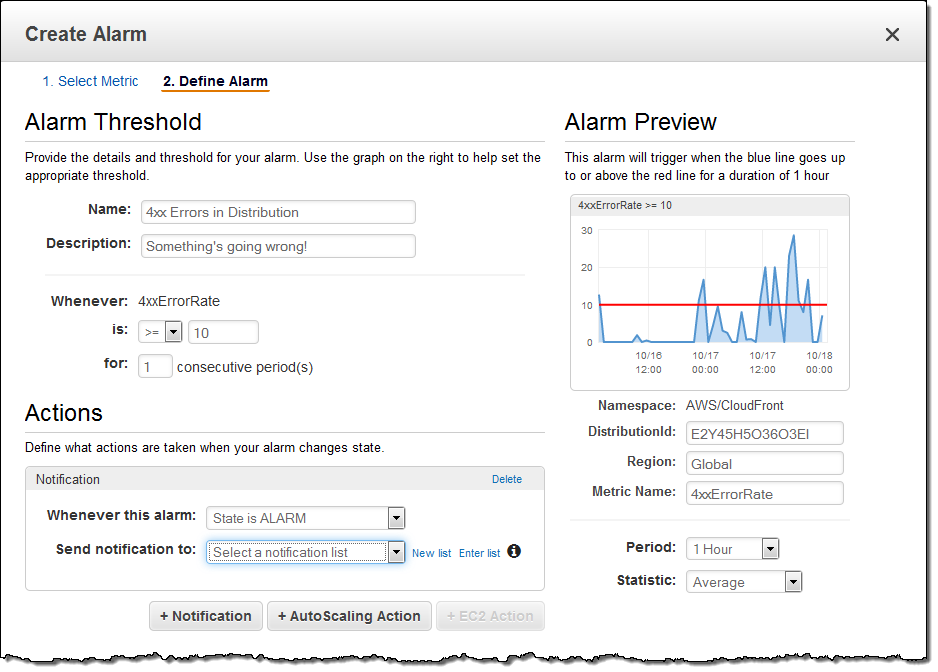
Once I track this down (a task that will have to wait until after AWS re:Invent, I will set an Alarm as follows:
The metrics are always delivered to the US East (N. Virginia) Region; you’ll want to make sure that it is selected in the Console’s drop-down menu. Metrics are not emitted if the distribution has no traffic. As a consequence, the metric may not appear in CloudWatch if it has no requests.
New – More Timely Logs
Today we are improving the timeliness of the CloudFront logs. There are two aspects to this change. First, we are increasing the frequency with which CloudFront delivers log files to your Amazon Simple Storage Service (Amazon S3) bucket. Second, we are reducing the delay between data collection and data delivery. With these changes, the newest log files in your bucket will reflect events that have happened as recently as an hour ago.
We have also improved the batching model as part of this release. As a result, many applications will see fewer files now than they did in the past, despite the increased delivery frequency.
New – Cache Statistics & Popular Objects Report
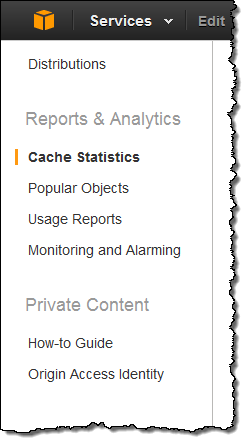 We are also launching a set of new Cache Statistics reports today. These reports are based on the entries in your log files and are available on a per-distribution and all-distribution basis with day-level granularity for any time frame within a 60-day period and hour-level granularity for any 14-day interval the same 60-day period. These reports allow filtering by viewer location. You can, for example, filter by continent in order to gain a better understanding of traffic characteristics that are dependent on the geographic location of your viewer.
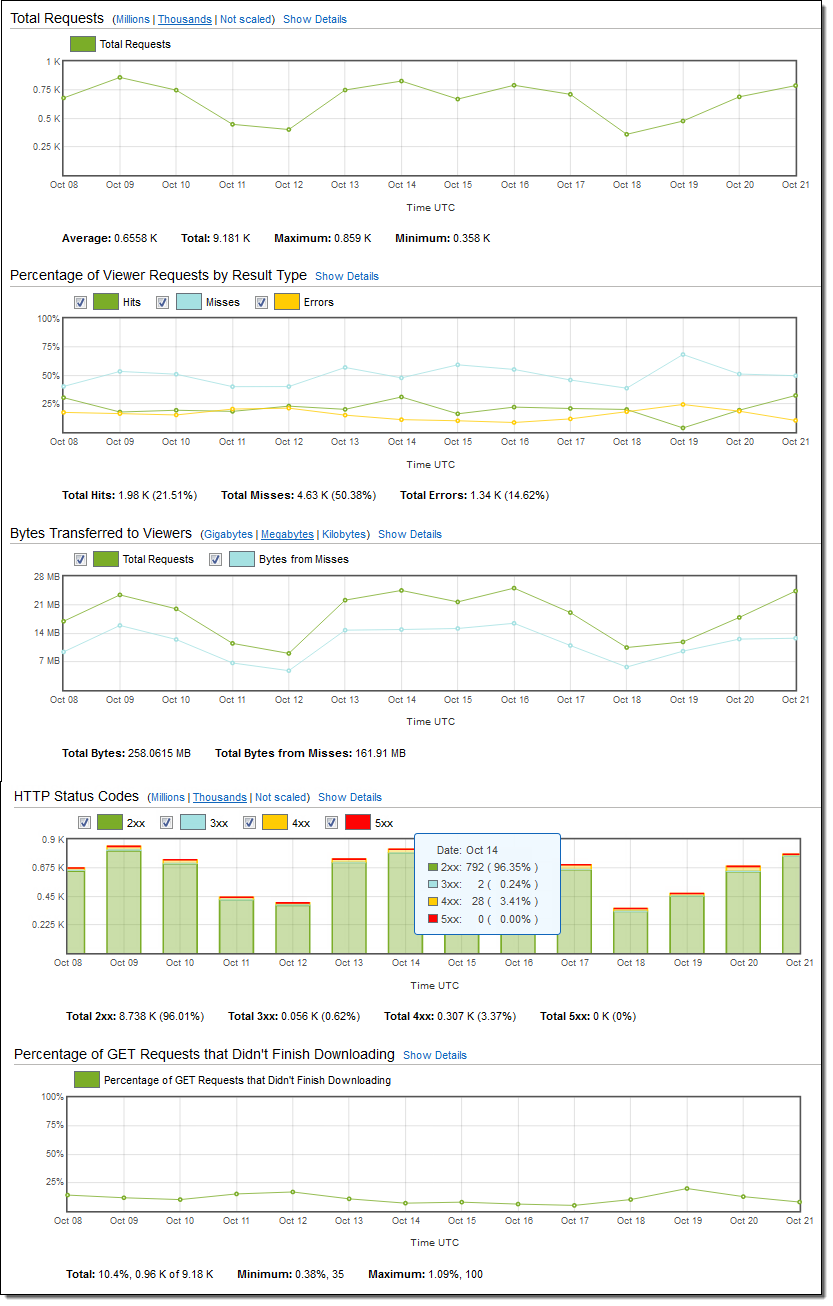
The following reports are available:
- Total Requests – This report shows the total number of requests for all HTTP status codes and all methods.
- Percentage of Viewer Requests by Result Type – This report shows cache hits, misses, and errors as percentages of total viewer requests.
- Bytes Transferred to Viewers – This report shows the total number of bytes that CloudFront served to viewers in response to all requests for all HTTP methods. It also shows the number of bytes served to viewers for objects that were not in the edge cache (CloudFront node) at the time of the request. This is a good approximation for the number of bytes transferred from the origin.
- HTTP Status Codes – This report shows the number of viewer requests by HTTP status code (2xx, 3xx, 4xx, and 5xx).
- Unfinished GET Requests – This report shows the percentage of GET requests that didn’t finish downloading the requested object, as a percentage of the total requests.
Here are the reports:
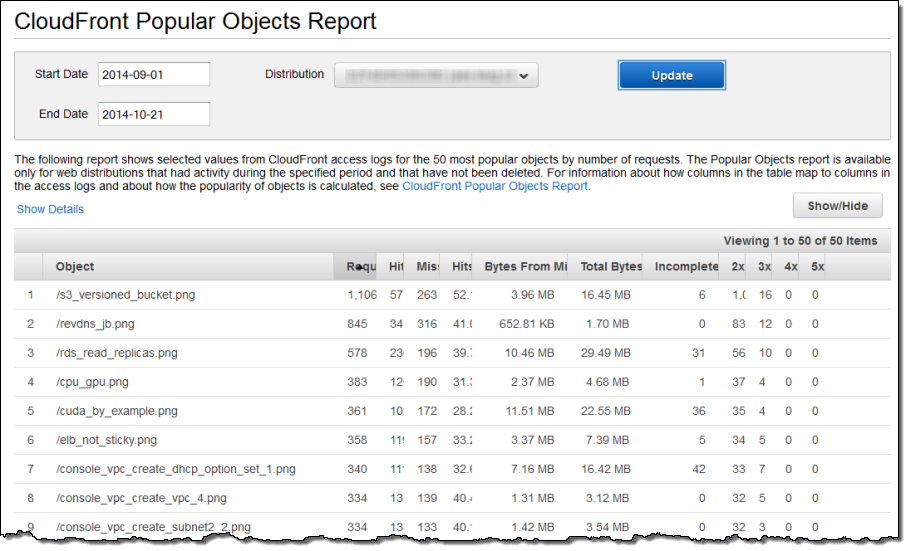
The new Popular Objects report shows request count, cache hit and cache miss counts, as well as error rates for the 50 most popular objects during the specified period. This helps you understand which content is most popular among your viewers, or identify any issues (such as high error rates) with your most requested objects. Here’s a sample report from one of my distributions:
Available Now
The new reports and the more timely logs are available now. Data is collected in all public AWS Regions.
— Jeff;
If you want to learn even more about these cool new features, please join us at 10:00 AM (PT) on November 20th for our Introduction to CloudFront Reporting Features webinar.