AWS News Blog
New – Amazon Elasticsearch Service

|
September 8, 2021: Amazon Elasticsearch Service has been renamed to Amazon OpenSearch Service. See details.
Elasticsearch is a real-time, distributed search and analytics engine that fits nicely into a cloud environment. It is document-oriented and does not require a schema to be defined up-front. It supports structured, unstructured, and time-series queries and serves as a substrate for other applications and visualization tools including Kibana.
Today we are launching the new Amazon Elasticsearch Service (Amazon ES for short). You can launch a scalable Elasticsearch cluster from the AWS Management Console in minutes, point your client at the cluster’s endpoint, and start to load, process, analyze, and visualize data shortly thereafter.
Creating a Domain
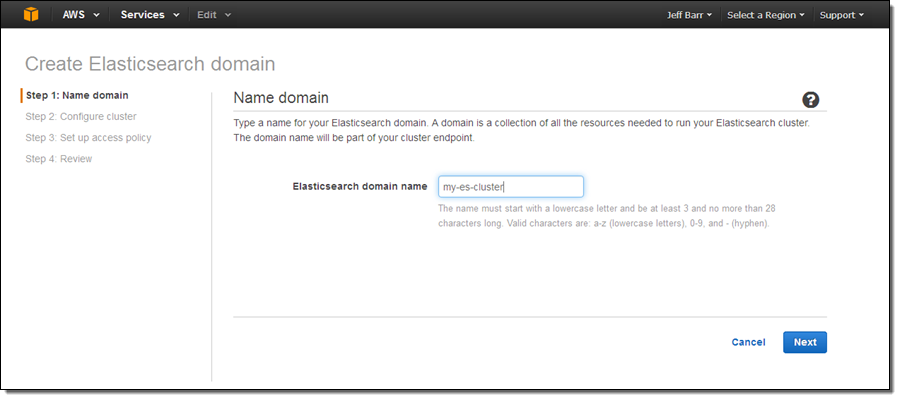
Let’s go ahead and create an Amazon ES domain (as usual, you also can do this using the AWS Command Line Interface (AWS CLI), AWS Tools for Windows PowerShell, or the Amazon Elasticsearch Service API). Simply click on the Get Started button on the splash page and enter a name for your domain (I chose my-es-cluster):
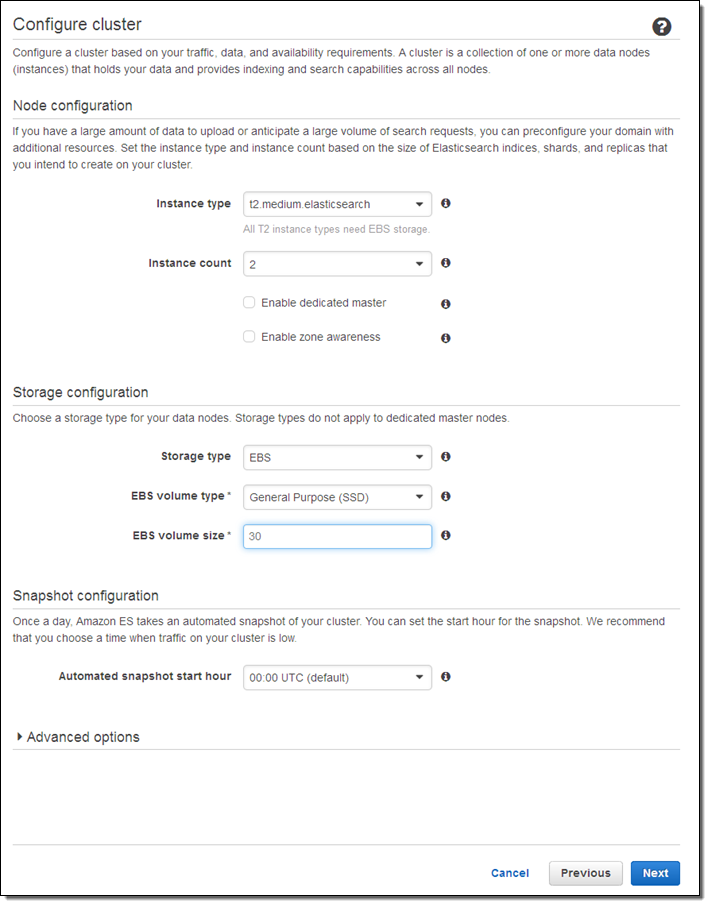
Select an instance type and an instance count (both can be changed later if necessary):
Here are some guidelines to help you to choose appropriate instance types:
- T2 – Dev and test (also good for dedicated master nodes).
- R3 – Processing loads that are read-heavy or that have complex queries (e.g. nested aggregations).
- I2 – High-write, large-scale data storage.
- M3 – Balanced read/write loads.
If you check Enable dedicated master, Amazon ES will create a separate master node for the cluster. This node will not hold data or respond to upload requests. We recommend that you enable this option and use at least three master nodes to ensure maximum cluster stability. Also, clusters should always have an odd number of master nodes in order to protect against split-brain scenarios.
If you check Enable zone awareness, Amazon ES will distribute the nodes across multiple Availability Zones in the region to increase availability. If you choose to do this, you will also need to set up replicas using the Elasticsearch Index API; you can also use the same API to do this when you create new indexes (learn more).
I chose to use EBS General Purpose (SSD) storage for my data nodes. I could have chosen to store the data on the instance, or to use another type of EBS volume. Using EBS allows me to store more data and to run on less costly instances; however on-instance storage will offer better write performance. Large data sets can run on I2 instances (they have up to 1.6 terabytes of SSD storage per node).
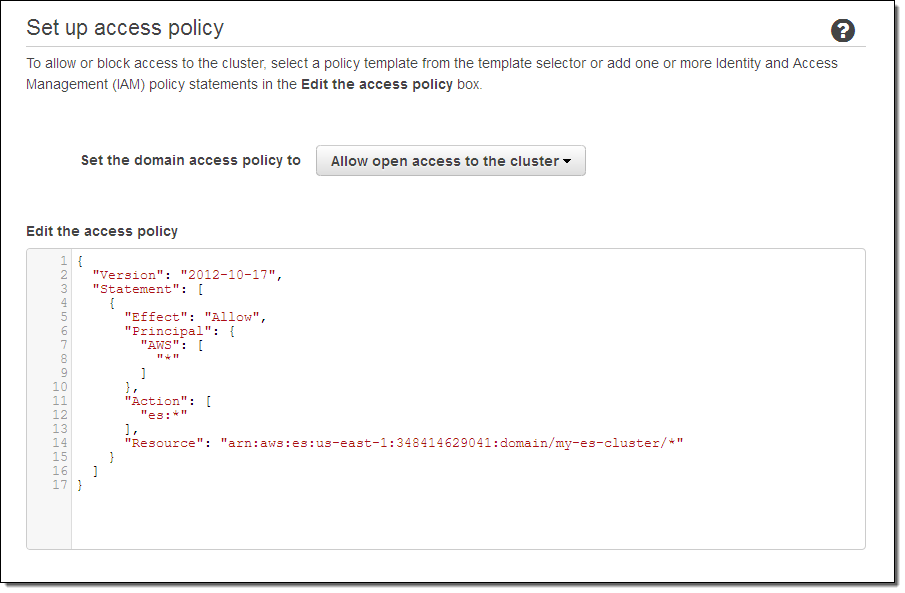
Next, set the access policy. I chose to make mine wide-open in order to simplify testing (don’t do this for your cluster); I could have used one of the IP-based or user-based templates and a wizard to create a more restrictive policy.
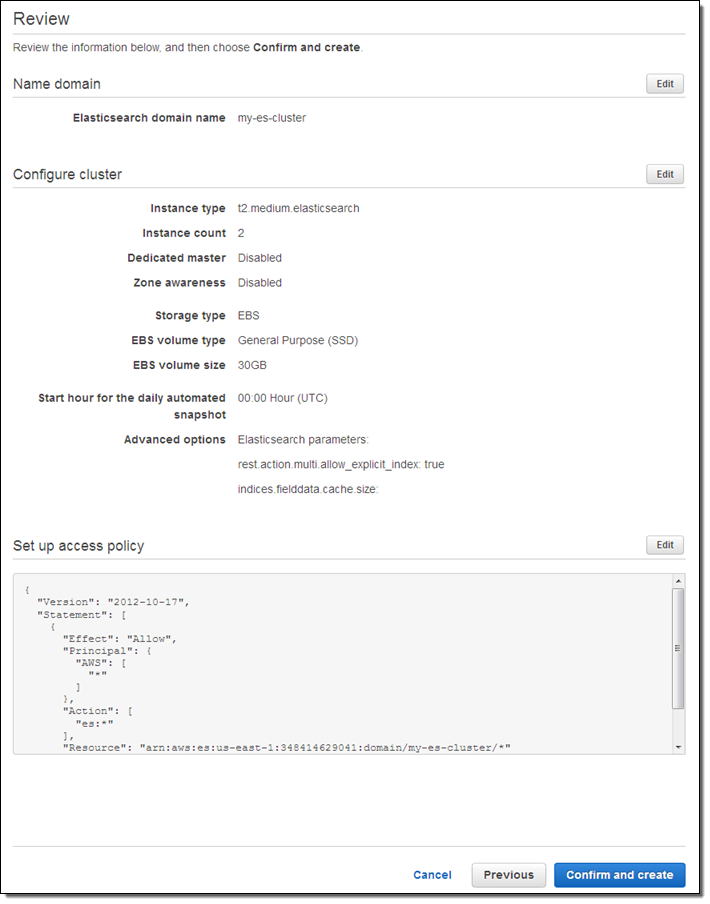
Finally, review the settings and click on Confirm and create:
The cluster will be created in a couple of minutes, and will be listed on the Elasticsearch Service dashboard (I added some documents before I took this screenshot):
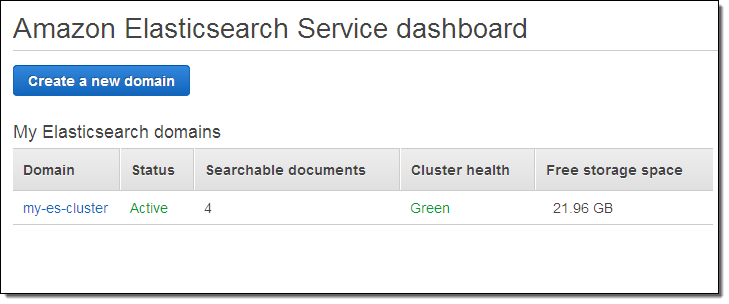
And that’s it!
Loading Documents
I knew next to nothing about Elasticsearch before I started to write this blog post, but that didn’t stop me from trying it out. Following the steps in Having Fun: Python and Elasticsearch, Part 1, I installed the Python library for Elasticsearch, and returned to the AWS Management Console to locate the endpoint for my cluster.
I performed the status check outlined in the blog post, and everything worked as described therein. Then I pasted the Python code from the post into a file, and ran it to create some sample data. I was able to see the new index in the Console:
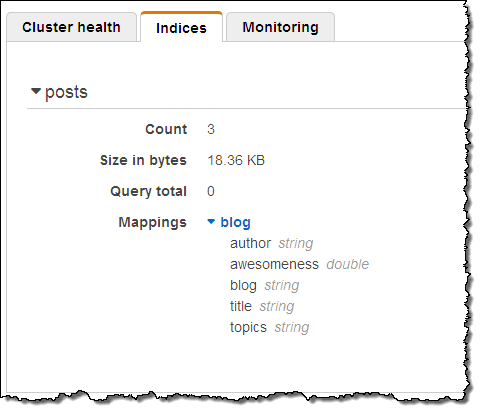
That was easy!
Querying Documents
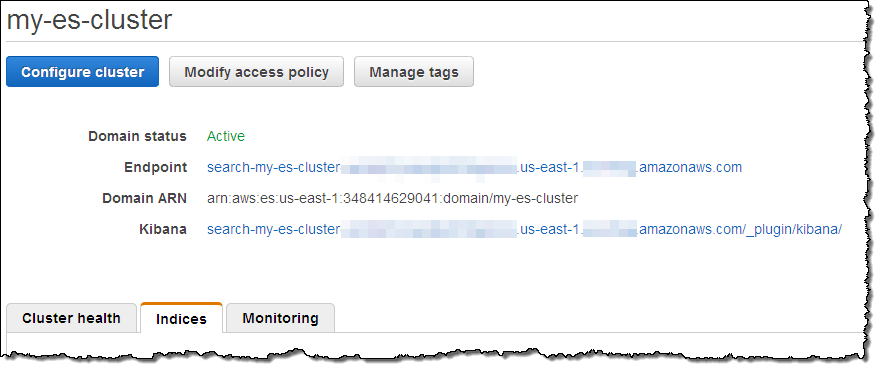
With the data successfully loaded, I clicked on the Kibana link for my cluster to see what else I could do:
Kibana (v4) opened in another browser tab and I configured it to index my posts:
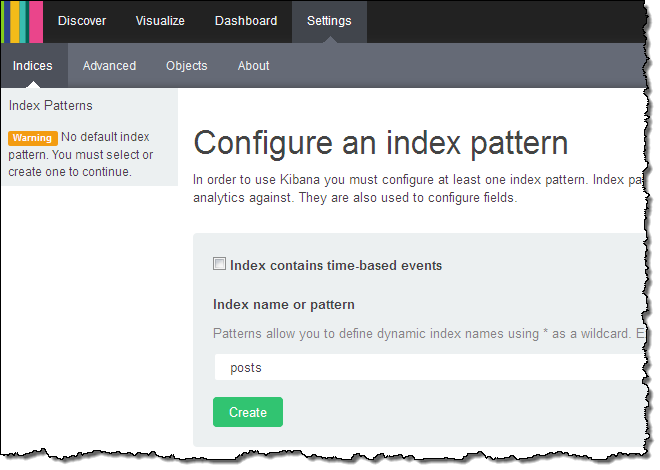
Kibana confirmed the fields in the domain:
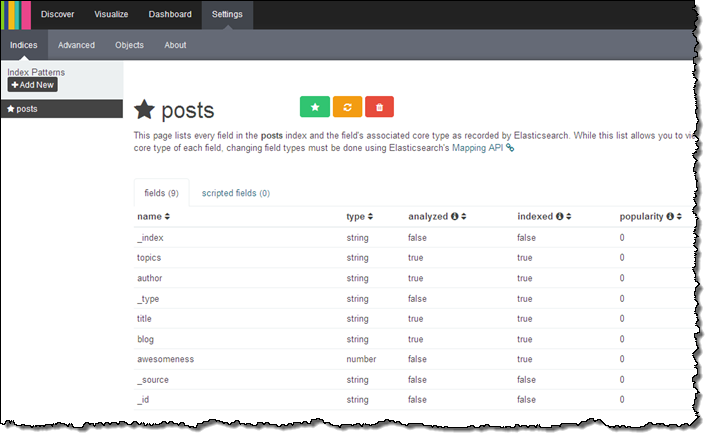
From there (if I had more time and actually knew what I was doing) I could visualize my data using Kibana.
Version 3 of Kibana is also available. To access it, simply append _plugin/kibana3/ to the endpoint of your cluster.
Other Goodies
You can scale your cluster using the CLI (aws es update-elasticsearch-domain-configuration), API (UpdateElasticsearchDomainConfig), or the console. You simply set the new configuration and Amazon ES will create the new cluster and copy your the data to it with no down time.
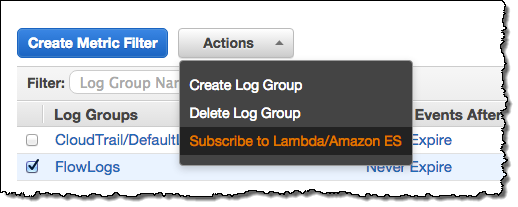
As part of today’s launch of Amazon ES, we are launching integration with CloudWatch Logs. You can arrange to route your CloudWatch Logs to Amazon ES by creating an Amazon ES domain, navigating to the Cloudwatch Logs Console and clicking on Subscribe to Lambda / Amazon ES, then stepping through the wizard:
The wizard will help you to set up a subscription filter pattern for the incoming logs (the pattern is optional, but having one allows you to define a schema for the logs). Here are some sample Kibana dashboards that you can use to view several different types of logs, along with the filter patterns that you’ll need to use when you route the logs to Amazon ES:
- VPC Flow Dashboard – use this filter pattern to map the log entries:
[version, account_id, interface_id, srcaddr, dstaddr, srcport, dstport,.
protocol, packets, bytes, start, end, action, log_status] - Lambda Dashboard – use this filter pattern to map the log entries:
[timestamp=*Z, request_id="*-*", event]. - CloudTrail Dashboard – no filter pattern is needed; the log entries are in self-identifying JSON form.
Amazon ES supports the ICU Analysis Plugin and the Kuromoji plugin. You can configure these normally through the Elasticsearch Mapping API. Amazon ES does not currently support commercial plugins like Shield or Marvel. The AWS equivalents for these plugins are AWS Identity and Access Management (IAM) and CloudWatch.
Amazon ES automatically takes a snapshot of your cluster every day and stores it durably for 14 days. You can contact us to restore your cluster from a stored backup. You can set the hour of the day during which that backup occurs via the “automated snapshot hour.” You can also use the Elasticsearch Snapshot API to take a snapshot of your cluster and store it in your S3 bucket or restore an Elasticsearch snapshot (Amazon ES or self-managed) to an Amazon ES cluster from your S3 bucket.
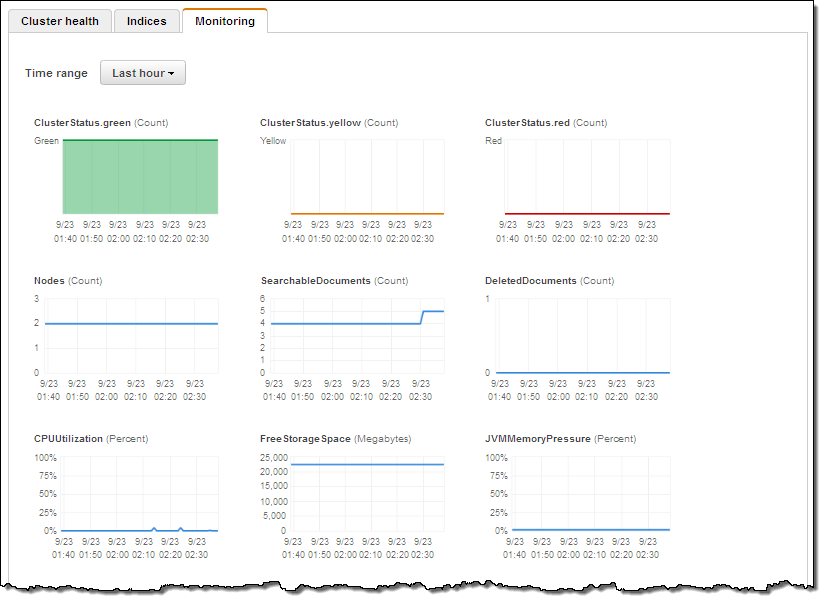
Each Amazon ES domain also forwards 17 separate metrics to CloudWatch. You can view these metrics on the Amazon ES console’s monitoring tab or in the CloudWatch console. The cluster Status metrics (green, yellow, and red) expose the underlying cluster’s status: green means all shards are assigned to a node; yellow means that at least one replica shard is not assigned to any node; red means that at least one primary shard is not assigned to a node. One common occurrence is for a cluster to go yellow when it has a single data node and replication is set to 1 (Logstash does that by default). The simple fix is to add another node to the cluster.
CPU Utilization is most directly affected by request processing (reads or writes). When this metric is high you should increase replication and add instances to the cluster to allow for additional parallel processing. Similarly for JVM Memory pressure, increase instance count or change to R3 instances. You should set CloudWatch alarms on these metrics, to keep 10-20% free storage, and free CPU at all times.
Available Now
You can create your own Amazon ES clusters today in the US East (N. Virginia), US West (N. California), US West (Oregon), Asia Pacific (Tokyo), Asia Pacific (Singapore), Asia Pacific (Sydney), South America (São Paulo), Europe (Ireland), and Europe (Frankfurt) regions.
If you qualify for the AWS Free Tier, you can use a t2.micro.elasticsearch node for up to 750 hours per month, along with up to 10 gigabytes of Magnetic or SSD-Backed EBS storage at no charge.
— Jeff;