AWS for SAP
Monitor SAP Applications using Amazon CloudWatch Application Insights
Introduction
SAP applications support critical business processes and therefore, customers require a comprehensive view of their SAP applications’ health and actionable insights to maintain the highest levels of security, availability, and performance.
Since 2019, Amazon Web Services customers have been using Amazon CloudWatch Application Insights to monitor applications like Microsoft SQL Server databases and .NET-based applications. In December 2021, we launched Amazon CloudWatch Application Insights for SAP HANA. This makes it easy to understand the health of your SAP HANA databases using native AWS services. In November 2022, we announced additional support within h Application Insights for observability of SAP NetWeaver applications running on AWS. This made it easier to monitor and track the health of SAP NetWeaver ABAP based applications including SAP S/4 HANA, SAP BW/4 HANA and SAP Business Suite running on HANA and AnyDB databases.
How Amazon CloudWatch Application Insights Work for SAP Applications?
Amazon CloudWatch Application Insights enables you to monitor your complete application stack (applications, infrastructure, network, and services) and use alarms, logs, and events data to take automated actions and reduce the time taken to recover from system failures (MTTR). You can collect and access all your performance and operational data in the form of logs and metrics from a single platform rather than monitoring them in silos (server, storage, network, database and application). This frees up important resources and allows you to focus on optimizing your systems further and achieving operational excellence.
CloudWatch Application Insights provides automated setup for observability for your SAP applications so you can get visibility into their health. It identifies and sets up key metrics and logs for application and infrastructure resources, such as database, application servers, operating system, and storage volumes. It constantly monitors this telemetry data to detect and correlate anomalies and errors to notify you of any problems in your application. To aid in troubleshooting, it creates automated dashboards for the detected problems along with additional insights to point you to the potential root cause. This enables you to take quick remedial actions to ensure that your applications are healthy and that end users are not impacted.
CloudWatch Application Insights for SAP NetWeaver provides a comprehensive unified dashboard of your SAP application health by monitoring Amazon EC2, Amazon EBS, Amazon EFS, SAP security, SAP availability, SAP performance and high-availability Pacemaker cluster metrics. CloudWatch Application Insights provides actionable insights by triggering alarms based on predefined thresholds for each metric monitored.
CloudWatch Application Insights for SAP NetWeaver supports the following deployment patterns with HANA and AnyDB database setup:
- Distributed deployment of SAP NetWeaver ABAP based applications across multiple Amazon EC2 instances
- High Availability deployment of SAP NetWeaver ABAP based applications across multiple Amazon EC2 instances within two Availability Zones
CloudWatch Application Insights Setup & Monitoring for SAP Applications
 Simple steps involved in setup and monitoring of SAP Applications using CloudWatch Application Insights
CloudWatch Application Insights provides a guided on-boarding process of SAP applications. To onboard an SAP NetWeaver application in ‘Application Insights’ of the CloudWatch console, choose ‘Add an application’ and simply select the required resource group from the drop down. User and password are not needed for on-boarding the SAP NetWeaver system.
CloudWatch Application Insights automatically discovers resources for SAP NetWeaver system such as Amazon EC2 instances, Amazon EBS volumes, and Amazon EFS file-systems. The deployment pattern of the SAP system is also automatically identified.
 Simple on-boarding process for SAP NetWeaver application and automatic discovery of SAP system topology
CloudWatch Application Insights also configures the monitoring metrics and alarms based on SAP and AWS best practices. The SAP Lens for AWS Well Architected Framework provides guidance on best practices for implementing SAP system health monitoring including the relevant infrastructure and application performance metrics to monitor. Amazon CloudWatch Application Insights help you to follow these best practice recommendations.
Problem detection and notification
CloudWatch Application Insights for SAP NetWeaver observes underlying issues in an SAP system based on alarms, logs and event-bridge events. Application Insights detects problems by correlating the SAP system observations with other infrastructure observations. You can get notified for any alerts via Amazon EventBridge events, AWS Systems Manager Ops Items or you can provide your own Amazon SNS topics. Application Insights for SAP NetWeaver provides automatic alarm creation based on predefined thresholds and anomaly detection.
CloudWatch Application Insights for SAP NetWeaver creates 51 metrics including 2 metrics specifically for high-availability monitoring. These 51 metrics are created automatically when an SAP system is on-boarded into Application Insights. Customers also have the flexibility to choose the metrics based on their monitoring requirements. Application Insights monitors SAP developer trace logs (dev_ files) for 36 different error/log patterns and 4 patterns in Pacemaker cluster logs.
Availability monitoring
Availability is a key system health indicator for many customers. With the built-in metrics provided by CloudWatch Application Insights, SAP administrators can monitor the single points of failure and take necessary remediation steps to avoid unavailability of the SAP application. As part of the dashboard, Cloud Watch Application Insights displays availability related metrics for the SAP NetWeaver system, AWS Infrastructure resources (Amazon EC2, Amazon EBS and Amazon EFS) and Pacemaker HA clustering.
 Various availability metrics provided with Amazon CloudWatch Application Insights for different SAP processes
Here is an example for detecting a problem using application server process availability metrics and taking the necessary remediation actions. The status of a specific SAP Process is shown as Green (OK), Yellow (Warning) and Red (Error).
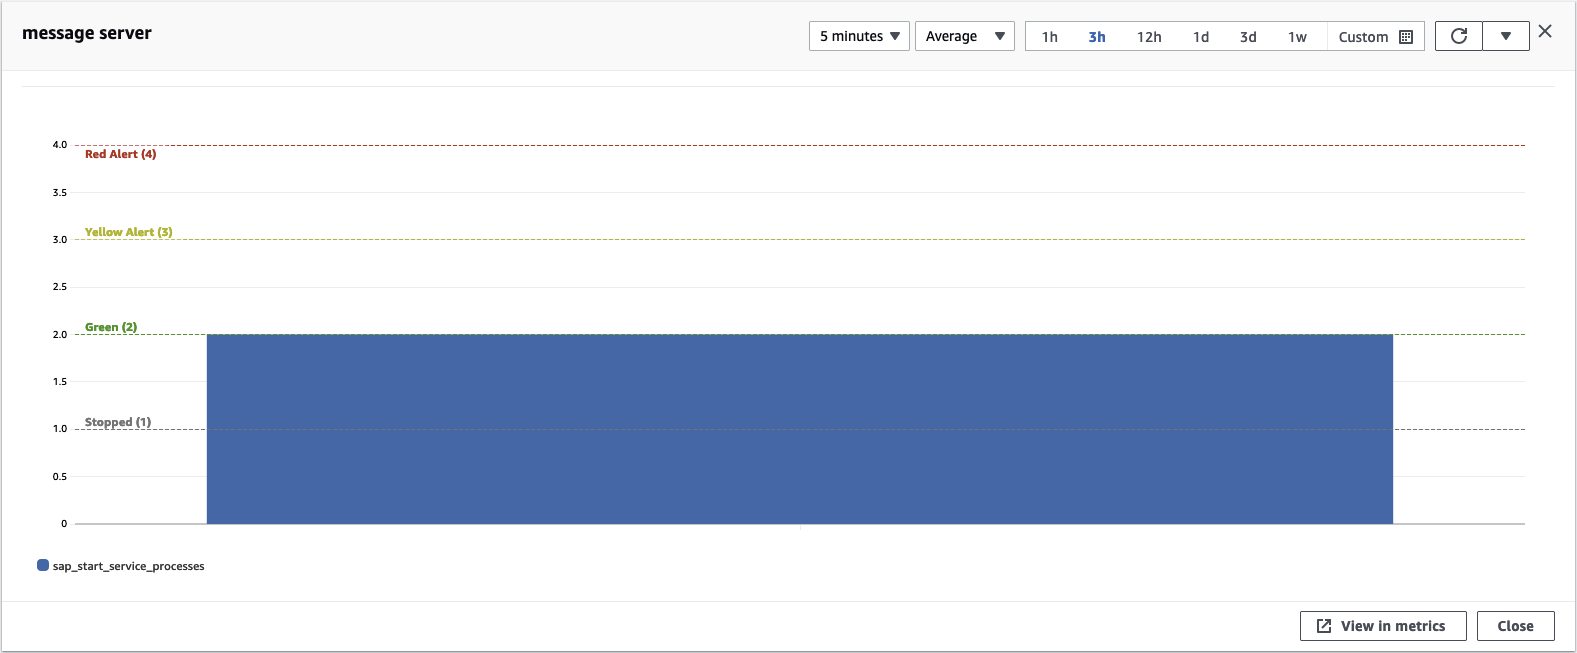 “sap_start_service_processes” metrics provided by Amazon CloudWatch application Insights
You can use the detected problems tab to find out the severity of problem, problem summary, source details, timestamp and status.
 Detected problem summary provided by Amazon CloudWatch Application Insights
When you click on the problem summary, CloudWatch Application Insights provides the problem details and insight to the problem as shown in the below picture.
 Problem details by Amazon CloudWatch application Insights with possible next steps to identify and resolve the problem
You can also monitor and detect problems with the high availability Pacemaker cluster for SAP NetWeaver with CloudWatch Application Insights. Please see this tutorial on setting up monitoring for SAP NetWeaver to find more details about monitoring Pacemaker cluster related issues.
CloudWatch Application Insights is available for customers at no additional cost. AWS resources such as CloudWatch metrics, Logs, Events and SSM Parameters are used by CloudWatch Application Insights to monitor your applications. These resources are charged to your AWS account. Please refer to the pricing section of the CloudWatch Application Insights documentation for more details.
Get started with Application Insights for SAP NetWeaver today
The launch of CloudWatch Application Insights for SAP NetWeaver enables you to monitor SAP applications on AWS including infrastructure components with minimal configuration. You can also detect errors, get alerted on problems within your SAP applications, and then drill down to identify the root cause and take necessary actions. To setup monitoring for your SAP S/4HANA & NetWeaver application today, refer to the Amazon CloudWatch Application Insights documentation for detailed tutorials.
To learn why thousands of SAP customers choose AWS, visit aws.com/sap. In addition, we have recently launched re:Post – A re-imagined Q&A experience for the AWS Community. If your question is not support-related, consider joining the discussion over at re:Post and adding to the community knowledge base.