AWS Big Data Blog
Implement alerts in Amazon OpenSearch Service with PagerDuty
In today’s fast-paced digital world, businesses rely heavily on their data to make informed decisions. This data is often stored and analyzed using various tools, such as Amazon OpenSearch Service, a powerful search and analytics service offered by AWS. OpenSearch Service provides real-time insights into your data to support use cases like interactive log analytics, real-time application monitoring, website search, and more. Analyzing logs can help businesses quickly identify and troubleshoot issues.
However, with the increasing amount of data, it can be challenging to monitor everything manually. Manual monitoring consumes a lot of resources and is hard to maintain as the application landscape changes. We need a sustainable and automated approach to monitor critical applications and infrastructure.
With automated alerting with a third-party service like PagerDuty, an incident management platform, combined with the robust and powerful alerting plugin provided by OpenSearch Service, businesses can proactively manage and respond to critical events. You can use this proactive alerting to monitor data patterns for existing data, monitor clusters, detect patterns, and more.
OpenSearch Dashboard provides an alerting plugin that you can use to set up various types of monitors and alerts. You can use the plugin to set up different monitors, including cluster health, an individual document, a custom query, or aggregated data. These monitors can be used to send alerts to users.
In this post, we demonstrate how to implement PagerDuty as the notification mechanism to get notified based on cluster health status. These notifications can be delivered via various channels, including email, SMS, or custom webhooks (like PagerDuty). The OpenSearch Service alerting plugin supports complex alert rules and provides a user interface to manage them.
Solution overview
PagerDuty is a cloud-based incident management platform that helps businesses handle their alerts and incidents in real time. PagerDuty works by consolidating alerts from various monitoring tools and routing them to the right team member, ensuring that issues are addressed promptly. Many businesses are using PagerDuty for real-time incident notifications via multiple channels, ensuring that the right team members are alerted quickly.
In this post, we describe how to set up PagerDuty and integrate it with an OpenSearch Service custom webhook for alert notifications when a threshold is met.
The following diagram illustrate OpenSearch Service running within an Amazon VPC using monitors and triggers to send a notification to the PagerDuty service using an Events API custom webhook
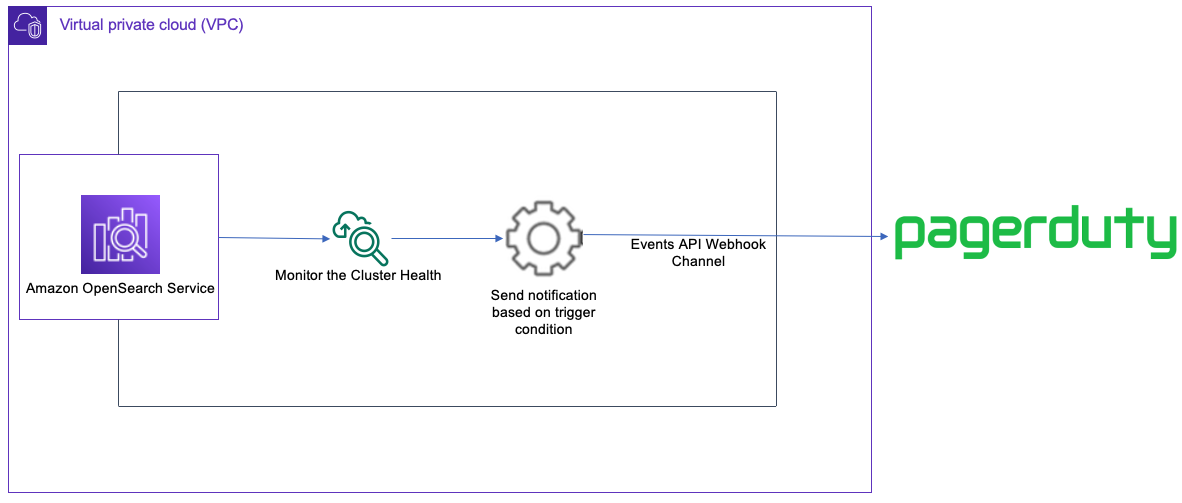
We need to set up a service and integration on PagerDuty to begin receiving incident notifications from OpenSearch Service. A service in PagerDuty represents an application, component, or team that we can trigger the notification against.
Prerequisites
Before you get started, create the following resources, if not already available:
- An AWS account where you can create an OpenSearch Service domain with dashboard access to create monitors and notification channels. For instructions, refer to Creating and managing Amazon OpenSearch Service domains.
- A PagerDuty account with access to create a service and integration.
Create a service on PagerDuty
To create a service on PagerDuty, complete the following steps:
- Log in to PagerDuty using your personal or enterprise account that is being used to enable the integration with OpenSearch Service.
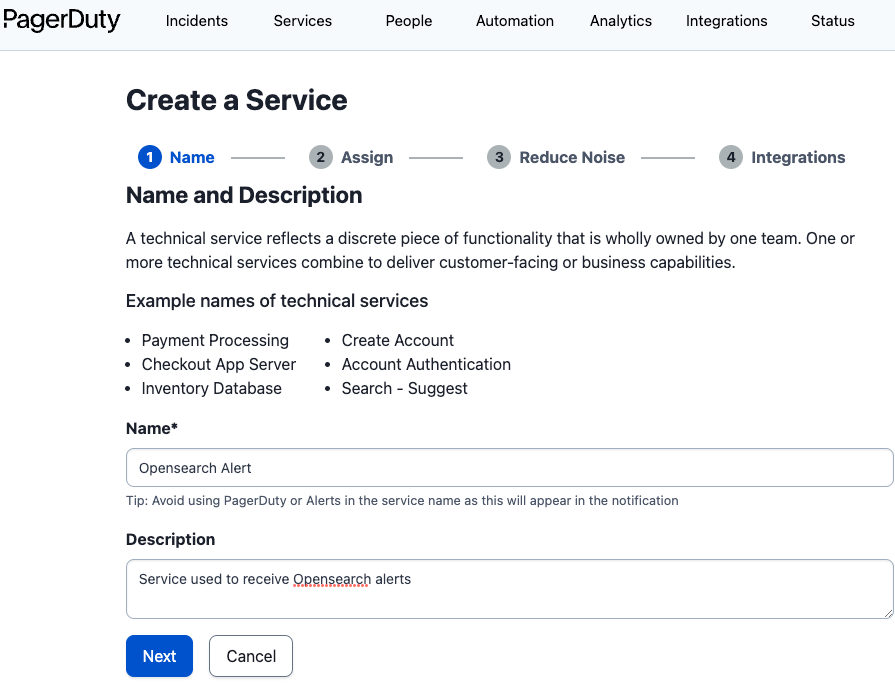
- On the Services tab, choose New Service.
- Enter a name and optional description, then choose Next.
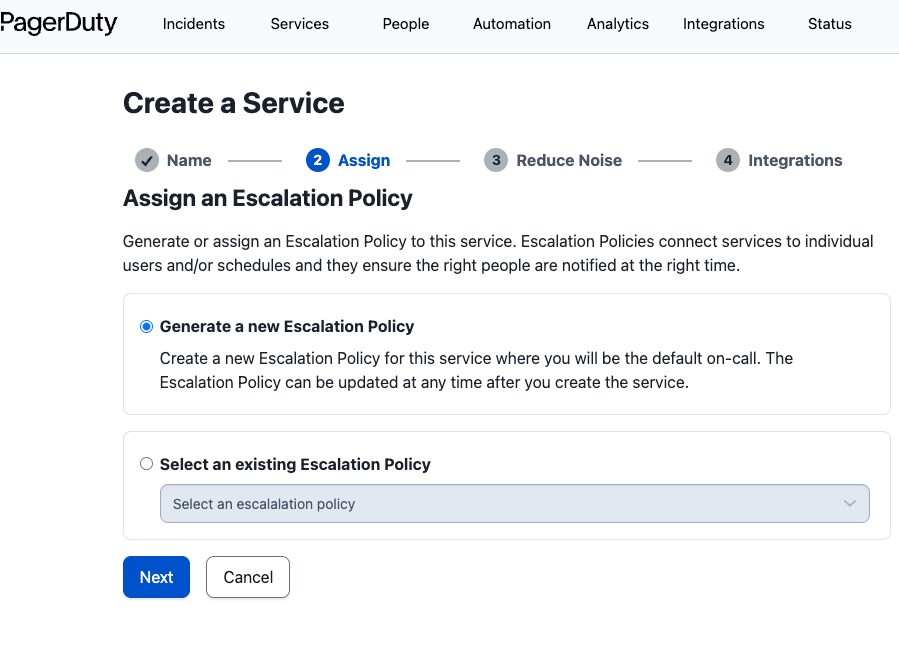
In the next step, we create or assign an escalation policy for the service. An escalation policy represents the order of responsibility for reacting to the issues detected on a service.
- If you already have an escalation policy defined within the organization or team, select Select an existing Escalation Policy and specify your policy. Otherwise, select Generate a new Escalation Policy, then choose Next.
In the next step, we can group the alerts based on time or content:
-
- To group alerts together based on the alert content, select Content-Based grouping.
- To group them based on a specific time duration, select Time-Based grouping.
- Selecting the Intelligent grouping option will group the alerts intelligently based on content or time.
- Leave the defaults and choose Next.
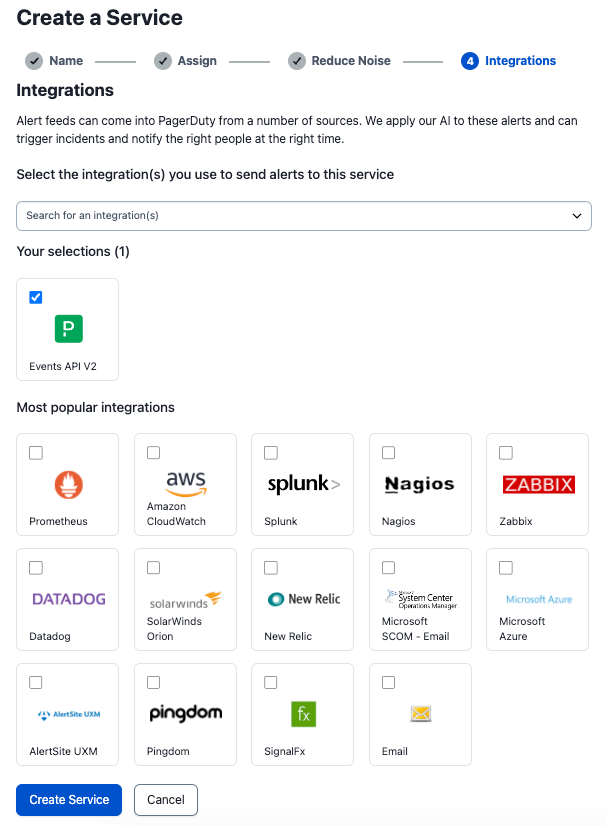
- On the Integrations page, select the Events API V2 integration (this will be used for integration with OpenSearch Service) and choose Create Service.
If you don’t select the integration during this step, you can add it later.
- Take note of the integration key on the Integrations tab.

Create a notification channel on OpenSearch Service with a custom webhook
Custom webhooks provide the ability to send these notifications to third-party services like PagerDuty using a REST API. After we configure the notification channel, we can use it for other monitors beyond this use case and to detect data patterns that are stored within the cluster.
Complete the following steps to configure the notification channel:
- On the OpenSearch Dashboards page, choose Notifications under Amazon OpenSearch Plugins in the navigation pane.
- On the Channels tab, choose Create channel.
- Enter a name for the channel and an optional description.
- For Channel type, choose Custom webhook.
- For Method, choose POST.
- For Define endpoints by, select Custom attributes URL.

- For Host, enter
events.PagerDuty.com. - For Path, enter
v2/enqueue. - Under Webhook headers, choose Add header.
- Enter
X-Routing-Keyas the key and the integration key you obtained earlier as the value.

- Choose Create and ensure the channel is successfully created.
Configure OpenSearch Service alerts to send notifications to PagerDuty
We can monitor OpenSearch cluster health in two different ways:
- Using the OpenSearch Dashboard alerting plugin by setting up a per cluster metrics monitor. This provides a query to retrieve metrics related to the cluster health.
- Integrating with Amazon CloudWatch, a monitoring and observability service.
In this use case, we use the alerting plugin. Complete the following steps:
- On the OpenSearch Dashboards page, choose Alerting under Amazon OpenSearch Plugins in the navigation pane.
- On the Monitors tab, choose Create monitor.
- For Monitor name, enter a name (for example, Monitor Cluster Health).
- For Monitor type, select Per cluster metrics monitor.
- Under Schedule¸ configure the monitor to run every minute.

- In the Query section, for Request type, choose Cluster health.
- Choose Preview query.

- Create a trigger by choosing Add trigger.
- For Trigger name, enter a name (for example, Cluster Health Status is Red).
- Leave Severity level at 1 (Highest).
- Under Trigger condition, delete the default code and enter the following:
- Choose Preview condition response to confirm that Trigger condition response shows as false, indicating that the cluster is healthy.

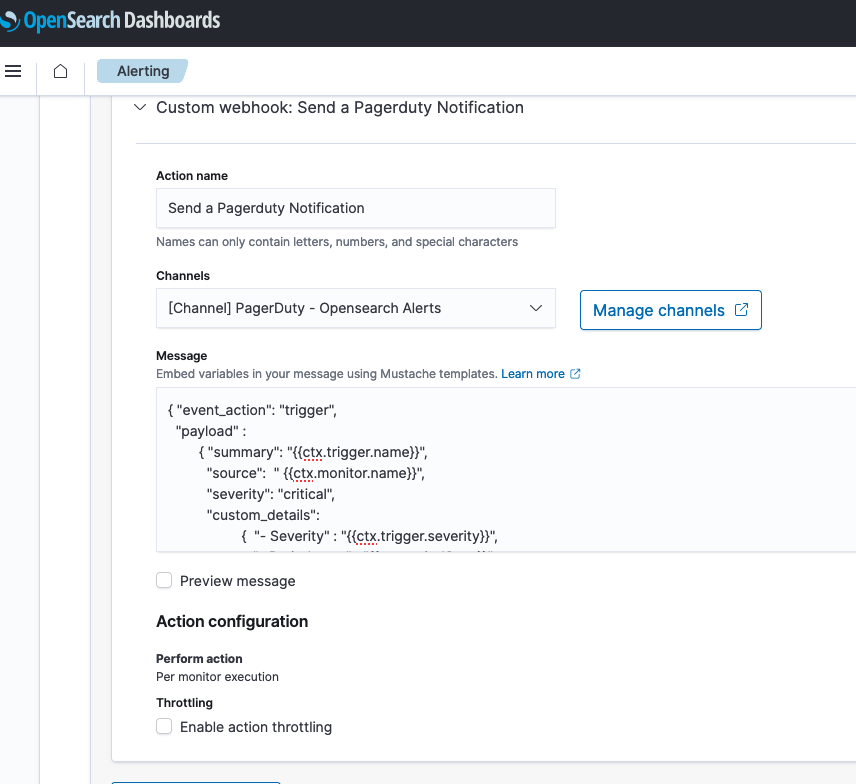
- Under Actions, choose Add action.
- For Action name, enter a name (for example, Send a PagerDuty notification).
- For Channels, choose the channel you created earlier.
- For Message, enter the following code:
Note that apart from the custom_details section in the code, the rest of the fields are mandatory for PagerDuty.
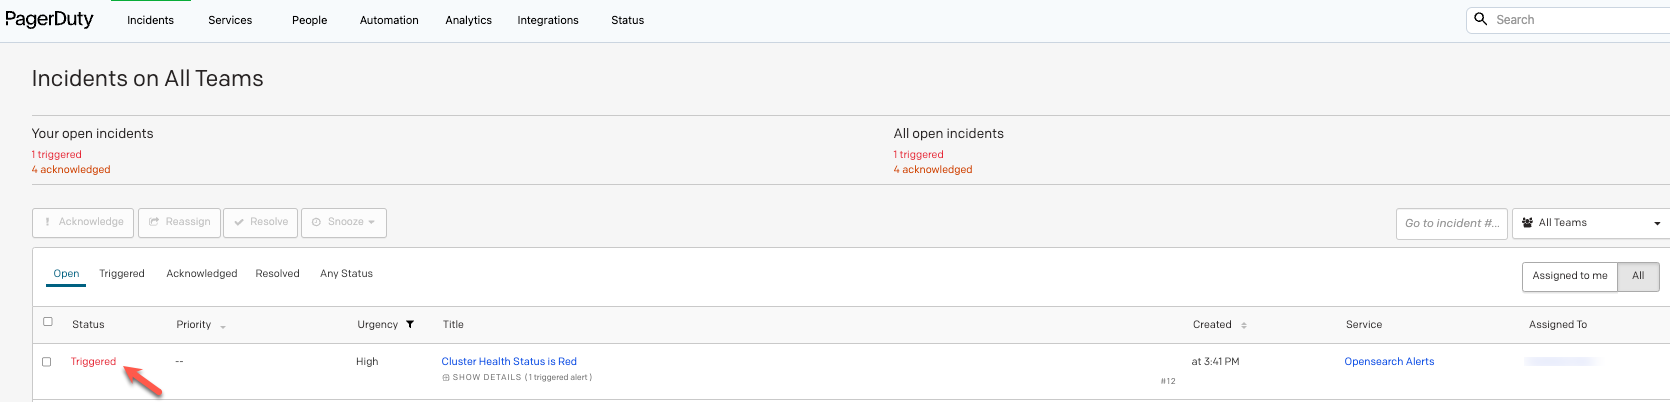
- Choose Send test message and test to make sure you receive an alert on the PagerDuty service.
- Choose Create and ensure the monitor was created successfully.
A notification will be sent to the PagerDuty service as part of the test, which will trigger a notification via a phone call or text message for the person who is available based on the escalation policy defined earlier. This notification can be safely acknowledged and resolved from PagerDuty because this is was a test.
Clean up
To clean up the infrastructure and avoid additional charges, complete the following steps:
- Delete the PagerDuty service.
- Delete the OpenSearch Service domain that was created as part of the prerequisites.
Conclusion
The integration of OpenSearch Service alerts with PagerDuty provides a powerful and efficient solution for managing and responding to critical events in real time. With this integration, you can easily set up alerts and notifications to stay informed about potential issues within your OpenSearch Service clusters or issues related to data and documents stored within the cluster, and proactively take action to resolve any problems that arise. Additionally, the integration allows for seamless collaboration between teams, enabling them to work together to identify and troubleshoot issues as they occur.
For more information about anomaly detection and alerts in OpenSearch Service, refer to Anomaly Detection in Amazon OpenSearch and Configuring Alerts in Amazon OpenSearch.
About the Authors
 Manikanta Gona is a Data and ML Engineer at AWS Professional Services. He joined AWS in 2021 with 6+ years of experience in IT. At AWS, he is focused on Data Lake implementations, and Search, Analytical workloads using Amazon OpenSearch Service. In his spare time, he love to garden, and go on hikes and biking with his husband.
 Vivek Shrivastava is a Principal Data Architect, Data Lake in AWS Professional Services. He is a Bigdata enthusiast and holds 14 AWS Certifications. He is passionate about helping customers build scalable and high-performance data analytics solutions in the cloud. In his spare time, he loves reading and finds areas for home automation
 Ravikiran Rao is a Data Architect at AWS and is passionate about solving complex data challenges for various customers. Outside of work, he is a theatre enthusiast and an amateur tennis player.
 Hari Krishna KC is a Data Architect with the AWS Professional Services Team. He specializes in AWS Data Lakes & AWS OpenSearch Service and have helped numerous client migrate their workload to Data Lakes and Search data stores