AWS Big Data Blog
Viewing Amazon OpenSearch Service Error Logs
Today, Amazon OpenSearch Service announces support for publishing error logs to Amazon CloudWatch Logs. This new feature provides you with the ability to capture error logs so you can access information about errors and warnings raised during the operation of the service. These details can be useful for troubleshooting. You can then use this information to work with your users to identify patterns that cause error or warning scenarios on your domain.
Access to the feature is enabled as soon as your domain is created.
You can turn the logs on and off at will, paying only for the CloudWatch charges based on their usage.
Set up delivery of error logs for your domain
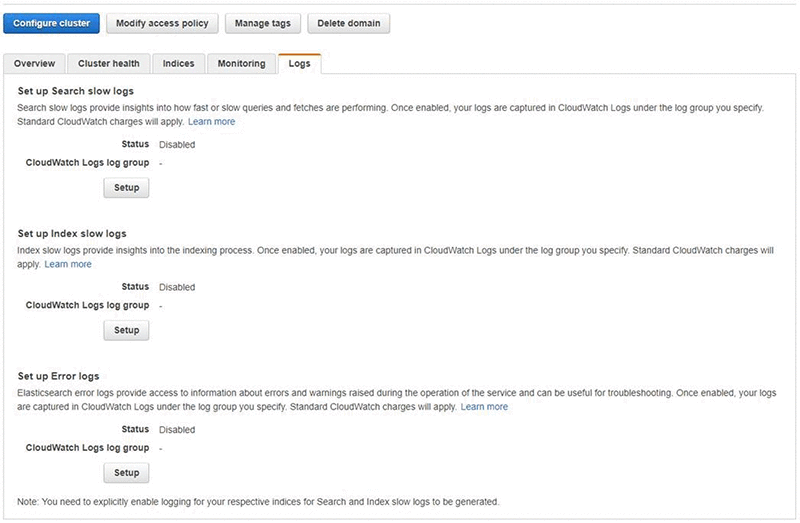
To enable error logs for an active domain, sign in to the AWS Management Console and choose OpenSearch Service. On the Amazon OpenSearch Service console, choose your domain name in the list to open its dashboard. Then choose the Logs tab.

In this pane, you configure your Amazon OpenSearch Service domain to publish search slow logs, indexing slow logs, and error logs to a CloudWatch Logs log group. You can find more information on setting up slow logs in the blog post Viewing Amazon OpenSearch Service Slow Logs on the AWS Database Blog.
Under Set up Error Logs, choose Setup.

You can choose to Create new log group or Use existing log group. We recommend naming your log group as a path, such as:
/aws/aes/domains/mydomain/application-logs/
This naming scheme makes it easier to apply a CloudWatch access policy, in which you can grant permissions to all log groups under a specific path, such as:
/aws/aes/domains
To deliver logs to your CloudWatch Logs group, you need to specify a policy for Amazon OpenSearch Service so it can publish to CloudWatch Logs on your behalf. You can choose to Create a new policy or Select an existing policy. You can accept the policy as is. Or, if your log group names are paths, you can widen the Resource—for example:
arn:aws:logs:us-east-1:123456789012:log-group:/aws/aes/domains/*
You can then reuse this policy for all your domains.

Once you have saved the policy for the domain, Choose Enable, and you have completed setup. Your domain can now send error logs to CloudWatch Logs.

Now that you have enabled the publishing of error logs, you can start monitoring them.
Types of events captured
OpenSearch uses Apache Log4j 2 and its built-in log levels (from least to most severe) of TRACE, DEBUG, INFO, WARN, ERROR, and FATAL. After you enable error logs, Amazon OpenSearch Service publishes log lines of WARN, ERROR, and FATAL to CloudWatch. Less severe levels (INFO, DEBUG and TRACE) are not available.
Based on this, you can expect to find details for events such as the ones highlighted in the following list.
- Rejects based on exceeding the configured
highlight.max_analyzed_offsetparameter limit - Painless script compilation issues in a request
- Detailed information about invalid requests and invalid query formats
- GC cycles
- Detailed information about write blocks
- Issues encountered during snapshot exercises
View your log data
To see your log data, sign in to the AWS Management Console, and open the CloudWatch console. In the left navigation pane, choose the Logs tab. Find your log group in the list of groups and open the log group. Your log group name is the Name that you set when you set up logging in the Amazon OpenSearch Service wizard.
Within your log group, you should see a number of log streams.

Amazon OpenSearch Service creates es-test-log-stream during setup of error logs to ensure that it can write to CloudWatch Logs. This stream contains only a single test message.
Your application error logs arrive within 30 minutes and have long hex names, suffixed by es-application-logs to indicate the source of the log data. Choose one of these to view events based on the last event time.

You should see individual entries for each event in timestamp order. To switch from less granular detail to highly granular detail on the event log entry, you can use a toggle at the top right of the CloudWatch Logs console. The format is a timestamp, the locus, the node generating the error or warning, and text cleansed of any specifics on the cluster itself such as you see in this stack trace.
Conclusion
By enabling the error logs feature, you can gain more insight into issues with your Amazon OpenSearch Service domains and identify issues with domain configurations. Additionally, you can also use the integration of CloudWatch Logs and Amazon OpenSearch Service to send application error logs to a different Amazon OpenSearch Service domain and monitor your domain’s performance.
About the Author
 Kevin Fallis is an AWS solutions architect specializing in search technologies.