AWS Compute Blog
Visualizing the impact of AWS Lambda code updates
This post is written by Brigit Brown (Solutions Architect), and Helen Ashton (Observability Specialist Solutions Architect).
When using AWS Lambda, changes made to code can impact performance, functionality, and cost. It can be challenging to gain insight into how these code changes impact performance.
This blog post demonstrates how to capture, record, and visualize Lambda code deployment data with other data in an Amazon CloudWatch dashboard. This solution enables serverless developers to gain insight into the impact of code changes to Lambda functions and make data-driven decisions.
There are three steps to this solution:
- Capture: Lambda function code updates using Amazon EventBridge.
- Record: Lambda function code updates by creating an Amazon CloudWatch metric.
- Visualize: The relationship between Lambda function code updates and application KPIs by creating a CloudWatch dashboard.
Overview
EventBridge and CloudWatch are used to monitor and visualize the impact of code changes to Lambda functions on key application metrics.

Step 1: Capturing
AWS CloudTrail records all management events for AWS services. These are the operations performed on resources in your AWS account and include Lambda function code updates.
An EventBridge rule can listen for Lambda functions code updates and send these events to other AWS services, in this case to CloudWatch.
You can create EventBridge rules using an example event syntax as reference. To get the example event, update the code of a Lambda function and search in CloudTrail for all events with Event source of lambda.amazonaws.com, and an Event name starting with UpdateFunctionCode. UpdateFunctionCode is one of many events captured for Lambda functions. For example:
{
  "eventVersion": "1.08",
  "userIdentity": {
    "type": "AssumedRole",
    "principalId": "x",
    "arn": "arn:aws:sts::xxxxxxxxxxxx:assumed-role/Admin/x",
    "accountId": "xxxxxxxxxxxx",
    "accessKeyId": "xxxxxxxxxxxxxxxxx",
    "sessionContext": {
      "sessionIssuer": {
        "type": "Role",
        "principalId": "x",
        "arn": "arn:aws:iam::xxxxxxxxxxxx:role/Admin",
        "accountId": "xxxxxxxxxxxx",
        "userName": "Admin"
      },
      "webIdFederationData": {},
      "attributes": {
        "creationDate": "2022-09-22T16:37:04Z",
        "mfaAuthenticated": "false"
      }
    }
  },
  "eventTime": "2022-09-22T16:42:07Z",
  "eventSource": "lambda.amazonaws.com",
  "eventName": "UpdateFunctionCode20150331v2",
  "awsRegion": "us-east-1",
  "sourceIPAddress": "AWS Internal",
  "userAgent": "AWS Internal",
  "requestParameters": {
    "fullyQualifiedArn": {
      "arnPrefix": {
        "partition": "aws",
        "region": "us-east-1",
        "account": "xxxxxxxxxxxx"
      },
      "relativeId": {
        "functionName": "example-function"
      },
      "functionQualifier": {}
    },
    "functionName": "arn:aws:lambda:us-east-1:xxxxxxxxxxxx:function:example-function",
    "publish": false,
    "dryRun": false
  },
  "responseElements": {
    "functionName": "example-function",
    "functionArn": "arn:aws:lambda:us-east-1:xxxxxxxxxxxx:function:example-function",
    "runtime": "python3.8",
    "role": "arn:aws:iam::xxxxxxxxxxxx:role/role-name",
    "handler": "lambda_function.lambda_handler",
    "codeSize": 1011,
    "description": "",
    "timeout": 123,
    "memorySize": 128,
    "lastModified": "2022-09-22T16:42:07.000+0000",
    "codeSha256": "x",
    "version": "$LATEST",
    "environment": {},
    "tracingConfig": {
      "mode": "PassThrough"
    },
    "revisionId": "x",
    "state": "Active",
    "lastUpdateStatus": "InProgress",
    "lastUpdateStatusReason": "The function is being created.",
    "lastUpdateStatusReasonCode": "Creating",
    "packageType": "Zip",
    "architectures": ["x86_64"],
    "ephemeralStorage": {
      "size": 512
    }
  },
  "requestID": "f566f75f-a7a8-4e87-a177-2db001d40382",
  "eventID": "4f90175d-3063-49b4-a467-04150b418457",
  "readOnly": false,
  "eventType": "AwsApiCall",
  "managementEvent": true,
  "recipientAccountId": "113420664689",
  "eventCategory": "Management",
  "sessionCredentialFromConsole": "true"
}
The key fields are eventSource, eventName, functionName, and eventType. This is the event syntax containing only the key fields.
{
    "eventSource": "lambda.amazonaws.com",
    "eventName": "UpdateFunctionCode20150331v2",
    "responseElements": {
        "functionName": "example-function"
        }
    "eventType": "AwsApiCall",
}
Use this example event as a reference to write the EventBridge rule pattern.
{
  "source": ["aws.lambda"],
  "detail-type": ["AWS API Call via CloudTrail"],
  "detail": {
    "eventSource": ["lambda.amazonaws.com"],
    "eventName": [{
      "prefix": "UpdateFunctionCode"
    }],
    "eventType": ["AwsApiCall"]
  }
}
In this EventBridge rule, the detail section contains properties to match the original UpdateFunctionCode event pattern. The values to match are in square brackets using EventBridge syntax.
The eventName changes with each UpdateFunctionCode event, including date and version information within the value (i.e. UpdateFunctionCode20150331v2) and so a prefix matching filter is used to match the start of the eventName.
The source and the detail-type of the event are two additional fields included by EventBridge. For all Lambda CloudTrail calls, the detail-type is [“AWS API Call via CloudTrail”] and the source is “aws.lambda“.
Next, send an event to CloudWatch. Each EventBridge rule can send events to multiple targets, including Amazon SNS and CloudWatch log groups. Choose a target of CloudWatch log groups, with the log group specified as /aws/events/lambda/updates. EventBridge creates this log group in CloudWatch.

Finally, test the EventBridge rule.
- To trigger an event, change the code for any Lambda function and deploy.

AWS Console
- To view the event, navigate to the CloudWatch console > Logs > Log groups.

Log group
- Choose the log group (/aws/events/lambda/updates).
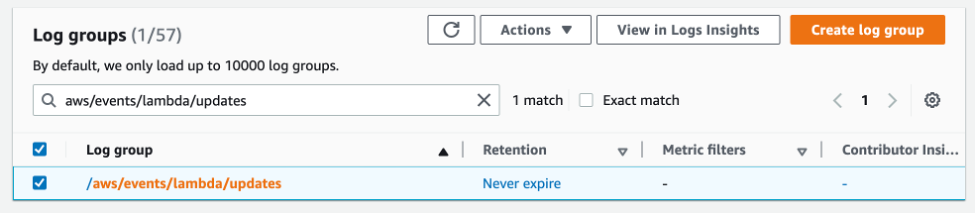
Selected log group
- Select the most recent log stream.

Recent log stream
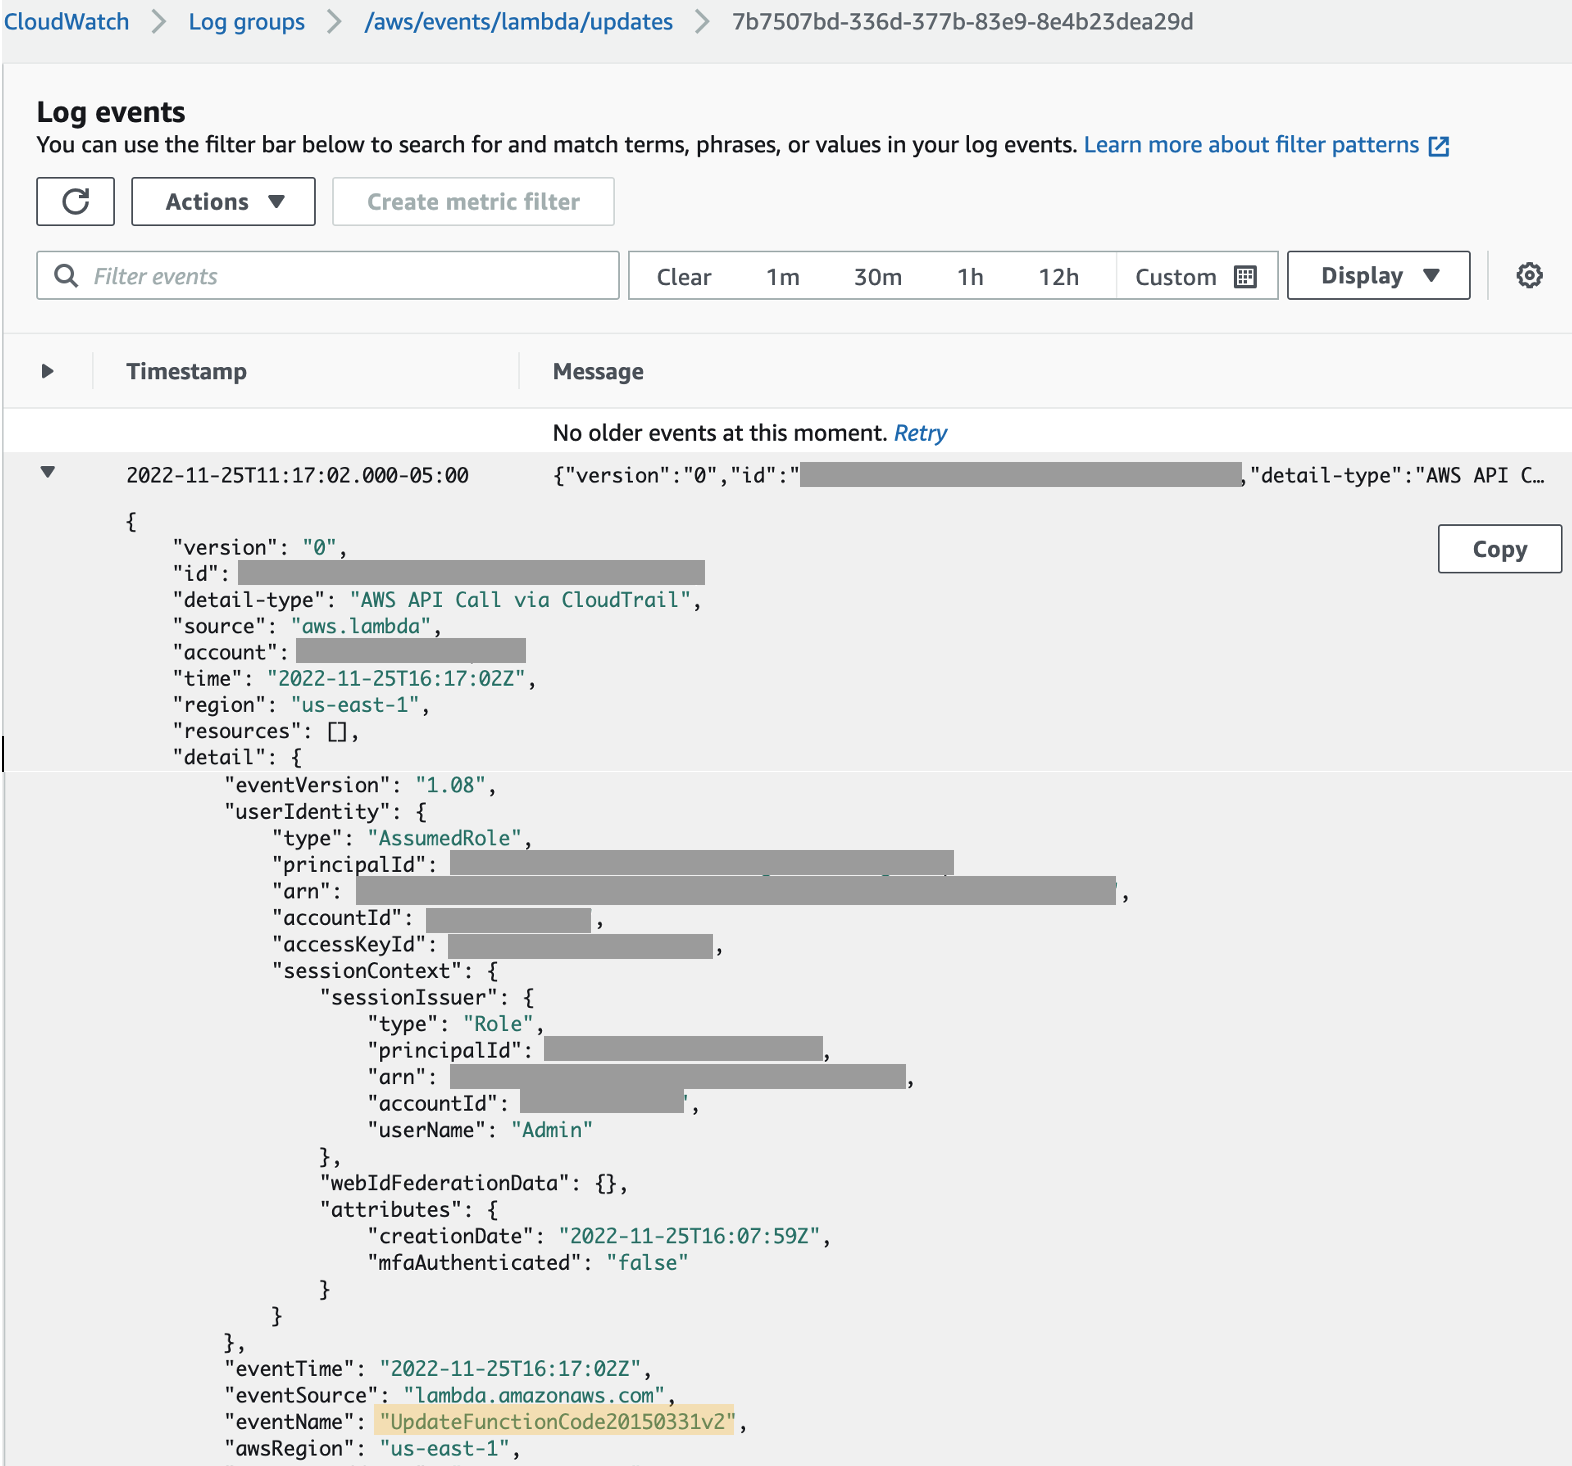
- If the EventBridge rule is successful, the Lambda code update event is visible. To see the JSON from the event, expand the event with the arrows to the left and see the detail field.

Expanded view of event
Step 2: Recording
To display the Lambda function update data alongside other CloudWatch metrics, convert the log event into a metric using metric filters. A metric filter is created on a log group. If a log event matches a metric filter, a metric data point is created.
A metric filter uses a filter pattern to match on specific fields in the JSON event. In this case, the filter pattern matches on the eventName starting with UpdateFunctionCode (note the star as a wildcard).
{ $.detail.eventName=UpdateFunctionCode* }
Create a metric filter with the following:
- Metric namespace: LambdaEvents
- Metric name: UpdateFunction
- Metric value: 1
- Dimensions: DimensionName: FunctionName; Dimension Value: $.detail.responseElements.functionName
Dimensions allow metadata to be added to metrics. Setting a dimension with the JSON path to $.detail.responseElements.functionName allows the FunctionName value to come from the data in the log event. This makes this a generic metric filter for any Lambda function.
The event pattern of a metric filter can be tested on real data in the Test pattern section. Choose the log stream to test the filter on by using the Select log data drop down and selecting Test pattern. This shows a table with the matched events and the field value.
The CloudWatch console provides a view of the metrics for Lambda functions. To see the metric data, update the code for a Lambda function and navigate to the CloudWatch console. Choose Metrics > All metrics from the left menu, the Custom namespace of LambdaEvents, and dimension of FunctionName (as set in the preceding metric filter). To see the data on the chart, check the box beside the metric of interest. The metric can be added to a CloudWatch dashboard under the Actions menu.
Metric filters only create metrics when a new log event is ingested. You must wait for a new log event to see the metrics.
Step 3: Visualizing
A CloudWatch dashboard enables the visualization of metric data and creation of customized views. The dashboard can contain multiple widgets with data from metrics, logs, and alarms.
The following dashboard shows an example of visualizing Lambda code updates alongside other performance data. There is no single visualization that is right for everyone. The data added to the dashboard depends on the questions and actions the business wants to take. This data can be varied and include performance data, KPIs, and user experience.
The dashboard displays data on Lambda function code updates and Lambda performance (duration). A metric line widget shows a time chart of Lambda function duration with the update Lambda code metric data. Duration is a performance metric that is provided for all Lambda functions. Read more in Working with Lambda Function metrics.
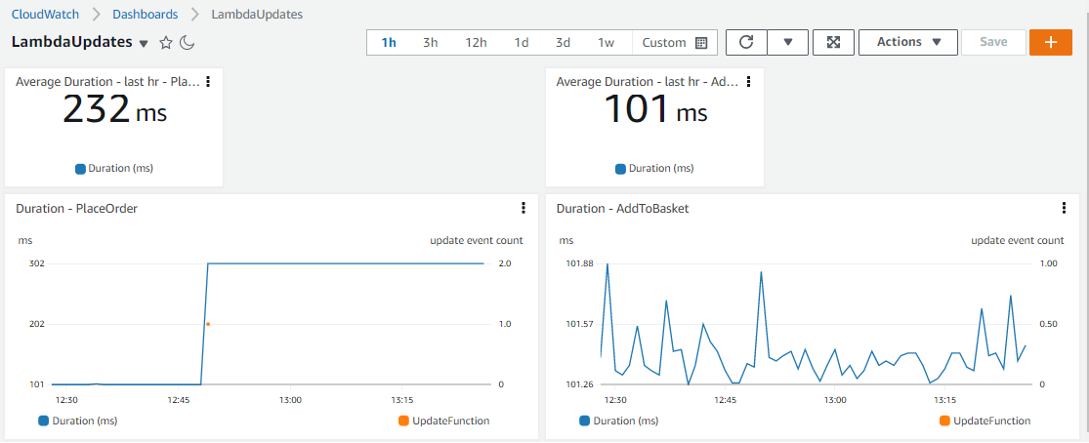
This screenshot shows the Lambda function duration for two different functions: PlaceOrder and AddToBasket. The duration for each function is represented in two ways:
- A single number showing the average duration in the last hour.
- A chart of the duration over time.
The Lambda function update event is shown on the duration time chart as an orange dot. The different views of duration show a high-level value and the detailed behavior over time. The detailed behavior is important to understanding the outcome. With only the high-level value, it is difficult to see if an increase in the hourly duration results from a short-term increase in duration, an upward trend, or a step change in behavior.
What is clear from this dashboard is that immediately following an update to the Lambda code, the PlaceOrder function duration dramatically increases from an average of ~100ms to ~300ms. This is a step change in behavior. The same deployment does not have the same impact on the duration of the AddToBasket function. While the duration is increasing near the end of the time period, it is less clear that this is because of the deployment. This dashboard provides awareness to the impact of the change at a function level so that the business can decide if the impact is acceptable.
Resources for creating your own dashboard
- Explore the default Lambda metrics that may be useful.
- Learn more about Creating and working with widgets on CloudWatch dashboards including the metric number widgets, the metric line (time chart) widgets, and the text widgets.
- Explore the dashboard section of the One Observability workshop for hands-on practice.
Conclusion
This blog demonstrates how to create an EventBridge rule and CloudWatch dashboard to visualize the impact of Lambda function code changes on performance data. First, an EventBridge rule is created to capture Lambda function code update events recorded in CloudTrail. EventBridge sends the event to CloudWatch where UpdateFunctionCode events are stored as a metric. The UpdateFunctionCode event data is visualized in a CloudWatch dashboard alongside Lambda performance data. This visibility enables teams to better understand the impact of code changes and make data-driven solutions.
You can modify the concepts in this blog and apply them to a wide variety of use cases. EventBridge can capture AWS CodeCommit and AWS CloudFormation deployments, and send the events to a CloudWatch dashboard to visualize alongside other metrics.
For more serverless learning resources, visit Serverless Land.