AWS Database Blog
How to plan and optimize Amazon Aurora with MySQL compatibility for consolidated workloads
Amazon Aurora with MySQL compatibility is a popular choice for customers looking to consolidate database workloads. Aurora MySQL is a relational database engine that combines the speed and reliability of high-end commercial databases with the simplicity and cost-effectiveness of open-source databases. It also delivers up to five times the throughput of the standard MySQL community edition.
In this blog post, I provide some guidance to help you optimize Amazon Aurora for large consolidated database workloads. I also answer common questions, such as “How much can I consolidate?” and “How big can my dataset get?” Although these questions are simple, they don’t always have simple answers. The answers depend a lot on your dataset and workload patterns.
Database consolidation defined
For consolidation use cases, I focus on the following dimensions and then discuss in greater detail how Aurora MySQL operates in their context:
- The size of the tables. A common outcome of consolidation is bigger tables. If you’re in the ad tech, IoT, or consumer applications space, you typically split the database of a large homogeneous application into many shards, each containing a subset of the data. With Aurora, you might not do away with sharding entirely, but you consolidate into fewer shards to reduce operational overhead.
- The number of tables. Larger numbers of tables are also an outcome of consolidation. This outcome is common in SaaS applications that require tenant isolation, where each tenant usually has their own database, or set of tables. Multiple tenants of this type are packed together on fewer and larger Aurora clusters to reduce operational cost per tenant.
- The utilization of the database. Utilization of the consolidated database workload increases across a number of metrics, including higher numbers of concurrent connections.
In practice, you encounter increases across several of these dimensions in the same project. The guidance following should help you optimize your workload across these dimensions.
How big is big?
Amazon Aurora does have some maximum limits. The most significant for our purposes is the maximum storage volume size of 64 TB for an Aurora cluster. The volume maximum size provides the upper limit on how much data you can physically store in your Aurora cluster. It also provides the upper limit on how large an individual table can be.
In addition, as a MySQL-compatible database engine, Aurora MySQL inherits many characteristics from MySQL and the InnoDB storage engine. Some of these influence how much you can consolidate effectively.
How to optimize for large table sizes
Amazon Aurora stores data using 16 KiB pages. Pages are grouped into tablespaces, which act as containers for tables and the associated indexes. By default, Aurora uses a separate tablespace for each table, or for each partition of a table if the table is partitioned. Most of what such a tablespace contains is the following data structures:
- The clustered index containing the table records, ordered by the primary key or unique key of the table. If neither key is available, an internal monotonically increasing row ID is used to identify and order the records.
- The secondary indexes of the table.
- Externally stored values for variable-length fields (BLOB, TEXT, VARCHAR, VARBINARY, and so on) that don’t fit in the clustered index record.
The table architecture preceding means there isn’t a fixed maximum number of rows that you can store in a given table. The maximum row number depends on a number of factors:
- The maximum number of unique values supported by your primary key or unique key choice. For example, if you use an unsigned INT data type for the primary key (a popular choice), your table supports a maximum of 232 or a little over 4.29 billion rows.
- The number and size of your secondary indexes.
- The amount of variable-length data that is stored either directly in the clustered index records, or on external pages.
- How effectively data pages are utilized.
Your schema design and query patterns are more important factors than the number of rows in determining how much you can effectively consolidate a table in practice. As the number of rows in a table increases, so does the size of the clustered index and secondary indexes and the time it takes to traverse these indexes. Therefore, your query performance decreases with the size of the table. Let’s look at some of the best practices and ways to mitigate performance decreases in greater depth.
Designing schemas for tables with large numbers of records
The density of records per page, in context of your query patterns and schema, becomes increasingly relevant at large table sizes. The maximum row length in Aurora MySQL, excluding variable-length data, is a little less than 8 KB in size (half of the data page). The database manages pages to maintain storage efficiency, without sacrificing performance. Just like InnoDB in MySQL community edition, Aurora MySQL leaves a portion of the page unfilled in order to accommodate future writes and reduce the number of page splits. It also attempts to merge pages together if the fill ratio drops following 50 percent. Because the pages are never completely full, there’s always a certain amount of storage overhead.
Optimal schema design is the best way to ensure that useful overhead doesn’t turn into excessive storage waste. Such waste translates into higher resource utilization and latency, pushing your workload beyond what you would consider acceptable performance.
There are two overarching guidelines for effective schema design:
- All information in a given table row should be equally valuable. That is, you should query and manipulate data in all the fields of the row equally frequently. Storing hotter and colder data in the same row breeds inefficiencies.
- Always choose the smallest data type that you can to represent the values stored in a given column. The savings at the individual row level might appear minimal, but the effect is magnified across potentially billions of rows, becoming significant.
If your schema contains variable-length fields, Aurora MySQL tries to store as much variable-length data in the clustered index record as it can fit, with the rest stored on external pages. Large data records result in lower density of records on data pages, causing decreased query performance. But you might still want large records if your queries predominantly affect all record data (reads and writes), including the variable-length fields. If that’s not the case, you might find it beneficial to offload such large fields to separate tables. Better yet, you can store them outside of the database entirely in an object store, such as Amazon S3.
Indexes are effective at increasing query performance. However, they come at an additional cost, consuming additional storage and memory footprint and reducing write performance. Secondary index records don’t point directly to the physical storage coordinates of a row. Instead, they point to a primary key value for that row. Consequently, every secondary index record contains a copy of the primary key value for the underlying row.
Therefore, composite primary keys also cause larger index records, and ultimately lower storage and I/O efficiency. Use only the indexes that you need and remember that index selectivity moves from left to right in composite indexes. You might have an opportunity to reduce the number of indexes, by replacing them with fewer composite indexes, if your query patterns allow following that selectivity rule.
Ultimately, by using an effective schema design you can have tables with a larger number of rows before you encounter unacceptable performance. But what that maximum row number is depends in practice on your data and how you interact with it.
Querying tables with large numbers of records
Partitions (and subpartitions) are a tool to mitigate performance decreases in large tables. Because each partition is stored in a separate tablespace by default, it contains the clustered index, secondary indexes, and external pages for that specific subset of data, as determined by the partitioning expression. You can have up to 8,192 partitions and subpartitions per table. However, large numbers of partitions create performance problems of their own. These include increased memory utilization and performance issues for queries that use a large number of partitions.
As the index structures in partitions are smaller, they are faster to traverse. If your query patterns are selective to a single partition, or a very small set of partitions (an optimization called partition pruning), you might see performance benefits. However, queries that are not selective to a few specific partitions, for example queries with predicates that don’t include the partitioned columns, might be slower. This effect occurs because with partitions, the engine has to traverse multiple smaller indexes instead of a single bigger one. The performance impact of large partitioned tables thus depends on how effectively you can take advantage of partition pruning or selection in your workload.
With large tables, having accurate statistics is important for the query optimizer. Accurate statistics ensure that the query optimizer uses the most selective indexes with the correct cardinality, thus improving query performance. By default, Aurora MySQL samples 20 random index pages to estimate statistics and cardinality. However, this number might be insufficient when dealing with very large tables, or tables with nonuniform value distribution within columns. Also by default, statistics are persisted to disk and are recalculated automatically after the table undergoes substantial changes. An example is a data manipulation language (DML) operation affecting more than 10 percent of rows.
As changes of this magnitude are less frequent with very large tables, statistics can become less accurate over time. In turn, the performance of affected queries degrades progressively over time, or even abruptly, as a critical point is reached and the query optimizer changes the execution plan. If you suspect this to be a problem, review the query execution plan using the EXPLAIN statement to pinpoint changes from expected behavior.
We also recommend that you establish a baseline expected performance for key workload queries and monitor their performance over time. The slow query log is effective at logging queries that cross a certain threshold, but less effective at capturing slow degradation over time. To monitor performance of queries on an ongoing basis, in the MySQL 5.6-compatible version you can use the MySQL Performance Schema. However, be aware that enabling it increases memory consumption and also might degrade overall system performance.
There are two mechanisms to improve accuracy of statistics:
- Monitoring the age of the table and index statistics for the relevant tables using the MySQL system schema (
INNODB_TABLE_STATSandINNODB_INDEX_STATS) then runningANALYZE TABLEto update statistics as appropriate. - Customizing the DB parameter group for your DB instances, and increasing the number of pages that are being sampled to increase accuracy (see the table following). However, the increase in pages sampled also increases the duration that it takes to compute statistics.
| DB Parameter | Value | Description |
| innodb_stats_persistent_sample_pages | 256 | A global parameter for pages sampled when statistics are persisted to disk. You can also configure this parameter on a per table basis. |
| innodb_stats_transient_sample_pages | 256 | A global parameter similar to the preceding but used when statistics are not persisted to disk. |
Handling frequent changes to your data schema of large tables
How big can your tables be before data definition language (DDL) operations become problematic? Size is one factor, but how active your table is might matter more. If your table is sustaining thousands of writes per second, even relatively small tables with a few million records or less can prove problematic to execute DDL operations on.
If your workload, or updates to your workload, rely on frequent DDL operations and schema changes, those actions can limit your ability to use very large tables. This behavior is similar to how MySQL community edition operates. Offline DDL operations copy your data to a new tablespace in the correct schema; therefore, you need to have adequate free capacity available. They also lock the table for the extent of the operation, which is disruptive to normal workloads. Online DDL operations, when they can be performed, change table data directly. However, they buffer new writes to the table in temporary space, locking the table only when those writes are merged back. With workloads that generate very large numbers of writes to tables undergoing long-running, online DDL operations, the amount of changes to be merged is relatively large. This size contributes to the locking merge phase taking longer. In an extreme case, the temporary space might be exhausted before the table change operation completes, effectively preventing the online DDL operation from completing.
Aurora MySQL also supports Fast DDL, which allows you to add a nullable column at the end of a table as a near instantaneous operation. This feature helps mitigate some of the DDL pain described preceding. For DDL operations that can’t be efficiently handled by regular DDL or Fast DDL operations, you can consider using the Percona Online Schema Change Tool to execute the operation. If the tool applies to your use case, it can perform DDL operations in a less disruptive manner, but the operation takes longer on very large tables.
How to optimize for large numbers of tables
Consolidated workloads can also result in large numbers of tables stored in your Aurora cluster. In practice, the number of tables that can be reasonably consolidated onto a single Aurora cluster, depends on your workload and access patterns.
Unlike MySQL community edition, where the file system characteristics limit database scalability in terms of size and number of tables, Aurora MySQL uses a purpose-built, distributed log structured storage service. Therefore, many of the reasons you use custom tablespace configurations in MySQL to mitigate the inherited limitations of the file system don’t apply to Aurora. There is no file system–related impact from having a lot of tables, either operationally or from a failure recovery perspective. Although you can turn off the inndb_file_per_table option using Aurora custom DB cluster parameter groups, we don’t recommend it, because it no longer affects performance or recovery time.
However, large numbers of tables in Aurora do affect memory utilization. The memory consumption on an Aurora cluster with default parameters is as follows.
| DB Instance Memory Used | Consumer |
| 3/4 | Buffer pool (page cache), which stores recently accessed data pages. You can change this configuration in the DB parameter group. However, reducing the size of the buffer pool is typically undesirable. The relevant Amazon CloudWatch metrics to track for buffer pool effectiveness are buffer pool cache hit rate and read IOPS to storage. |
| 1/24 | Query cache. Unlike MySQL community edition, where the query cache is being deprecated and disabled as of version 5.7.20, Aurora has a reworked query cache. This query cache doesn’t suffer from the limitations of the implementation in the community edition. We recommend leaving the query cache enabled, unless you’re confident that your queries are not cacheable, and you want to reclaim the memory for use with other buffers and caches. |
| Remainder | The rest of the available memory (about 20.8 percent) is used by various other less predictable consumers, such as database engine buffers and caches that are either global or specific to a connection or session and operating system and managed service processes. Some of this memory might be free or freeable. |
Optimizing table-related caches when using large numbers of tables
Two caches are particularly relevant for workloads with large numbers of tables. Their misconfiguration can potentially cause performance and stability issues.
The table cache (or table open cache) stores handler structures for tables opened as a result of user activity. A table is opened independently by each session, so the cache can contain multiple items for the same table if there’s multiple concurrent sessions accessing it. In Aurora, we have increased the default size of this cache up to 6,000 open tables for DB instances in the r4 class. However, this is a soft limit. This cache can become a significant memory consumer based on the number of tables (and partitions in those tables) involved in your SQL statements. This effect is amplified by the number of concurrent sessions that your workload is running on the database.
The table definition cache stores the definition of a table (schema, metadata) for commonly accessed tables in memory. The more active tables you have, the better it is to have their definitions cached. With Aurora, we have increased the default size of that cache to store up to 20,000 definitions for DB instances in the r4 class. This cache can therefore become a significant memory consumer. With workloads that use hundreds of thousands of tables, there is also an incentive to increase the size of this cache beyond the default value, if most of those tables are active. This cache size is also a soft limit. The MySQL database engine doesn’t evict table definitions for parent-child foreign key related tables. Thus the total size of the cache can exceed the cache size limit.
Therefore, efficient memory utilization can practically limit the number of tables that you can operate on an Aurora cluster with instances of a given size. To mitigate the footprint of these caches, you might have to use a larger DB instance class to accommodate them. Alternatively, you might need to reduce the amount of memory allocated to the query cache or buffer pool to compensate. This reduction in turn might impact workload performance in other ways, because less of your working data sets fits in memory. But it’s difficult to pinpoint an exact number of tables that is “too many.” The following examples illustrate better some of these effects.
The chart following shows the free memory reported through Enhanced Monitoring metrics of a sysbench read and write OLTP test on a database with 1,000 tables, using just 40 concurrent connections. This workload ran for just 10 minutes on an Aurora MySQL 5.6 compatible db.r4.2xlarge DB instance with 61 GB of memory, a popular instance class choice.
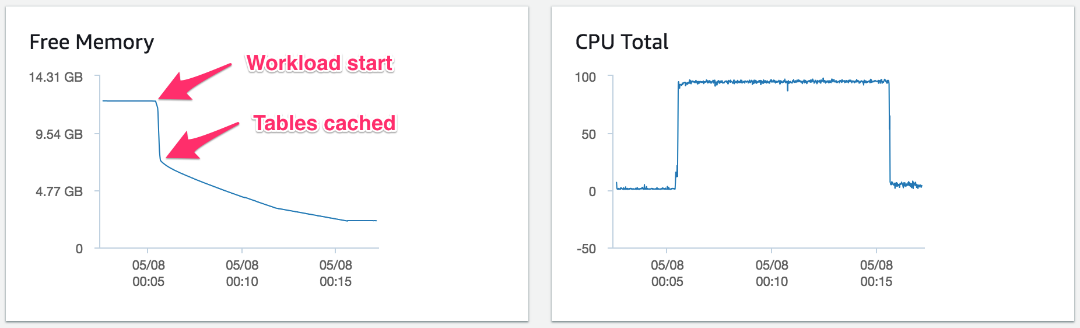
For this test, the following command prepares the database and tables before the test runs:
The free memory of the system drops suddenly from over 12.2 GB by 5 GB when the test commences, and CPU resources are almost fully exhausted throughout the test. Unlike MySQL community edition, Aurora preallocates the buffer pool, and in the test preceding it was already warm. We performed the test with a comparatively small number of active tables (1,000) and total concurrent connections (40). The memory consumption is predominantly due to the table cache and the amplification effect each connection has when large numbers of active tables are involved.
The table_open_cache parameter in the DB instance parameter group controls the size of the table cache. By default, this parameter is set using the formula following:
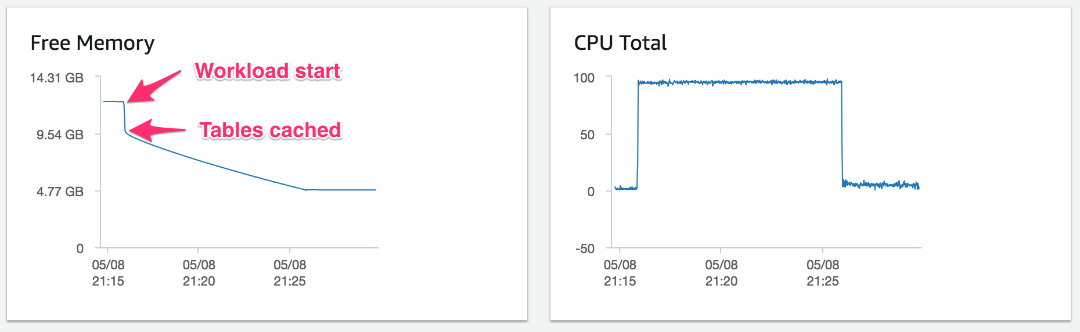
For comparison, the chart following represents a similar test. The only difference is that the test is accessing only 500 tables. Here, the free memory of the system also drops suddenly from over 12.2 GB by about 2.5 GB when the test commences.
The following example illustrates the effect of the table definition cache when large numbers of tables are used. The example workload in this test creates 100,000 simple tables, each with an autoincrementing integer primary key, a timestamp column, a floating point column, and two short string columns. The test inserts one row into each simple table using a single connection, running on an Aurora MySQL 5.7 compatible db.r4.large DB instance with 15.25 GB of memory. No other activities are running on the Aurora cluster, and the cluster starts out empty.
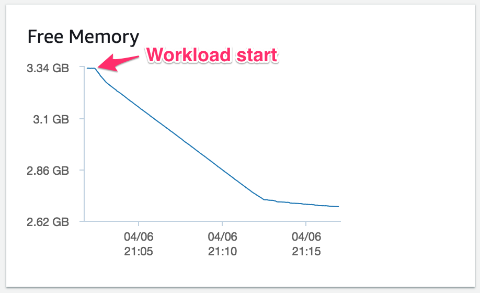
You can see how the free memory drops as the workload ramps up. Free memory stabilizes as the cache limit is reached, consuming an additional ~700 MB of memory overall, predominantly for the table definition cache.
The table_definition_cache parameter in the DB instance parameter group controls the size of the table definition cache. By default, this parameter is set using the formula following:
In conclusion, the number of tables you can consolidate in practice depends on several factors. These factors are how many of the tables are actively used, the amount of memory available, and the number of concurrent connections you need to support.
How to optimize for increased database resource utilization
Earlier in this post, I discuss some of the ways larger tables or larger numbers of tables impact utilization of server resources like CPU or memory. But workload consolidation itself causes increased utilization. If the number of database shards is reduced, more concurrent connections might be established for each remaining database shard. Each consolidated database does more work; the read and write query volume increases.
Amazon Aurora for MySQL comes with internal server connection pooling and thread multiplexing, which helps reduce contention and improve scalability when dealing with thousands of concurrent connections. You can configure each Aurora DB instance to allow up to 16,000 concurrent connections. But your workload and DB instance class selection might limit the practical maximum to a lower number than that.
Each connection, session. and thread consumes a variable amount of memory for various buffers, caches, and other memory structures based on the specific SQL statement currently running. This consumption is not deterministic, and competes for the same amount of available memory as the other structures discussed earlier in this blog post. To understand the best practices for effective connection management and scaling, the Amazon Aurora MySQL DBA Handbook for Connection Management whitepaper is a great resource. It contains useful advice to help you optimize connection utilization for larger, higher-throughput workloads.
Summary
A number of factors are involved when you consider Amazon Aurora with MySQL compatibility as a solution for consolidating multiple database workloads. Although not an exhaustive list, the topics preceding list a common set of considerations that we see when helping our customers implement such consolidations. Every workload is different, so the practical limits to consolidation are different in each case.
As a best practice, you should thoroughly test configuration changes from the defaults at production scale and implement them only if you see a quantifiable positive impact on performance and reliability. This best practice holds especially true when bringing configurations from MySQL community edition, because Aurora might not behave the same way. For more details on how to execute a workload consolidation project, see the post Reduce Resource Consumption by Consolidating Your Sharded System into Aurora on the AWS Database Blog.
About the Author
 Vlad Vlasceanu is a specialist solutions architect at Amazon Web Services. He works with our customers to provide guidance and technical assistance on database projects, helping them improving the value of their solutions when using AWS.