AWS for Industries
Building IoMT solutions to accelerate patient outcomes on the AWS Cloud
Many patients have only recently received their first remote clinical encounter, as remote patient monitoring and telehealth become more popular. However, the healthcare and life sciences industry has been in pursuit of this for many years. Today, the costs of care are still increasing, and with the recent hazards of in-person visits due to COVID-19, bringing technology solutions to market is more important than ever.
Today, clinicians often rely on the patient to receive, understand, and comply with orders and directives, then respond honestly during follow-up visits. Non-adherence can account for up to 50% of treatment failures (around 125,000 deaths) and up to 25% of hospitalizations each year in the United States—and this was pre-pandemic. As the number of managed chronic conditions continues to rise, increasing the data points used for clinical care while reducing the cost of collection for those data points will help the existing medical field with its objectives of balancing outcomes from care (efficacy) with the expense of delivering that care (value).
In this post, we share how to connect multiple IoMT (Internet of Medical Things) devices to the AWS Cloud and collect, analyze, and interpret patients’ vitals in remote locations using an architecture that delivers cost-effective IoMT infrastructure with the AWS Cloud and its analytics and visualization services.
Prerequisites
For this walkthrough, you should have the following:
- An AWS account
- Access to create AWS resources
- Raspberry Pi board with connected Health Sensors
- Familiarity with Raspberry Pi, its GPIOs, and Raspbian Linux
- Health Sensors (we used the MAX30102), OLED screen, DHT22 (or similar)
Overview of solution
For this solution we will use IoT Core, IoT Analytics, Amazon Kinesis, and Amazon QuickSight to ingest, process, enrich, and visualize our health sensor data. Then, we will use a custom web server for a remote reviewer to see the readings real time as they are processed by our system. This will take 90 minutes to complete and will cost ~$80/month depending on usage.
 Overview of solution showing IoMT device sending data to AWS Cloud to be processed
Walkthrough
Broadly, this solution consists of three phases:
- Ingestion of health data from our connected sensors
- Transforming the data for further use
- Consuming the data into our application and dashboard
Phase one: Ingest data
To use health data in the AWS Cloud, first register your sensor as a “Thing” according to the following steps. This lets you receive and process your data. For details on the Raspberry Pi deployment, cabling, or code, see this repo.
Register and configure IoT Thing
- Log into the AWS console and open the “IoT Core” service.
- In the menu on the left, choose Manage → Things → Create a Single thing.
- Give the Thing a name. We are using “rpi_healthstation1.” Press Next.
- Choose One-click certificate creation and press Create certificate.
- On the next screen, download the four files you are presented with (including the AWS IoT root CA if you do not already have this). If you do not do this step, you will have to recreate the certificate object and assign it to the thing. If you wish to recreate the certificate, see Create AWS IoT client certificates in the IoT Core Developer Guide.
- Once the files are downloaded, press the Activate button to make a certificate in the AWS IoT Gateway.
- Choose Attach a Policy. Since you have not created an IAM policy for your Thing yet, finish the wizard by choosing Register Thing.
- Before you can use your certificate and connect your device, you must create an IAM policy and attach it to the created certificate, which is active on the IoT Gateway. On the left side, go to Secure → Policies → Create.
- Give your policy a name. Then, click on Advanced mode and provide the following into the editor. This simple policy permits the certificate to connect, subscribe to the topic, and publish to the topic. The topic has been specified but has not been created yet, so remember the value below (e.g., “rpi-healthstation-topic”).
- Now you have your policy, but it is not attached to any certificate. Therefore, your Thing still does not have any applicable policies. To fix this, go to the left-hand side and navigate to Secure → Certificates. Choose your previously created certificate from the list and press the Action Menu and Attach policy. Choose your created policy and press Attach.
- Create your Topic so you can test by going back to the service catalog and Simple Notification Service (SNS). On the left, choose Topics and press the Create Topic For type, choose Standard. Again, for this example, we are publishing from our device, which does some error correction and provides a sequence. Because our data contains integrity elements, we do not need additional service from SNS.
- The name must match what we specified in the policy above, so we used “rpi-healthstation-topic”. Leave the rest of the options as default.
With your IoT endpoint value, your Thing’s certificates, and the name of your Topic, you can configure those variables in the code on the Raspberry Pi. Soon, you will see MQTT messages in the topic. For more information about MQTT and its implementation, see the AWS IoT Core Developer Guide.
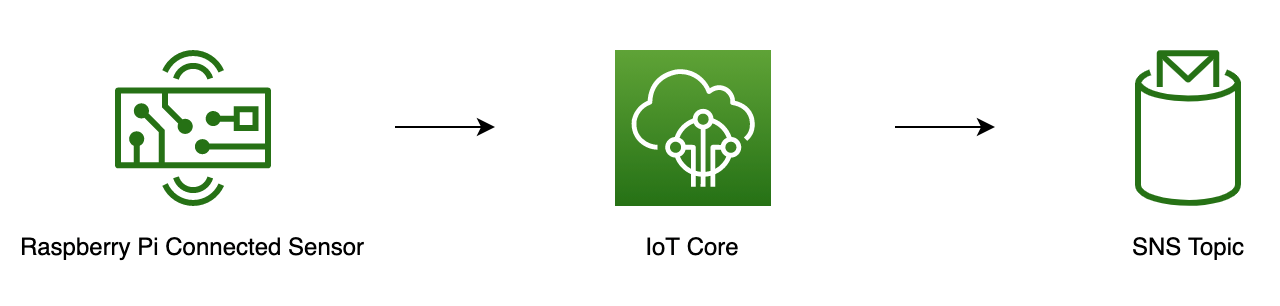 Raspberry Pi Connected Sensor sending messages to SNS Topic
Phase two: Act & transform data
Your IoT devices are now configured and sending data to your Topic in IoT Core. Now, create a forward Rule so you can use it in application.
Create IoT Act Rule to send data to IoT Analytics
- Go to the service catalog and choose IoT Core on the left panel. Go to Act → Rules → Create.
- Insert the name “rpi_healthstation_rule”.
- In “Rule query statement”, clear the contents and paste the following:
SELECT * FROM 'rpi-healthstation-topic'
- Under “Set one or more actions”, choose Add Action, Send a message to IoT Analytics, and Configure Action.
- Select Quick create IoT Analytics resources and enter a prefix for the created resources. Press Quick Create.
- This will proceed to create a channel, datastore, pipeline, dataset, and IAM IoT role. When it is finished, press Add Action and Create Rule.
We now have a simple rule that takes the data as it comes to the topic. It sends the data to the IoT Analytics channel, we which we have set up for further processing for our operational dashboard in Amazon QuickSight. As we would like to also gain real-time insights on our received data, we also need to create an additional forward Rule so that the data coming into IoT Core is also sent to Kinesis.
Create action to send data to Kinesis Data Stream
- Click on the Rule we just created, “rpi_healthstation_rule”, and choose Add action.
- Select “Send a message to an Amazon Kinesis Stream” and the Configure action
- Click on the Create a new resource A new browser tab will open to the Kinesis service page. From here, select Create a data stream.
- Make two streams: one for the raw IoT data when it comes in, and another for the formatted data. For this walkthrough, we are selecting the minimum number of shards (one). We are not experimenting with shards here, but we highly recommend that you experiment with this feature if performance is a concern. Name these streams accordingly.
- After creating the streams and seeing that they are both active, go back to the tab with the IoT Rule Action. Because this window was open before the data streams were created, you may need to press the refresh button next to the Stream Name pull down.
- Choose the raw IoT stream you just created. You will also see the formatted stream.
- For Partition key, use the default.
${newuuid()}
- Finally, press Create Role or choose an appropriate service role which will allow AWS IoT to take the action using the selected Kinesis Data Stream.
We now have a Kinesis Data Stream which will be receiving our IoT sensor data, this will function like a table from which we can query using SQL statements. In our application, we will have a source stream (SOURCE_SQL_STREAM_001) and our queries will insert data from this source stream to another in-application stream (DESTINATION_SQL_STREAM). This process will continuously occur, so our application will need to use time bounded windows in our requests. These windows are usually expressed in seconds or minutes. In our example, we are using sliding windows and partitioning by “deviceid” using a 2-second sliding time window. Windows can overlap in this type of processing method and a record can be part of multiple windows. For more information on windowed queries, see this Windowed Queries in the Amazon Kinesis Data Analytics for SQL Applications developer guide.
Create a Kinesis Data Analytics Application to process ingested data.
- Go to Kinesis service and choose Create Application.
- Provide a name and choose SQL as runtime. Press Create Application.
- In the next page, select the Source. Press Connect streaming data and select the raw Kinesis stream you created. Discover the schema and then press Save and continue.
- Now, deploy your Real Time analytics query by choosing Go to SQL results. In the SQL editor, use the following query:
- Once you are satisfied with the query, click Save and Run in the SQL editor.
- As long as data is being produced by the IoT devices, you should see formatted data according to the query you just created.
- Add a destination for our newly formatted data by selecting Connect new destination and the formatted Kinesis stream you created.
- Use “DESTINATION_SQL_STREAM” for the in-application stream name so you can select it as you have specified it in your SQL query.
We now have a data source which is being continuously processed in real-time with Kinesis for our application to use.
Phase three: Consume data
For our custom real-time “HealthStation” application, use the formatted Kinesis Data Stream that was previously set up as the destination for Kinesis Data Analytics.
To read data from the stream, we are using the low-level Kinesis Data Streams API provided by the python library (Boto3) and simply reading data records from a Kinesis Data Stream’s shard. This will act as the Kinesis Consumer server.
While we are using the Kinesis Data Streams API, you can also read data from data streams using the Kinesis Consumer Library (KCL), which helps you consume data from streams by taking care of many of the complex tasks associated with distributed computing. KCL does this by providing a layer of abstraction around all the complex subtasks of dealing with multiple streams per shard, so you can focus on your application logic.
Data is read as soon as it arrives in the stream in near real time using the get_records API call provided by Boto3’s Kinesis client. Once the data is read and buffered locally, it is then presented to clients for consumption. To do this, we are using WebSockets and have set up the server infrastructure around it to form a WebSocket server. This server will listen on a specific port and every time we get a record from Kinesis, it will be sent to clients that are connected to the WebSocket server. This permanently created pipe permits a fast and real time update for the application.
The client itself is a simple HTML page that has a WebSocket client written in JavaScript and displays the data as soon as it arrives. The web page is distributed via NGINX web server.
The Kinesis Consumer server, WebSocket server, and the HTML page can all be deployed in one Amazon EC2 instance.
 Web Application on Amazon EC2 serves clients from Amazon Kinesis based application
Create EC2 and deploy custom WebSocket web application for real time readings
- Go to the EC2 service catalog. Choose the orange Launch Instances in the upper right of the landing page.
- Choose Amazon Linux 2 64-bit (x86).
- For instance size, t2.micro is fine for this deployment. (Note: there are a number of considerations around deployment which we are not taking into account for this example. You may want to understand your specific resource and security needs for a production system.)
- For instance details, leave defaults in place, as we will need to ensure that this is accessible on the network.
- For storage, leave defaults, as these are sufficient for our example.
- For tags, apply any tags that you would like.
- For security groups, use a default group available to you. You will need TCP9001 for the WebSocket connection to the browser, SSH TCP22 for to login, and the site itself is served over HTTP TCP80. Press Review and Launch.
- Log into the system when it is available to access. This may take some time.
- Install Nginx by running the command “
sudo amazon-linux-extras install nginx1“. Confirm the install when asked. - Start Nginx by running “
sudo service nginx start“. If you browse to this site now, you will see a nginx test page. This tells you that the default location for content is “/usr/share/nginx/html” and is configured in the file “/etc/nginx/nginx.conf”. - Transfer the contents of the client folder included with the code to the directory, “/usr/share/nginx/html”. This will overwrite the default index.html document there, so you can save this first, if you would like to.
- Within this index.html file, there is a mapping to the user ID, which is the value configured on your Raspberry Pi device. Update this user ID and name it accordingly.
- Within the ts.js file, there is a mapping to the WebSocket server. Update this to be the IP of the EC2, using port 9001 for the traffic.
Now, you can visit the EC2’s IP in a web browser and see the dashboard waiting for readings.
- Transfer the contents of the websocketserver folder included with the code to the home directory on the EC2.
- Within the server.py file, there is a mapping which needs the name of our output Kinesis data stream. Modify this to “destination-sql-stream”, which we configured earlier.
- For the code to work, some packages need to be installed. Run the command “
sudo yum install python3“, followed by “sudo pip3 install boto3“. - Start the server by running “
nuhup python3 server.py &“. This command will return you to a prompt and run the server process in the background.
You are now able to see this real-time live view using WebSockets to read from our Kinesis Data stream all hosted on our EC2. For our IoT Operational Dashboard, we need to use our Dataset from the IoT Analytics Pipeline we built previously in Amazon QuickSight. Let’s create a QuickSight Dataset from the IoT Data that we are forwarding to that service.
Create QuickSight Dataset from IoT Analytics data
- Go to the QuickSight service and click on Datasets in the left menu.
- Click on New dataset.
- In the next screen, there are a number of different sources you can select from to visualize in QuickSight. For now, choose AWS IoT Analytics.
- You will be presented with a list of datasets configured in your account. Choose “iothealth_dataset”, which we configured earlier, and give it a name. This creates a data source object in QuickSight and initiates an import into QuickSight’s SPICE engine.
- When the import completes, you will be given the option to visualize or edit/preview the data. Click on Edit/Preview data to make sure your data types are set correctly.
The data prep area of QuickSight is now loaded up. Here, you can see all of your data correctly sorted into columns. QuickSight has already intelligently detected that your geospatial values (latitude and longitude) are present and has applied the correct field type to those values. However, the timestamp is still in epoch time format. While this is great for ensuring consistent and universal time in a distributed system, it can be unhelpful when needing to be read by an operator. Using QuickSight’s data prep function, create a calculated field that will apply the conversion formula for you and augment your data with this additional field.
- Click on Fields in the left panel and choose Add calculated field.
- Give your new field a name. We are using “Human Time”.
- Write the function for this field. QuickSight includes the one we need, “epochDate”.
epochDate({timestamp})
- Return to data prep mode for your QuickSight Data Source. As you can see, you now have a new field which looks much more readable. You can perform additional parsing steps (e.g., split the data out by years/quarters/months/weeks) by adding calculated fields. You can also create filters on the left side (below fields) if you have bad sensor data. Press Save at the top.
Build QuickSight Dashboard
- Go to the QuickSight service and choose Analyses on the left panel.
- Click on the teal New Analysis button in the upper right corner.
- Choose your previously-created Data Source from the list and press Create Analysis.
You are now in the QuickSight analysis editor. Here, there are many different ways in which you can use this data to provide a solution dashboard. First, find a simple count of your total messages received on a date.
- In the lower left, choose the KPI Visual Type.
- This visual takes in a value, target value, and trend group. Let’s provide message for value. As message is a text field without any particular sort of type applied, QuickSight can only “Count” or “CountDistinct” for this field’s value. In this case, we want to know the number of devices being monitored, so change the value section to message (CountDistinct).
This will show your lifetime value of messages sent by your sensor network in the message section of your MQTT packet. Since we may have operational responsibility of this fleet of sensors, we would like to be able to show the past day/month/quarter of data. Again, this is highly customizable to your exact needs.
- Select your Human Time value. By default, this will show us a day-on-day view. Change this by selecting the Trend Group, choosing Aggregate, and picking Month.
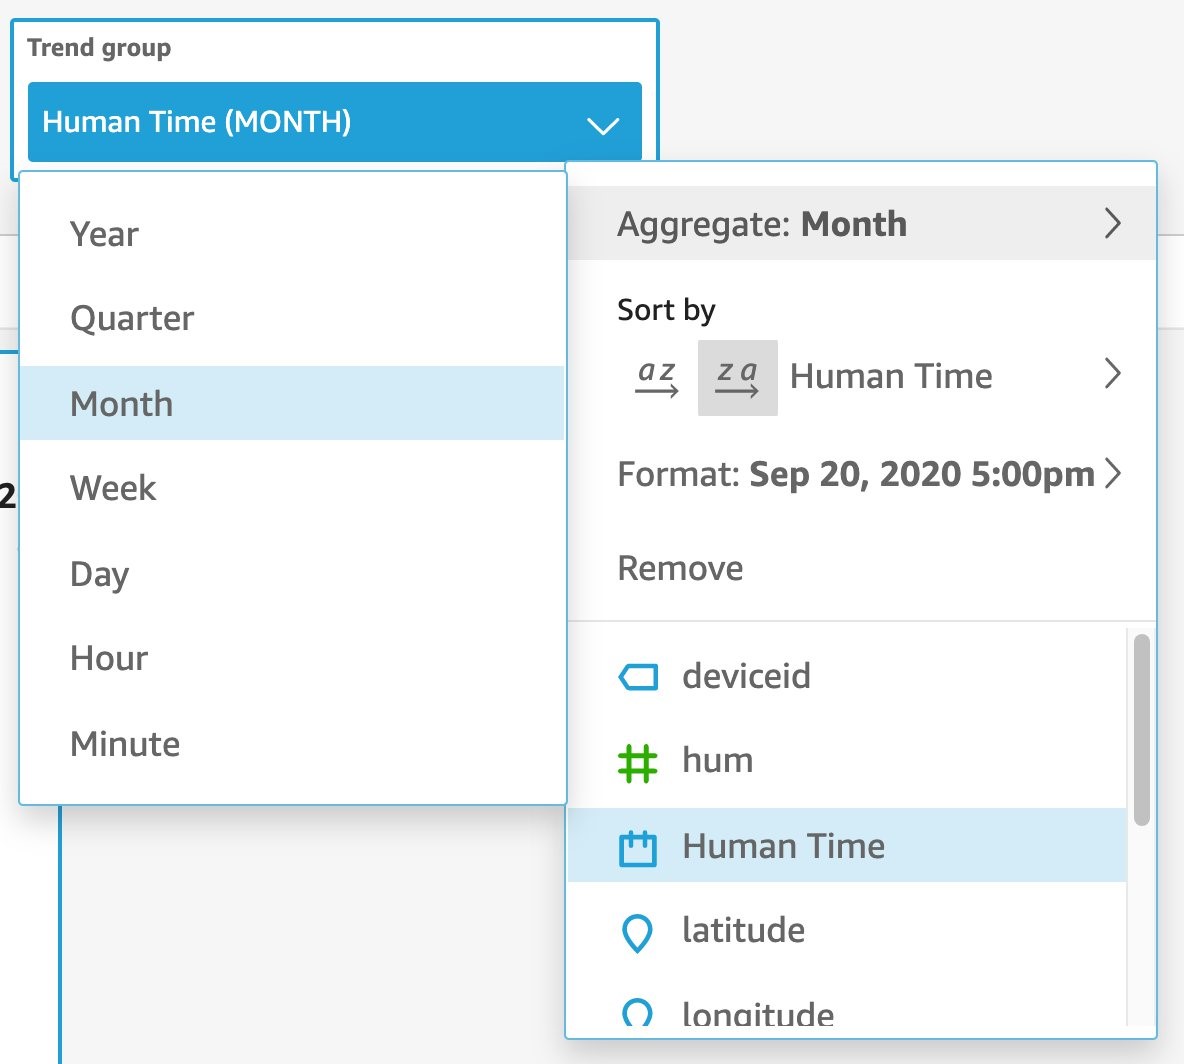
- Now, your KPI is showing the trend in unique messages received for this month compared to the previous month.
- To change the way this data is displayed so the data point you want is better featured in your visual, click on the visual. On the panel that appears on the right, choose the Gear icon.

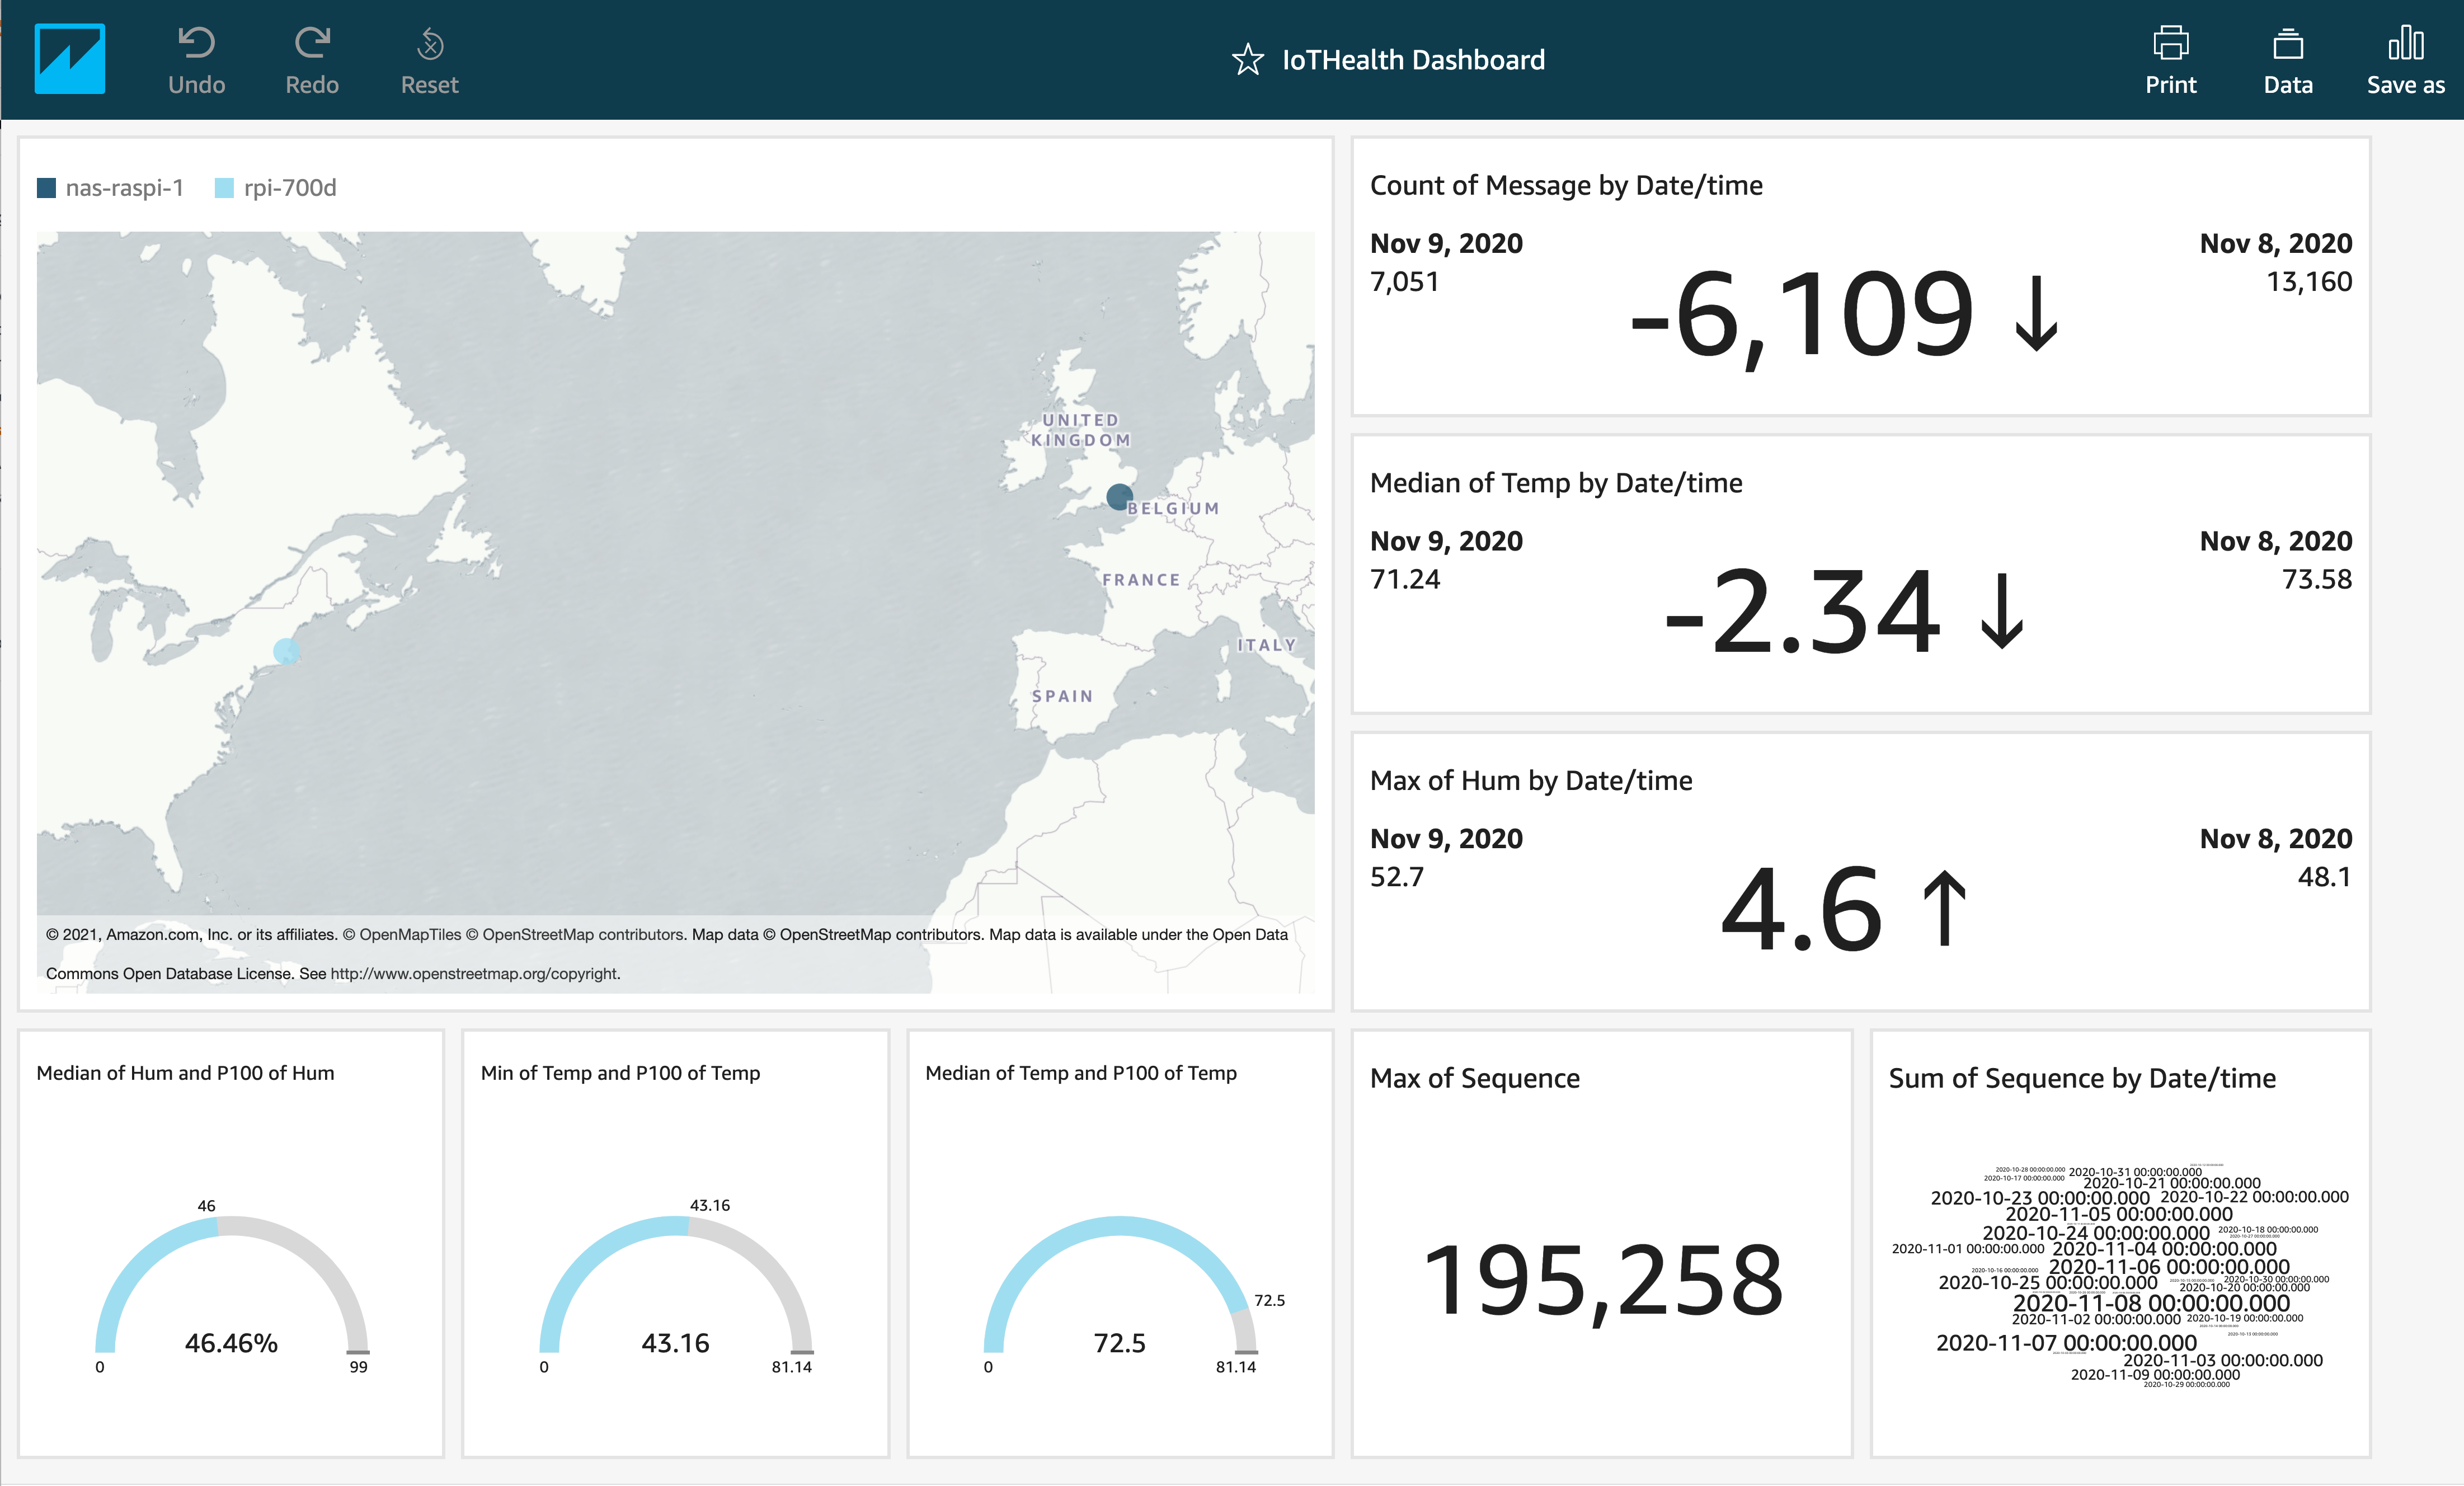
- In the “Format Visual” menu on the left, choose Actual from the “Primary value displayed” section. You can see now the primary value is the current metric, with the prior metric and the comparison value as secondary values.You can also change the format of the comparison value, add progress bar visual, modify formats, and adjust font sizes used. We are building a gauge cluster configuration, so we can achieve the desired look using multiple visuals together.The following image shows an example of how we could have effective coverage on a single data value.

- Repeat as many times as you would like to create the dashboard that best represents your operational data. When you are done, click Share and Publish Dashboard.
You are now able to see this dashboard in the Dashboards section when you first enter QuickSight. If you ever want to make a change, go into Analysis and click Publish a new Dashboard or Replace an existing dashboard.
Cleaning up
To avoid incurring future charges, delete the following resources that we created:
- Amazon Kinesis: We created two Data Streams and one Kinesis Data Analytics application. Delete these by going to the Amazon Kinesis service from the console, selecting both Data streams and Analytics applications from the sidebar, and deleting these items using the action menu with the resources selected. There is a confirmation prior to delete.
- AWS IoT Analytics: We created a Channel, a Pipeline, a Data Store, and a Data Set. Delete these by going to the AWS IoT Analytics service from the console and selecting these items in the left bar. Then, they can be deleted using the “three dots” menu on each line.
- AWS IoT: We created a Thing, an Act Rule for the data coming from that Thing, and a Certificate which we created for that Thing. Delete these by going to the AWS IoT service from the console and selecting these items in the left bar. Then, they can be deleted using the “three dots” menu on each line. Remember that when you delete the Thing, you may need to perform additional clean up on the device itself, as its connection will be severed once deleted.
- Amazon QuickSight: We created a Dataset, Analysis, and a Dashboard. These items only have a billing impact when there is interaction with the Dashboard, and is billed based on usage of the Dashboard. Delete this by going to Amazon QuickSight from the console. Select the items from the left and remove them using the “three dots” menu for each item. To avoid receiving an error about resource in use, remove the Dashboard first, then the Analysis, and finally the Dataset.
- Amazon EC2: We created an EC2 server to host our custom real-time application. Delete this server by going to EC2 from the console and selecting Instances from the left-hand menu. In the Instances panel, select the instance in the list and using the Instance State menu choose Terminate instance. Note that this will delete the instance and by default, the EBS attached to this instance. Make sure to back up any data you wish to retain prior to performing this step.
Conclusion
In this post, we showed you how to connect multiple sensors to create an IoMT (Internet of Medical Things) device that sends its data to the AWS Cloud. We also walked through how this data could be consumed in the Cloud to provide interpret vitals collected. This solution delivers a cost-effective way to preform remote monitoring and collection and is highly adaptable to many other sensors and packages, which are increasingly available to consumers.
To support a clinical workflow, a builder could connect these readings to an EMR using FHIR Works on AWS framework, which would provide a FHIR interface and workflow that permits this data to be written to a EMR system. To learn more about FHIR Works, see Building a Serverless FHIR Interface on AWS and Using open source FHIR APIs with FHIR Works on AWS.
Visit Healthcare & Life Sciences on AWS to learn more. Or, reach out to us directly.