AWS for M&E Blog
Automated way to create an AWS media services-centric CloudWatch Dashboard
An Amazon CloudWatch dashboard is a customizable home page in the CloudWatch console that monitors multiple resources in a single view. It can consist of a number of widgets, with each widget providing operational information about different resources monitored by the dashboard. For media workflows, CloudWatch dashboards can make it easy to view and monitor the status of workflow components in real time and can simplify troubleshooting when needed.
This blog post describes two methods for automating the creation of CloudWatch dashboards that present widgets in a consistent, user-friendly layout optimized for media workflows. One method uses a Python script and the other applies an AWS CloudFormation template that utilizes the Python script. If you already have a working environment for the AWS SDK for Python (Boto3), the Python script will be easiest to use. This is also true if you have a large number of dashboards to create. If you don’t use the AWS SDK for Python, then the CloudFormation template will be the easiest solution for you. Both approaches are designed for media workflows that incorporate the AWS Elemental MediaLive and AWS Elemental MediaPackage services and will generate a dashboard with widgets that present key metrics from those services during operation. Please note there are many different ways to achieve the same result programmatically.
Assumptions
For sake of simplicity, these examples make several assumptions. The assumptions for running the Python script directly are:
- The Python modules boto3 and awscli are installed, and “aws configure” was run to define the access key and secret access key to be used by boto3 to interact with the AWS services.
- The user that runs the script has an IAM policy that allows the user to run list/describe commands for MediaLive, MediaPackage, and CloudWatch, and has permission to create the dashboard instance in the user’s account.
Assumptions for both the Python script and the CloudFormation Template are:
- Even though dashboards are not regional, an instance of a given dashboard widget can only present data for a single region. Therefore, this script requires that the MediaLive channels used to create the dashboard all be in the same region.
- The MediaLive Channel was started at least once. This is required for the OutputVideoFrameRate CloudWatch Metric to be populated with the names of the outputs of the MediaLive channel.
- MediaPackage Channels receiving content from the MediaLive Channel are in the same region as the MediaLive channel.
- The CloudWatch Dashboard is created in the same region as the MediaLive Channel
Execution of the python script
The script has a comprehensive help function that can be accessed by the command line option “-h” or “–help”, e.g.
python create_CW_dashboard.py -h
The script takes as input either a single MediaLive Channel ARN, or a file consisting of a list of MediaLive Channel ARNs, as well as the name of the dashboard.
The MediaLive ARN list file <MediaLive_Ch_ARN_LIST_file> should be a text file that has a single MediaLive Channel ARN per line, e.g.
arn:aws:medialive:us-west-2:0123456789:channel:123456
arn:aws:medialive:us-west-2:0123456789:channel:234567
arn:aws:medialive:us-west-2:0123456789:channel:345678
The script ignores duplicate entries and empty lines in the list file.
An example:
Create a CloudWatch dashboard for the MediaLive channel with channel ARN arn:aws:medialive:us-west-2:0123456789:channel:123456 and call the dashboard “My First Dashboard”.
python create_CW_dashboard.py -a arn:aws:medialive:us-west-2:0123456789:channel:2782147 -n "My First Dashboard"

Retrieving information from MediaLive channel arn:aws:medialive:us-west-2: 0123456789:channel:2782147
MediaLive Channel Name:  My Channel
Retrieving information from the MediaPackage channels
Successfully created Dashboard 'My-First-Dashboard'
Note all spaces in the dashboard name have been replaced with “-“. The dashboard URL cannot have spaces in the name, and should be replaced with “-“ or “_”. For the script “-“ was therefore used. For this example, the dashboard URL for the dashboard created by the script would be https://us-west-2.console.aws.amazon.com/cloudwatch/home?region=us-west-2#dashboards:name=My-First-Dashboard
Execution of the CloudFormation Template
The CloudFormation template creates a Lambda function that will then, in turn, create the CloudWatch dashboard. The Lambda runs a version of the Python script mentioned above. First, log in to the CloudFormation console and access the template to create the CloudWatch dashboard. At the top left of the console, click the “Create Stack” button. In the new window, click “Upload a template to Amazon S3” and select the CloudFormation dashboard file “Dashboard.json.”
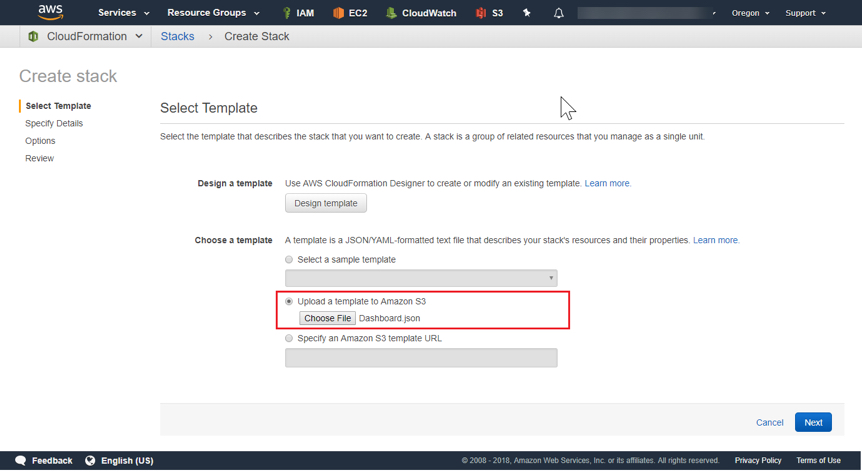
Figure 1. Set the template file to be used to create the CloudWatch dashboard
Click “Next,” and on the Specify Details page, enter the name you want for the CloudFormation stack, the name you want for the CloudWatch dashboard, and either the MediaLive Channel ARN or the semicolon-delimited list of MediaLive Channel ARNs.

Figure 2. Set the parameters of the CloudFormation Stack
Click “Next” to continue to the Options page. There are no changes required in this window, so click “Next” to continue to the Review page.
On the Review page, you need to acknowledge that CloudFormation may have to create IAM resources. Click the checkbox on the lower half of the page.
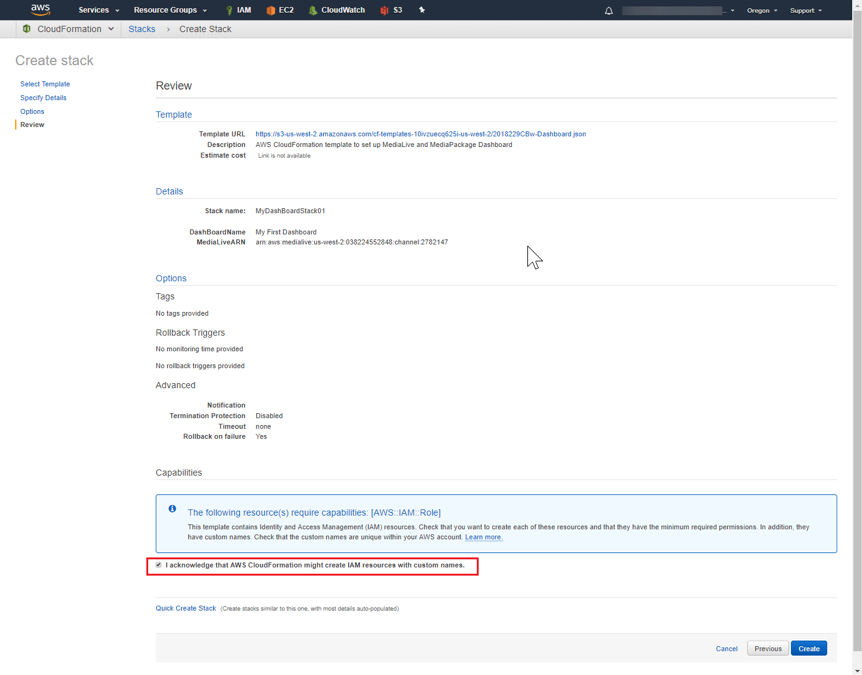
Figure 3. Allow CloudFormation to create IAM resources if needed
Click “Create” to request that CloudFormation create the stack, which in turn will create the CloudWatch dashboard.
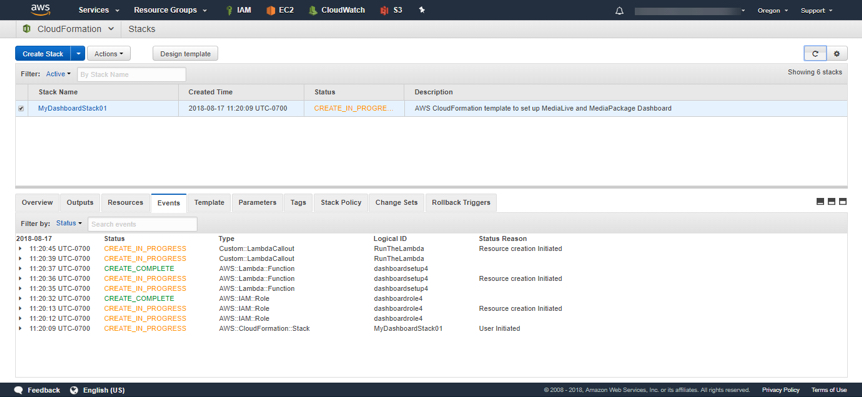
Figure 4. CloudFormation progress page
The CloudFormation console will show “CREATE_COMPLETE” when the stack is fully created.
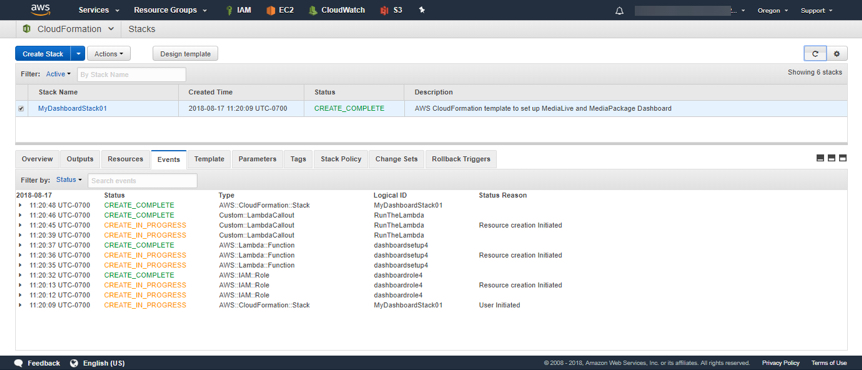
Figure 5. Completed CloudFormation stack
Go to the CloudWatch console to access the CloudWatch dashboard. After the dashboard is created, you may delete the CloudFormation stack. To create multiple dashboards, simply repeat the steps above, deleting the CloudFormation stack each time after the dashboard has been created.
Explanation of the Script
From the MediaLive Channel ARN, the script can obtain the Channel Name, Region and Channel ID of the MediaLive Channel, which it then uses to extract the destinations of all OutputGroups defined in the MediaLive Channel configuration. Using this destination information the script then determines the MediaPackage Channel ARNs, from which it then obtains the MediaPackage Channel Name, and all MediaPackage Endpoints of each MediaPackage Channel. Lastly, the script obtains the MediaLive OutputNames from the OutputVideoFrameRate CloudWatch Metric.
The script contains a dashboard template that defines the different widgets in use by the dashboard, as well as the location and size of each widget. It populates the template with the information retrieved from the three services, and finally creates the dashboard in the user’s account. It provides feedback during its execution and will state if it was successful in creating the dashboard.
Structure of the Dashboard
The dashboard is broken up into two sections, namely the Packaging & Origin section (i.e. MediaPackage related) and the Encoding section (MediaLive related).
Packaging & Origin Section
This section consists of six metrics related to the MediaPackage service:
- Ingress Bytes: Number of bytes that the MediaPackage Channel ingests.
- Egress Request Bytes: Number of bytes that MediaPackage successfully outputs for each request.
- Ingress Response Time: The time that it takes the MediaPackage to process each ingest request.
- Egress Request Count: Number of content requests that MediaPackage receives.
- Status Codes for 2xx and 4xx: For each MediaPackage Endpoint graphs the sum of all 2xx Status Codes and 4xx Status Codes.
- Status Codes for 3xx and 5xx: For each MediaPackage Endpoint graphs the sum of all 3xx Status Codes and 5xx Status Codes.
Encoding Section
The Encoding section of the dashboard is relate to the metrics of the MediaLive channel:
- Input Video Frame Rate: The input video frame rate averaged over the last ten seconds.
- Output Video Frame Rate: This metric graphs the output video frame rate of each output in the MediaLive channel, averaged over the last ten seconds.
- Network In: A graph of the sum of the input bit rate
- Network Out: A graph of the sum of all the outputs of the MediaLive channel
- Active Output Renditions: Sum of the number of active outputs of the MediaLive channel
- Dropped Frames: The Dropped Frame metric indicates the cumulative number of dropped input frames since the start of the channel. A frame drop indicates that the system is unable to keep up in real time.
- Fill Milliseconds: This metric is the number of consecutive milliseconds of “fill” frames (e.g. repeated frames, black frames and/or slate) inserted by the MediaLive due to the input not being present. Once the input returns it will go back to zero.
- SVQ Time: This metric defines the percentage of time, averaged over the last 10 seconds, the encoder has had to reduce quality optimizations to speed up the encode process, in order to keep the MediaLive running in real time.
Dashboard Layout
The different Packaging & Origin and Encoding widgets are laid out is shown in Figure 1 below.
| Packaging and Orientation | |
| Ingress Bytes | Egress Bytes |
| Ingress Response Types (avg) | Egress Request Count (sum) |
| Status Code Range (sum) 2xx,4xx | Status Code Range (sum) 3xx,5xx |
| Encoding | |
| Input Video Frame Rate (avg) | Output Video Frame Rate (avg) |
| Network In (sum) | Network Out (sum) |
| Dropped Frames (sum) | Active Output Renditions (avg) |
| Fill Milliseconds | |
| SVQ Time (%) | Console Links |
Figure 6. Block diagram showing the layout of the CloudWatch Dashboard
The Console Links widget at the bottom-fight of the dashboard is a text widget which lists the URL links to the console of each MediaLive and MediaPackage channel covered by the dashboard. Click on the link to open the console of that service, or use Ctrl-Left-click to open the console in a new tab in the browser, leaving the dashboard open in the current tab.
Here are a few screenshots for the example dashboard “My First Dashboard” created above. The workflow consists of the following:
AWS Elemental MediaLive channel with Channel ID 2782147
MediaPackage Channel My_Channel_A, with endpoints A_ep_HLS & A_ep_MSS
MediaPackage Channel My_Channel_B, with endpoints B_ep_HLS & B_ep_MSS
Note that the name of the dashboard was modified to “My-First-Dashboard”, since CloudWatch dashboard names can’t contain any space characters.
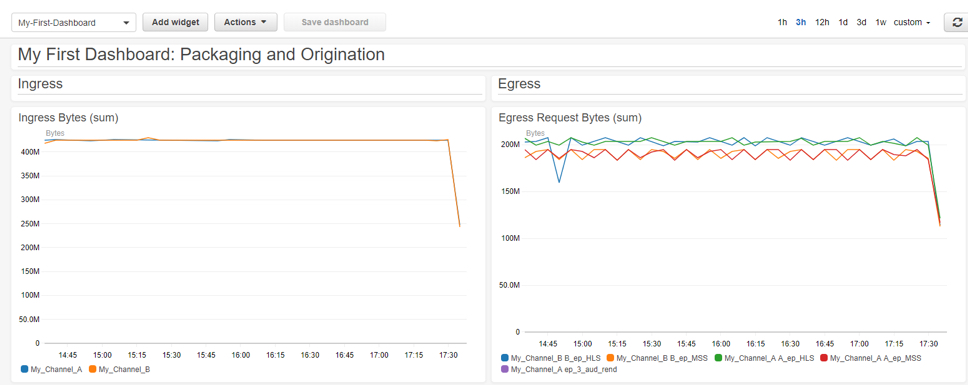
Figure 7. The first two widgets of the Packaging and Origination section of the dashboard
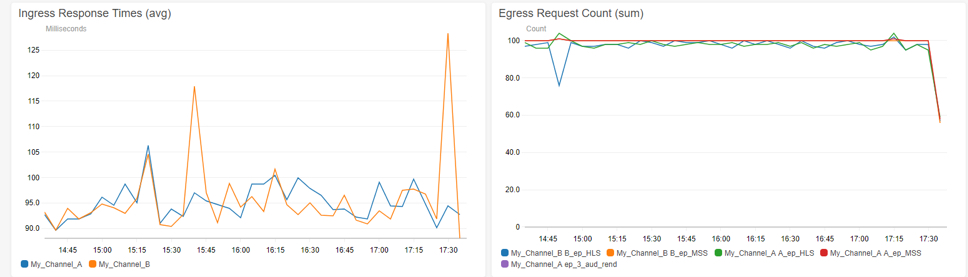
Figure 8.
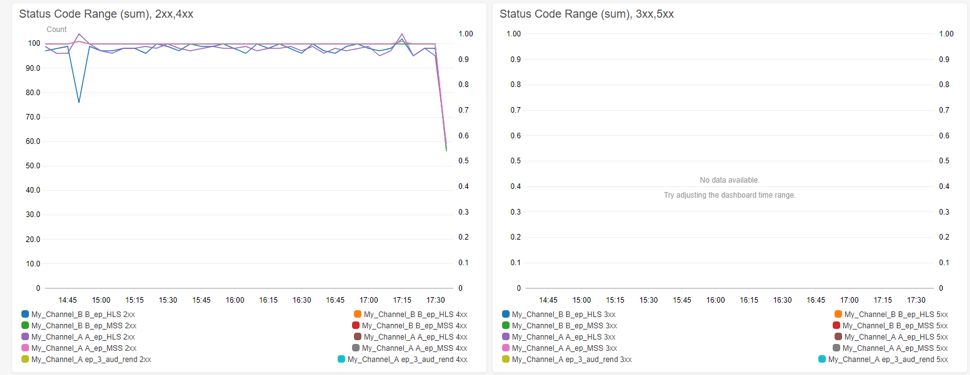
Figure 9. Status codes widgets of the MediaPackage channels
Note that in Figure 9 the graph for the 3xx & 5xx Status Codes is not showing any data, since for the time slot showing there were no Redirection or Server errors reported.
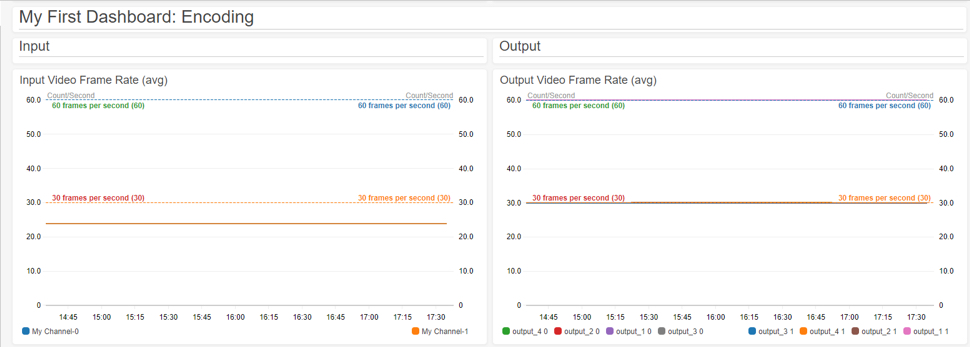
Figure 10. Start of the Encoding section of the dashboard, showing the Input/Output Video Frame Rate
Note that in the Encoding graphs the two different pipelines of each MediaLive channel is referenced separately. The naming convention used is “MediaLive Channel Name”-0 for pipeline 0 and “MediaLive Channel Name”-1 for pipeline 1.
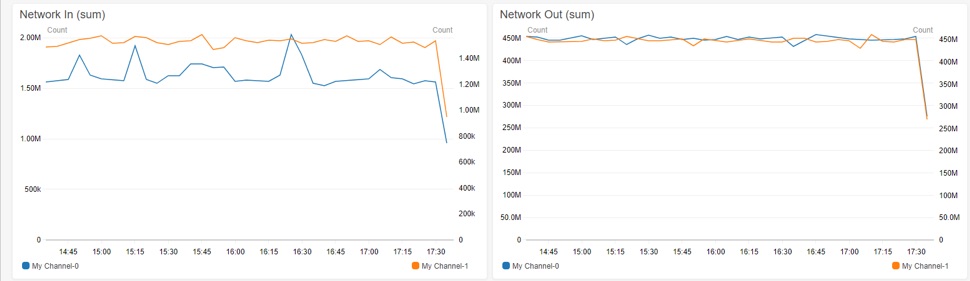
Figure 11. Network In and Network Out graphs
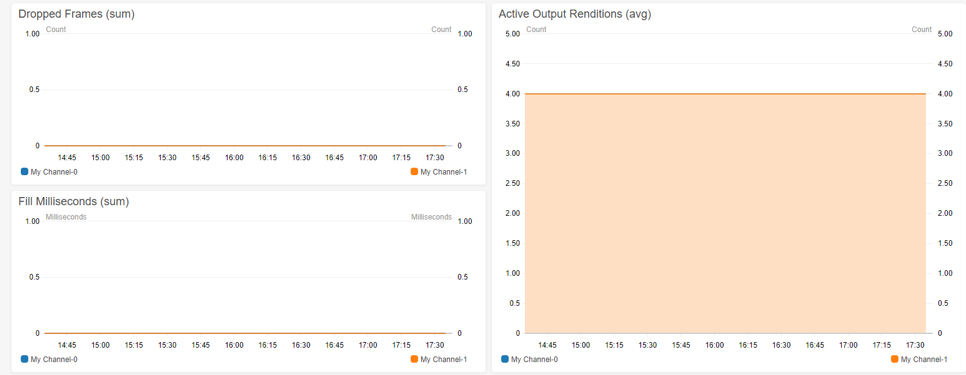
Figure 12. Dropped Frames, Fill Milliseconds and Active Output Renditions
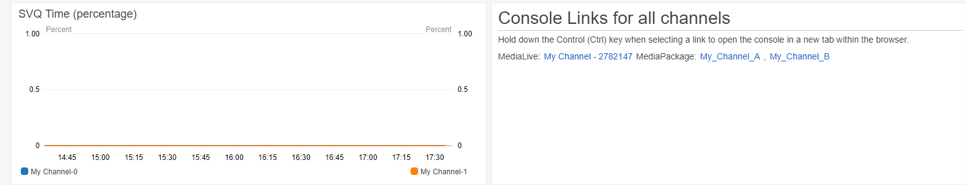
Figure 13. SVQ Time and the Console Links widget
Note that additional information is available in the various graphs of the dashboard, by hovering the mouse over the area you want to see more information displayed. See Figure 14 for an example of this.
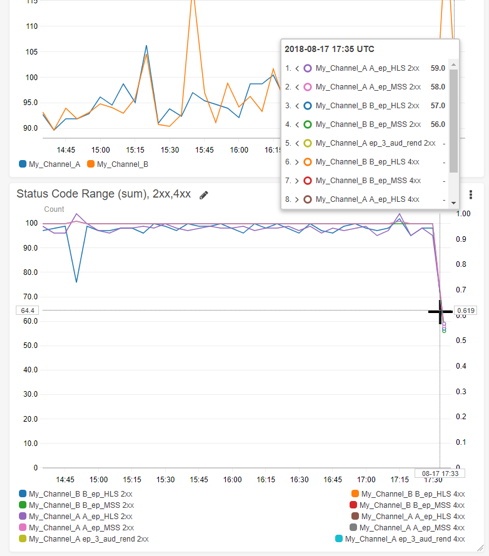
Figure 14. Mouse over regions in the graphs will show more information
Resources
The Python script and CloudFormation template are obtainable from the GitHub repository: https://github.com/aws-samples/aws-medialive-mediapackage-cloudwatch-dashboard
The Lamba that is used by the CloudFormation template has been uploaded to S3 buckets in each region that MediaLive is available. The CloudFormation template references the Lambda instance in the same region as the template is being deployed in.
A special thanks to Dirk-jan Boekee, Sr. Technical Specialist at AWS Elemental who created the CloudFormation template used in this post.