AWS for M&E Blog
Using analytics to improve video playback quality with Amazon IVS
This blog is co-authored by Igor Oreper and James Varndell, Bitmovin, and Anthony Vu and Kayla Jing, AWS.
Overview
Capturing and retaining the attention of viewers is a growing challenge for content distributors. Investing in interactive content can keep more viewers engaged for longer; however, this additional investment may not pay off if viewers experience video streaming issues or if content isn’t tailored to their interests. It’s therefore important for content distributors to monitor the quality of experience they’re providing and understand their audience engagement and demographics.
Monitoring quality of experience (QoE) comes from observing the health of a video stream, from stream broadcast and ingest to playback of the stream by a viewer. Amazon Interactive Video Service (Amazon IVS), a managed live streaming solution from Amazon Web Services (AWS) that lets you build interactive video experiences, provides detailed insights into ingestion health. But that’s only part of the picture. To understand the experience holistically, video playback health should also be considered.
In this post, we’ll describe how Amazon IVS Live Stream Health can extend to include playback insights based on data collected from video players. To do that, we’ll describe how to use a solution from Bitmovin, an AWS Partner, to monitor playback health in real time, optimize playback quality while managing costs, and harness viewer-engagement data to improve content and business decision-making.
Video playback health observation
Delivering a great viewer experience is important for content creators, and technical issues can affect user reviews, monetization, and viewer churn if they aren’t resolved quickly. Bitmovin’s Analytics works with Amazon IVS to provide holistic monitoring of video streams to proactively identify playback issues before they’re reported by viewers. Importantly, this includes near-real-time insights into stream QoE. Once a stream issue is identified, Analytics provides deeper information to help with issue resolution—including detailed information about error sessions. For example, support teams can look at a ranked list of top errors and review individual sessions where viewers experienced each error. From the Analytics dashboard, each player event in the session is visualized, and the player stack trace is captured to aid debugging.
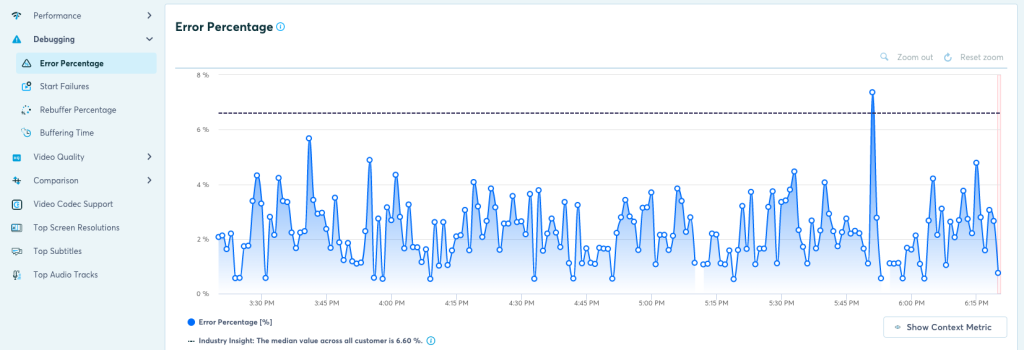
The error percentage shows the number of errors in relation to the number of play attempts on a video platform. The error percentage includes errors that disrupted a user’s playback as well as errors from which the player was able to recover. The error percentage gives a high-level overview and the top errors view allows you to dig into specific errors in individual sessions. The report can be filtered and broken down by other available data elements.
Playback health analytics
In addition to near-real-time monitoring-and-issue resolution, more fundamental improvements can be identified using additional analytics insights. This centers around stream quality and its impact on viewer engagement. It’s typical for many viewers to expect at least HD (1920 x 1080) stream resolutions, for example. However, there are many more factors influencing perceived stream quality, including video bitrate, player startup and seek times, buffering, and others. These can be optimized to balance the cost-versus-quality ratio. Bitmovin’s Analytics complements Amazon IVS to provide these insights, with tools that facilitate further refinement of the video supply chain—for example, bitrate heat-map analysis and supported codecs—or performance tuning using insights about video versus player versus digital rights management (DRM) start and seek times.

Total hours watched is the summed playtime of all impressions. The report can be filtered and broken down by other available data elements.
Business analytics
Apart from solving streaming issues, business opportunities and targeting optimizations can be identified by gaining a fuller understanding of how viewers engage with content and the demographics of stream viewership. By understanding which content is most popular, how viewers engage with that content, and from which locations and device types, content can be optimized to appeal to the audience. Metrics such as concurrent viewers, total hours watched, country, and device type all shed light on audiences and allow content to be tailored. Additionally, filtering those metrics by title informs investment decisions in new content and the prioritization of content that is popular with the audience. Demographic information can also be helpful in identifying whether a specific user or small cohort on a given device or ISP is having issues versus a larger cohort. Important to note is that Bitmovin Analytics does not inherently process or store any personally identifiable information (PII) and is compliant with General Data Protection Regulation (GDPR).
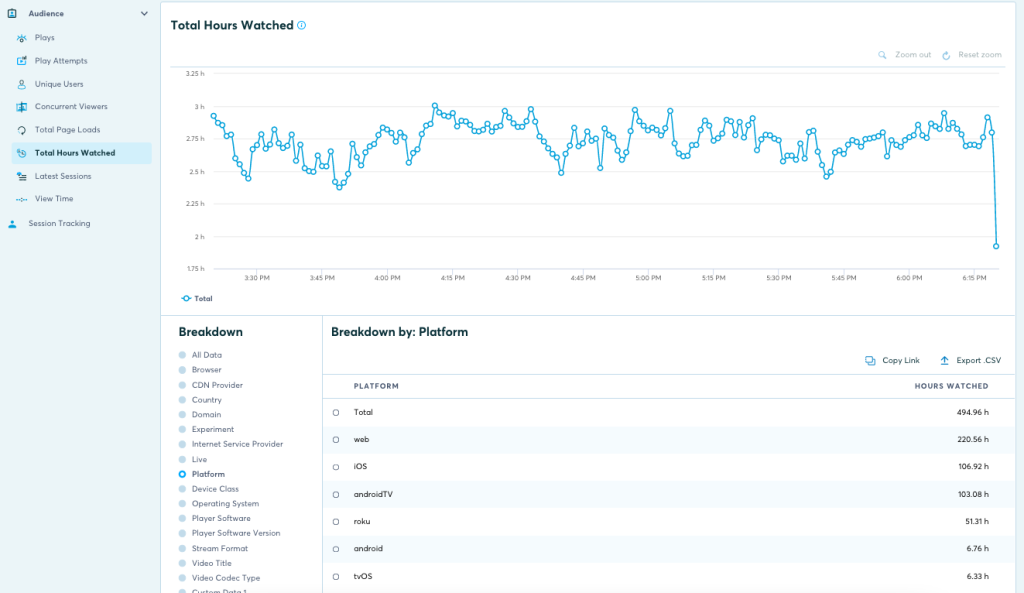
Total hours watched is the summed playtime of all impressions. The report can be filtered and broken down by other available data elements.
High-level integration architecture
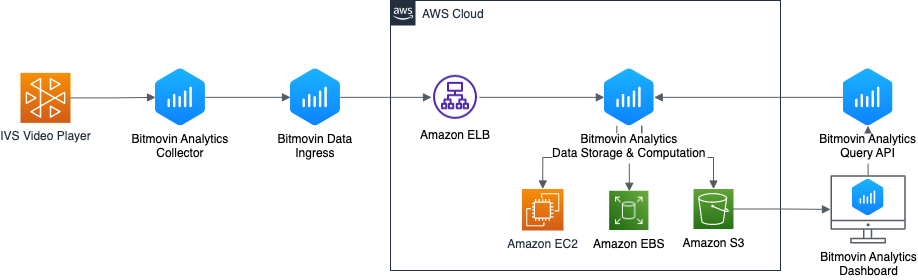
This diagram depicts how Amazon IVS and Bitmovin components interact to deliver the IVS Analytics service. IVS Video Player feeds playback events to the Bitmovin Analytics Connector, which sends those events to the Bitmovin Data Ingress service running on AWS. The Amazon Elastic Load Balancer (ELB) distributes data ingress across Bitmovin Data Storage and Compute nodes, which run on Amazon EC2, EBS, and Amazon S3 services. Users explore reports in the Bitmovin Analytics Dashboard User Interface (UI) , which relies on the Bitmovin Analytics Query API, to get the available data and render in the UI.
Dependencies and prerequisites
- An Amazon IVS channel with streaming software setup. Refer to the Getting Started with Amazon IVS guide to learn how to set up a channel and streaming software.
- Amazon IVS Android Player SDK
- Android data collector (and BM account—AWS Marketplace)
How-to
Step 1: Set up playback health observation
These instructions describe how to set up playback analytics for Android devices by using Bitmovin’s Analytics collectors. Getting-started guides are also available for iOS and web platforms.
Step 1: Configure your Analytics account
In this step, we’ll make sure you have a Bitmovin Analytics account with a license key, and we’ll configure the license for your Android application package.
a. Open the Bitmovin dashboard and log on to your account (if you don’t have an account, you can sign up for a trial account).
b. Open the Analytics licenses
c. Click on the license you’d like to use and copy the license key.

The Licenses view page in the Bitmovin Dashboard lets a user review, edit and change the order of licenses in their organization.
d. Copy the Analytics key.
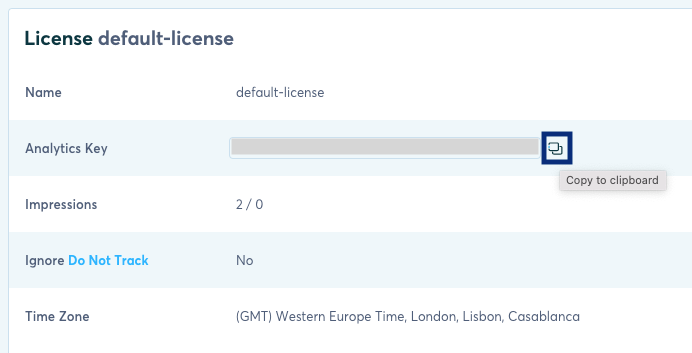
When a user selects a specific license in the Analytics Licenses View, they may copy the license key in order to use it for their integration project when configuring the Bitmovin Analytics Data Collector
e. Add the package names of the applications where you plan to use Analytics. This is a security measure and prevents your license from being used in other applications.
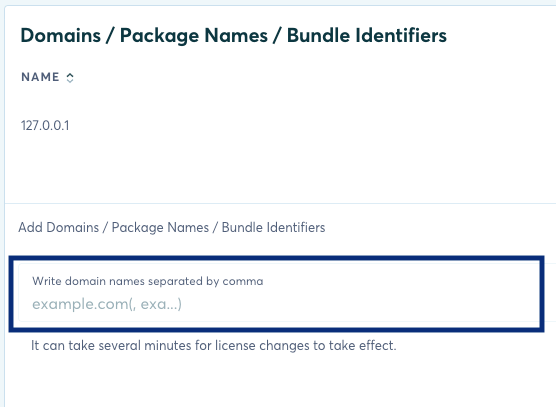
A user may add specific domains, package names, or bundle identifiers to specify which applications may use the authorized Bitmovin Analytics license key so that malicious users do not take the license key and deploy it in their own unauthorized applications
Step 2: Add Bitmovin Analytics to your project
In this step, we work on the project for your Android application, and add the Bitmovin Analytics collector as a dependency.
a. In the build.gradle file for your Android project, add a link to the release repository for Bitmovin Analytics.
b. Add the Bitmovin Analytics collector as a dependency.
Step 3: Connect Bitmovin Analytics to your video player
In this step we’re going to set up Bitmovin Analytics with your Amazon IVS Player. If you’re already using the Amazon IVS Player in your application, you can add the Analytics code that follows around your existing player code.
a. Create your player instance.
b. Create a configuration for Bitmovin Analytics. You’ll need to paste the license key that you copied in step 1c.
c. Optionally, you can add additional configuration values, such as video title, user ID, and custom data fields. For monitoring metrics based on an Amazon IVS channel, you can parse the suffix of the channel ARN from the playback URL and assign it a custom data field. This is especially useful when using the API explorer to query for the number of channels a viewer is watching at the same time or which channel a viewer is watching. You can then export the query to a REST API call.
d. config.title = “Android Amazon IVS player video”
e. Create an Analytics collector for the Amazon IVS Player.
f. Attach the player to the collector.
g. Load and play the source video.
h. Ensure you detach the player before playing a new source.
Step 2: Correlate playback health with Amazon IVS Live Stream Health
To get the complete picture on quality of experience, Amazon IVS Live Stream Health data should be used alongside playback health data. Stream Health data can be correlated back to playback data by looking at the time frame when a stream session occurred and finding the associated playback sessions with the same time frame and channel ARN.
As an example, you will want to proactively monitor for any unhealthy streams, using Stream Health data, and see how it affects a viewer’s quality of experience by putting it alongside playback health data. To monitor for unhealthy streams, let’s use the listStreams endpoint with the filterBy attribute and set the StreamFilters object to a value of “STARVING.” Stream starvation occurs when Amazon IVS is not receiving the expected amount of bits from the encoding device within a certain time frame.
An example request looks as follows using the AWS SDK for JavaScript.
This returns a JSON response with a format that looks as follows.
Using the stream IDs from the response, you can then retrieve detailed data for an individual stream session by using the getStreamSession endpoint. This endpoint returns a specific stream’s start and end times, as well as channel, recording, and ingest configuration information. Additionally, the endpoint’s JSON response includes a truncatedEvents key containing StreamEvent objects. Each object corresponds to various status events that occurred during the stream session.
An example request looks as follows using the AWS SDK for JavaScript.
This endpoint will return a JSON response with a format that looks as follows.
The array of StreamEvent objects within the JSON response contains a stream starvation start and end event for each time this particular stream session encounters starvation. Each stream starvation event has an associated time stamp when the event occurred.
Using the time stamps, you can use the Bitmovin API to retrieve the list of playback sessions that occurred during the same time. For example, if you find the time stamps are all within the last 7 days, you might be interested in seeing how average view time was affected. You can use the following query in Bitmovin’s API explorer to get this metric.
As another example, you might also be interested in learning if there were any reductions in concurrent viewership at the time that you encountered stream-health errors within the last 7 days.
You can then convert either of these queries to a REST API call and pull the data into a database or another platform of your choice. This is useful in building a dashboard.
In addition to the REST API, you can also use Bitmovin’s Analytics dashboard to see playback health data. You’ll need a Bitmovin account to access the dashboard. You can sign up for an account here.
Within the dashboard, you might be interested to see quality-of-experience metrics, such as the rebuffer percentage for your viewership. To view this metric, choose Quality of Experience -> Debugging -> Rebuffer Percentage
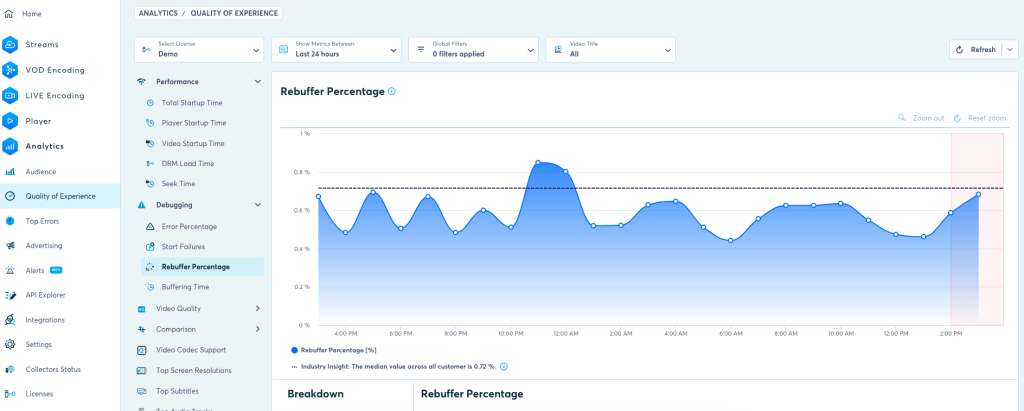
Rebuffering occurs when the player buffer runs out of video data to display to the user. The player pauses and waits for ongoing video segment downloads to finish before it can resume playback. Rebuffer Percentage is the average time a user waits for video segment downloads in relation to the total time a user spent watching a video. For example, if a user watches a video with a length of 9 seconds and has to wait 1 second for video segment downloads, it would take them 10 seconds in total to watch the video, which would result in a 10% rebuffer percentage.
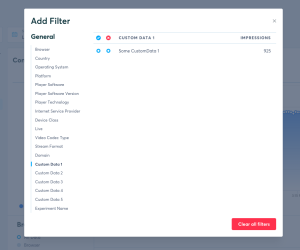
You can also filter the data to include sessions from certain channels only. To do this, choose the Global Filters option and then select the channel ARN for the channel you wish to see data for, from the Custom Data section.
Audience metrics are also visible through the dashboard, including Concurrent Viewers, for example.
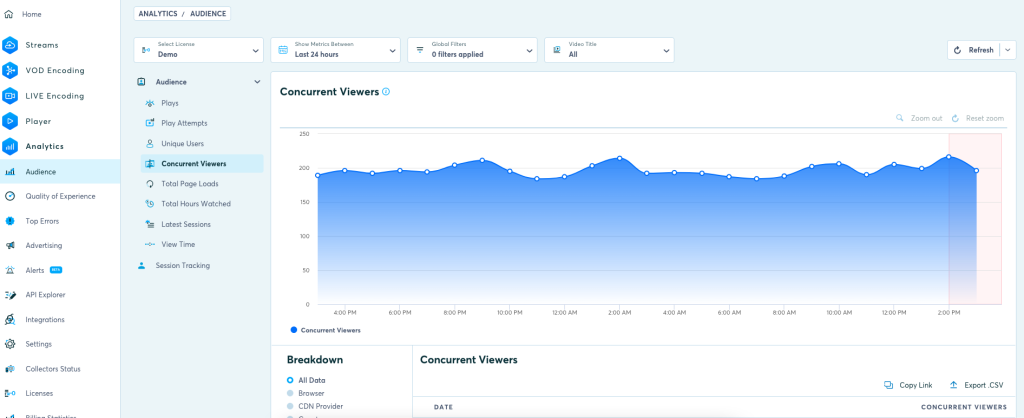
Similar to impressions, concurrent viewers are a measure of how many streams are actively being watched. The main difference to impressions is that impressions are the total number of started streams during a specified time period, while concurrent viewers are the maximum number of people watching at the same time. This means that if you have 10 people joining a stream per minute and 10 people leaving you’d end up with 600 impressions during one hour but only 10 concurrent viewers. Concurrent viewers are not unique users. If a user watches multiple videos they will be counted as multiple viewers. Concurrent viewers have a minute resolution so two users are considered concurrent if they are viewing the stream within the same minute.
Should you wish to take a more granular look at the latest user sessions, you can see those listed in the Latest Sessions view.
Unlocking additional telemetry
Bitmovin Analytics can also be used to provide near-real-time audience insights for a live streaming service that helps broadcasters to make informed decisions about their content-delivery and audience-engagement strategies. The same is possible for video-on-demand (VOD) streaming use cases.
Gain a deeper understanding of your viewers’ behavior, including which content they prefer, where they are located, what devices they use, and how they interact with your service. This data can then be used to optimize content delivery and improve the overall user experience, resulting in increased viewer engagement and higher revenue generation.
Bitmovin Analytics offers customizable dashboards, automated reports, and near-real-time alerts, making it a valuable tool for both your technical and business teams.
About Bitmovin
Bitmovin is a leading provider of video infrastructure for global digital-media companies and service providers. The company has been at the forefront of industry innovation and all major developments in the digital-video-streaming industry. For more information, visit www.bitmovin.com.