AWS Cloud Operations Blog
Securely connect Amazon Managed Grafana to data sources using AWS Transit Gateway and AWS PrivateLink
Introduction
Modern businesses rely on data from diverse sources across multiple AWS accounts and regions to gain insights and make critical business decisions. By establishing secure private connections to these data sources metrics, logs, and traces can be visualized from a single pane of glass to enable an end-to-end observability solution. Some customers may have strict requirements to not send data over the public internet. This is to reduce security risks of exposing sensitive information, lower data transfer costs, or decrease latencies.
In this post, we will demonstrate how to securely connect inter-region data sources like Amazon Managed Service for Prometheus with Amazon Managed Grafana without traversing the public internet. Using this solution, you can achieve seamless and secure access to operational data sources across regions to gain visibility into your global operations and workloads from a central Amazon Managed Grafana instance by leveraging the following AWS services:
- AWS PrivateLink – Enables private connectivity between VPCs, AWS services, and on-premises networks. This allows Amazon Managed Grafana to connect to the Amazon Managed Service for Prometheus endpoints using private IP addresses.
- AWS Transit Gateway – Simplifies networking by acting as a hub that interconnects VPCs and on-premises networks. This enables connectivity between Amazon Managed Grafana and the Amazon Managed Service for Prometheus (AMP) across regions.
- Amazon Route 53 – Provides domain name system (DNS) service which will be used to resolve the private IP addresses of the Amazon Managed Service for Prometheus endpoints from different AWS Regions.
Solution
The diagram shows using AWS Transit Gateways to connect VPCs in two regions – US-East-1 and EU-Central-1. Amazon Managed Grafana is deployed in US-East-1 and Amazon Managed Service for Prometheus in EU-Central-1. Peering the Transit Gateways enables connectivity between the VPCs to route traffic. Inter-Region VPC peering uses the same infrastructure as Intra-region VPC peering, allowing consistent performance when connecting VPCs globally. This setup enables Amazon Managed Grafana workspace to securely visualize metrics, traces, and logs from an inter-region data source like Amazon Managed Service for Prometheus.
For this setup, the Transit Gateway inter-region peering will have the attachment fees as regular attachments. The owner of the Transit Gateway will be charged hourly for the attachments.

Figure 1: Architecture diagram depicting inter region connectivity between Amazon Managed Grafana and Amazon Managed Prometheus data source.
Prerequisites
To follow along with this walkthrough, ensure you have the following prerequisites in place:
- An AWS account.
- Relevant IAM roles and permissions for be creating and managing AWS resources like your VPC, Transit Gateway, Amazon Route 53, Amazon Managed Grafana and Amazon Managed Service for Prometheus.
Walkthrough
Here are the quick steps to get started on how to securely connect inter-region data sources with AWS Managed Grafana:
- Step 1: Set up Amazon Managed Grafana workspace
- Step 1.1 Setup AWS Transit gateway in us-east-1
- Step 2: Set up the Amazon Managed Service for Prometheus data source
- Step 2.1 VPC private link for Amazon Managed Service for Prometheus
- Step 2.2 Setup Transit gateway in eu-central-1
- Step 2.3 Initiate transit gateway peering attachment request
- Step 3: Setup Route 53 private hosted zone
- Associate the private hosted zone with Amazon Managed Grafana’s outbound VPC
- Step 4: Test Amazon Managed Service for Prometheus data source connectivity from Amazon Managed Grafana
- Query the Amazon Managed Service for Prometheus data source and visualize the metrics securely via Amazon Managed Grafana
Step 1: Setup Amazon Managed Grafana workspace
Please refer to Getting Started with Amazon Managed Grafana for creating your Amazon Managed Grafana workspace in us-east-1 region.
For this post, as we will be focusing on securely connecting your Amazon Grafana workspace with an Amazon Managed Service for Prometheus data source in a different AWS region, you need to associate your Amazon Grafana Workspace to a VPC. To do that, under Outbound VPC connection section, select the VPC, a private subnet of your private data source and select the required security groups.
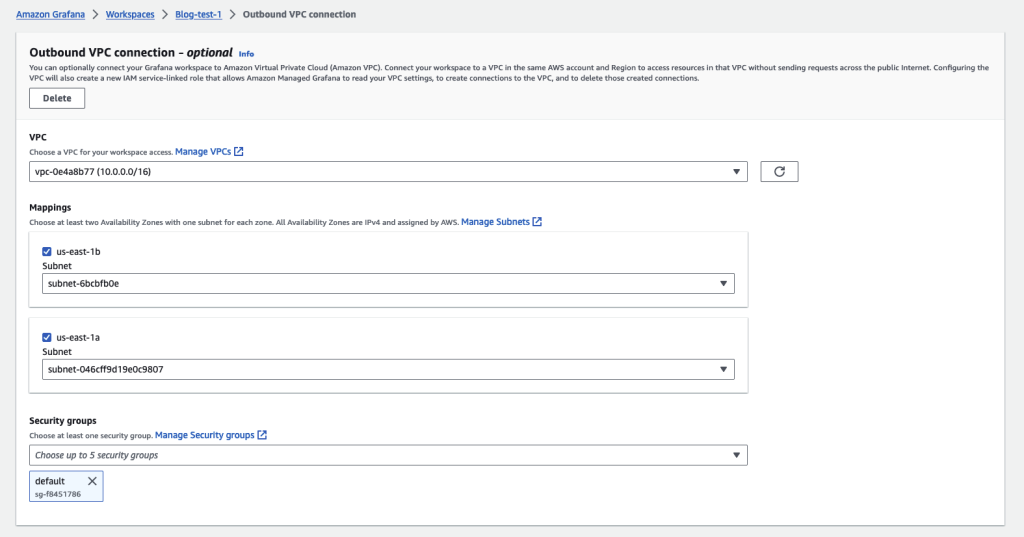
Figure 1.1: Amazon Managed Grafana with outbound VPC connection
Step 1.1: Setup Transit Gateway in AWS Region us-east-1
- Please refer to Getting started with transit gateways for information on how to create a Transit gateway and create a VPC attachment for Grafana’s outbound VPC.
- Once the VPC attachment is created, you can see that CIDR block of the VPC is propagated to the Transit gateway route table under “Routes” section, as seen in Figure 2.
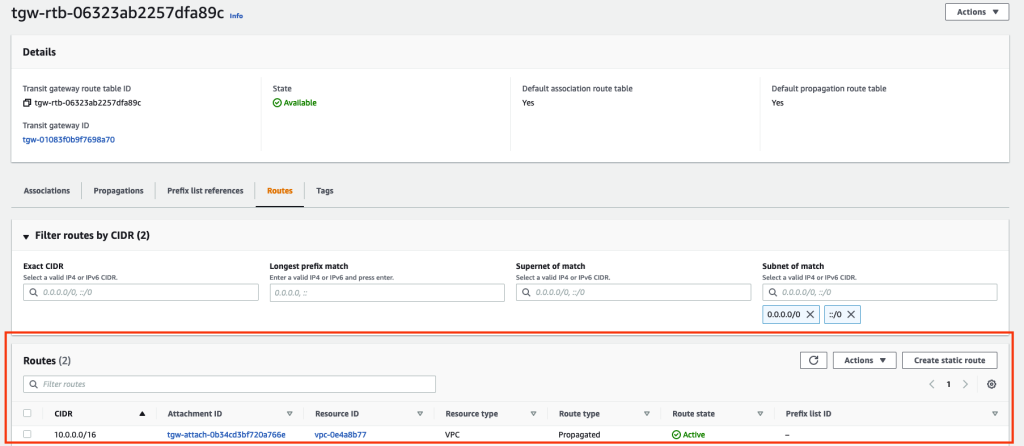
Figure 2.0: GrafanaOutboundVPC attachment route table for TGW in us-east-1
You can also perform this by using AWS CLI as follows. Ensure the placeholder strings such as aws_region and my_tgw and others are replaced with appropriate values.
aws ec2 create-transit-gateway --description <my_tgw> --region <aws_region> --options AmazonSideAsn=64512,AutoAcceptSharedAttachments=disable,DefaultRouteTableAssociation=enable,DefaultRouteTablePropagation=enable,VpnEcmpSupport=enable,DnsSupport=enableStep 2: Set up the Amazon Managed Service for Prometheus data source
Please refer to Amazon Managed Prometheus – Getting Started for information on how to create workspace for Amazon Managed Prometheus in eu-central-1 region.
Step 2.1 Configure AWS VPC Private link for Amazon Managed Service for Prometheus
To securely and privately connect Amazon Managed Grafana to data sources like Amazon CloudWatch, Prometheus, or AWS X-Ray in a different region, you need to set up AWS PrivateLink. AWS PrivateLink eliminates the requirement to use the public internet.
We will configure to use the following 2 service endpoints within Amazon Managed Service for Prometheus.
- com.amazonaws.region.aps-workspaces – This endpoint allows communicating with the Prometheus-compatible API offered by Amazon Managed Service for Prometheus. We can use this endpoint to send metrics data to Prometheus and query metrics from Prometheus.
- com.amazonaws.region.aps – This endpoint is used for performing workspace management tasks in Amazon Managed Service for Prometheus. We can use this endpoint to create, delete, and manage Prometheus workspaces that store the metrics data.
Please refer to Using Amazon Managed Service for Prometheus with interface VPC endpoints to create the VPC Private links for AMP.
When you create the VPC private links, under Additional settings deselect the checkbox for Enable DNS name.
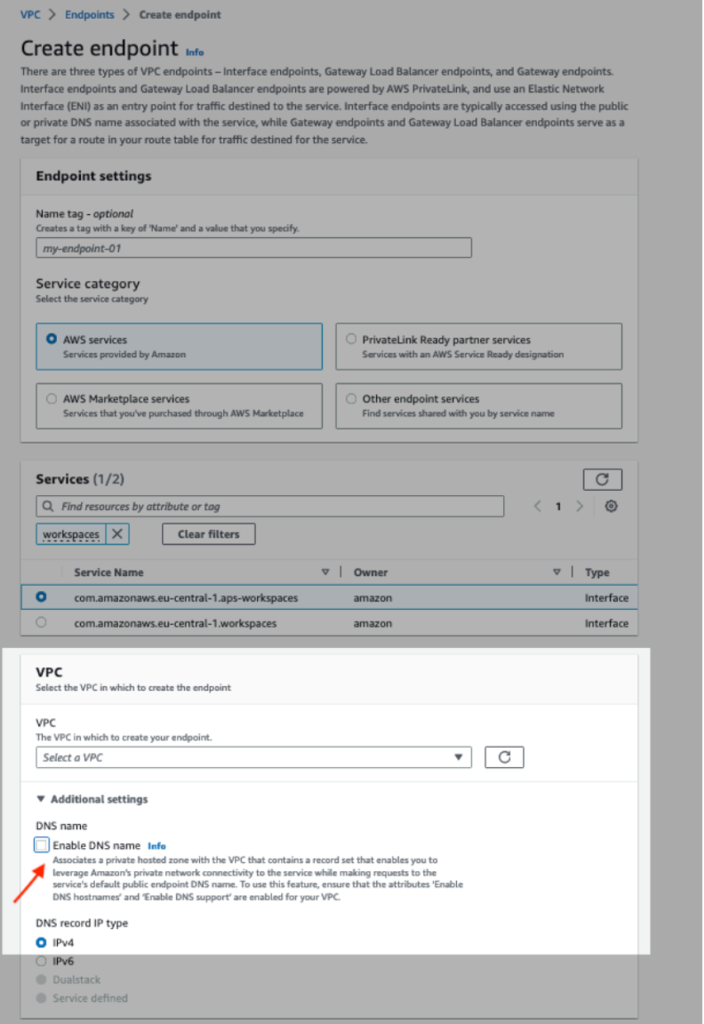
Figure 3.0: Disable Private DNS for the VPC private links for AMP
Once the 2 endpoints for Amazon Managed Prometheus are created, you can view them under the Endpoints widget in the AWS console.
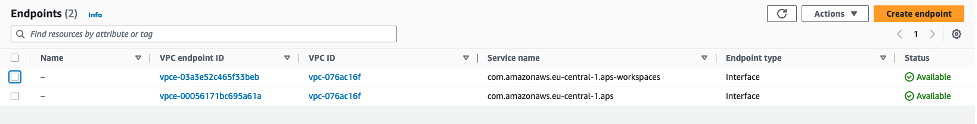
Figure 3.1: VPC private link for AMP
You can also create the VPC endpoints by using the below AW CLI commands. Ensure the placeholder string such as vpc_id, aws_region, security_group_ids, subnet_ids are replaced with appropriate values.
aws ec2 create-vpc-endpoint --vpc-id <vpc_id> --service-name com.amazonaws.<aws_region>.aps-workspaces --security-group-ids <security_group_ids> --vpc-endpoint-type Interface --subnet-ids <subnet_ids>aws ec2 create-vpc-endpoint --vpc-id <vpc_id> --service-name com.amazonaws.<aws_region>.aps --security-group-ids <security_group_ids> --vpc-endpoint-type Interface --subnet-ids <subnet_ids>Step 2.2 Setup AWS Transit gateway in eu-central-1 Region
You’ll need to create another AWS transit gateway in eu-central-1 Region to complete the private connectivity between Amazon Managed Grafana and Amazon Managed Prometheus.
- Please refer to Getting started with transit gateways for information on how to create a Transit gateway and create a VPC attachment for the VPC where VPC private links for AMP are created.
- For a VPC attachment, the CIDR block of the VPC is propagated to the transit gateway route table as seen in Figure 4.
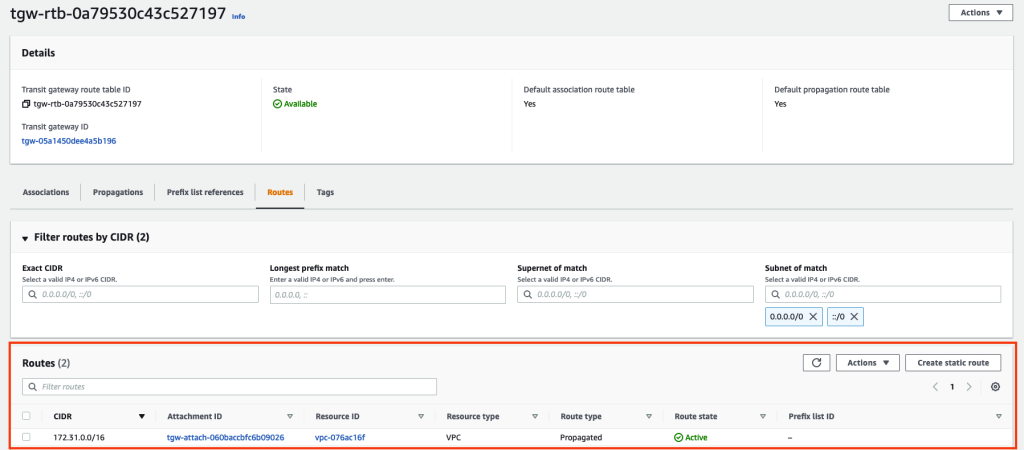
Figure 4.0: VPC attachment route table for TGW in eu-central-1
You can also do this by using AWS CLI as follows. Ensure the placeholder string such as AWS_REGION and others are replaced with appropriate values.
aws ec2 create-transit-gateway --description <my_tgw> --region <aws_region> --options AmazonSideAsn=64512,AutoAcceptSharedAttachments=disable,DefaultRouteTableAssociation=enable,DefaultRouteTablePropagation=enable,VpnEcmpSupport=enable,DnsSupport=enableStep 2.3 Initiate transit gateway peering attachment request
Now you have 2 AWS transit gateways created in US-EAST-1 Region and EU-CENTRAL-1 Region respectively. The next step enables to establish a peering connection between these 2 transit gateways. Please refer to Transit gateway peering attachments to create the peering attachment.
After you create a peering attachment request, the owner of the peer transit gateway (also referred to as the accepter transit gateway) must accept the request.
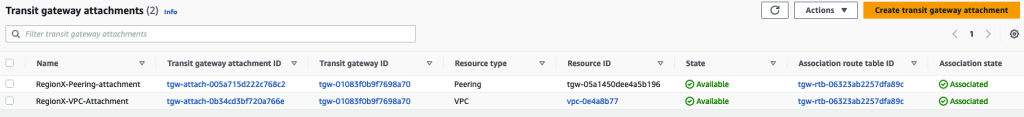
Figure 5.0: Transit gateway attachments in us-east-1
To route traffic between the transit gateways, you’ll need to add a static route to the transit gateway route table that points to the transit gateway peering attachment.
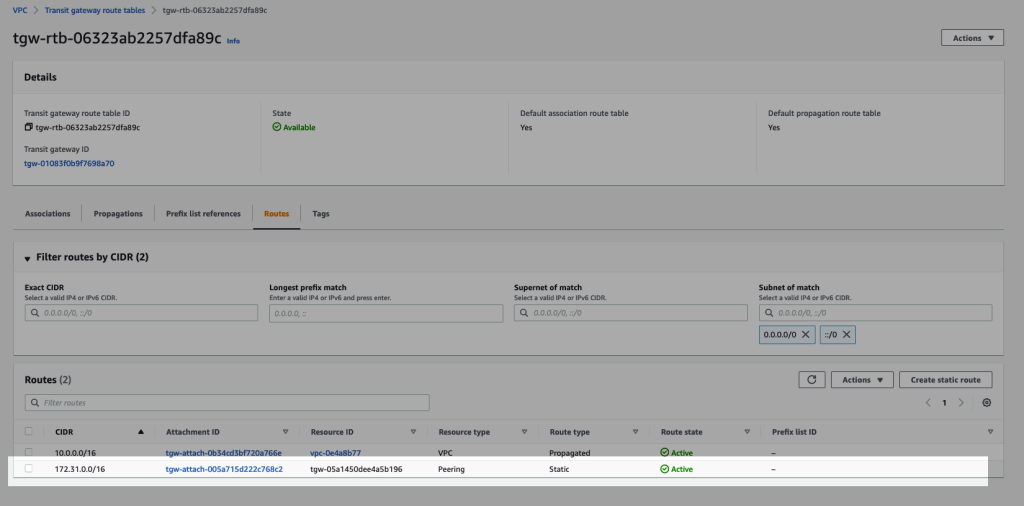
Figure 5.1: Transit gateway route table in us-east-1 that has a static route to its peering attachment
You can also create the peering attachment using AWS CLI as follows. Ensure the placeholder string such as aws_region, tgw_id and others are replaced with appropriate values.
aws ec2 create-transit-gateway-peering-attachment --transit-gateway-id <tgw_id1> --peer-transit-gateway-id <tgw_id2> --peer-account-id 123456789012 --peer-region <aws_region>You can also accept the peering attachment request using AWS CLI as follows. Ensure the placeholder string such as aws_region, tgw_attachment_id and others are replaced with appropriate values. In this case, –region parameter specifies the Region that the accepter transit gateway is located in.
aws ec2 accept-transit-gateway-peering-attachment --transit-gateway-attachment-id <tgw_attachment_id> --region <aws_region>Step 3: Setup Amazon Route 53 private hosted zone
When you create a VPC private link to an AWS service like Amazon Managed Service for Prometheus, you can enable Private DNS. This creates an AWS managed private hosted zone (PHZ) that allows resources within that VPC to resolve the DNS hostname for the service endpoint. However, this managed PHZ only works within the VPC it was created in. To enable DNS resolution across VPCs, you need to create your own Route53 private hosted zone.
As mentioned in Step 2.1, when creating a VPC private link for AMP we need to disable Private DNS. Please refer to Creating a private hosted zone to create private hosted zones for AMP service endpoints to resolve requests to Amazon Managed Service for Prometheus workspace to be routed through the VPC private link.
When creating the private hosted zones, for VPCs to associate with the hosted zone, select Amazon Managed Grafana’s outbound VPC in Region us-east-1.
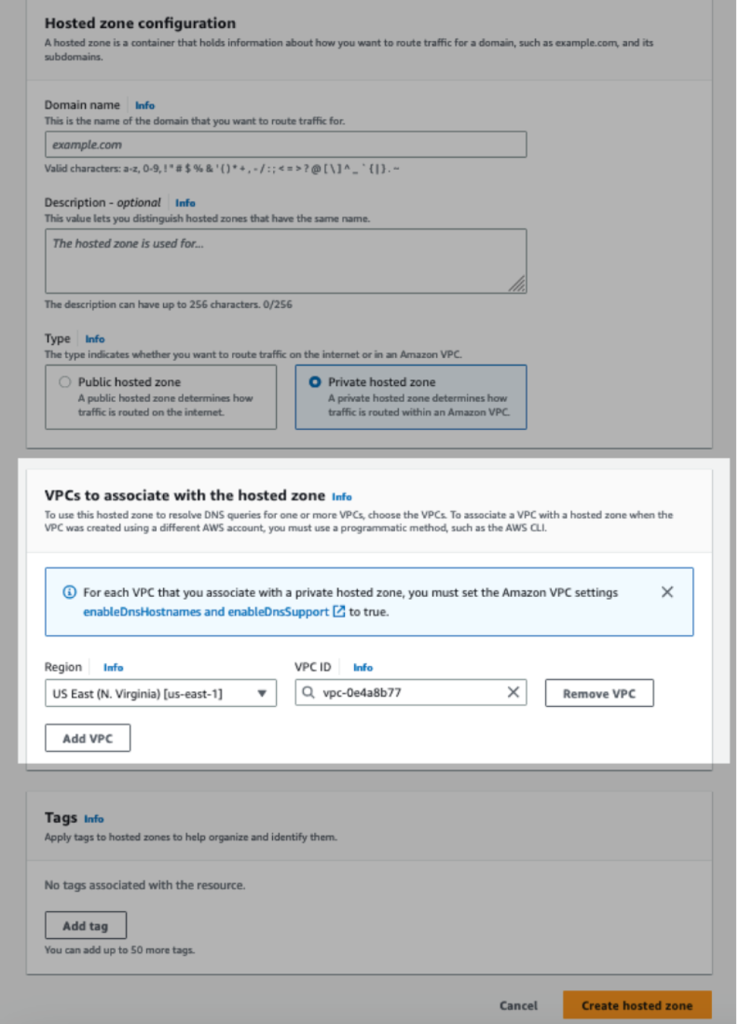
Figure 6.0: Associate the private hosted zones with Amazon Managed Grafana’s outbound VPC
You can also create the private hosted zone using AWS CLI as follows. Ensure the placeholder string such as amp_service_endpoint_dns_name,vpc_id,vpc_region and others are replaced with appropriate values.
aws route53 create-hosted-zone --name <amp_service_endpoint_dns_name> --caller-reference <any unique string> --vpc VPCRegion=<vpc_region>,VPCId=<vpc_id> --hosted-zone-config Comment='using cli',PrivateZone=trueAfter the private zone is created, you can create a record set using AWS CLI as follows:
- Modify and save the below json file(MyRecordSet.json) that will be used to create a simple Alias record set. Ensure the placeholder strings such as AMP_SERVICE_ENDPOINT_DNS_NAME,VPC_ENDPOINT_DNS_NAME are replaced with appropriate values.
{
"Comment": "Create a new A record ",
"Changes": [{
"Action": "CREATE",
"ResourceRecordSet": {
"Name": "<amp_service_endpoint_dns_name>",
"Type": "A",
"TTL": 300,
"ResourceRecords": [{ "Value": "<vpc_endpoint_dns_name>"}]
}
}]
}
Run below command to add the new record. Ensure the placeholder string such as hosted_zone_id is replaced with appropriate values.
aws route53 change-resource-record-sets --hosted-zone-id <hosted_zone_id> --change-batch file://MyRecordSet.jsonYou now need to create 2 private hosted zones inside Amazon Route 53.
- Create one Hosted zone with domain name aps.eu-central-1.amazonaws.com
- Create an A record with value as the regional DNS name of the VPC private link for com.amazonaws.eu-central-1.aps
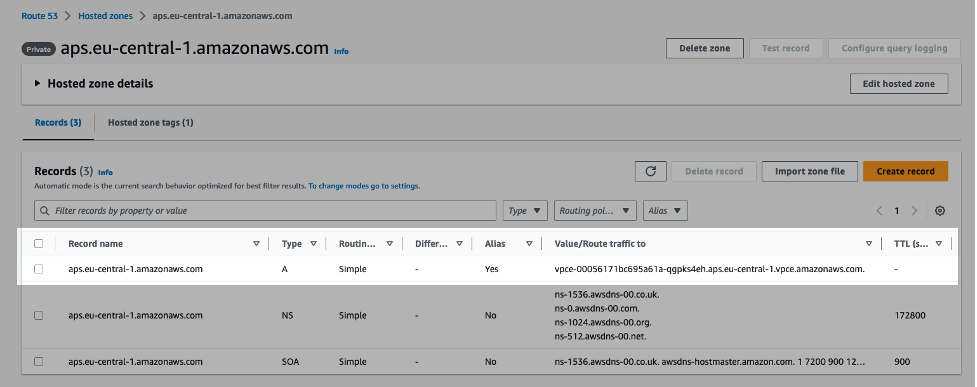
Figure 6.1: Route 53 Private Hosted Zone for AMP service endpoint aps.eu-central-1.amazonaws.com
- Create a second Hosted zone with domain name aps-workspaces.eu-central-1.amazonaws.com.
- Create an A record with value as the regional DNS name of the VPC private link for com.amazonaws.eu-central-1.aps-workspaces.
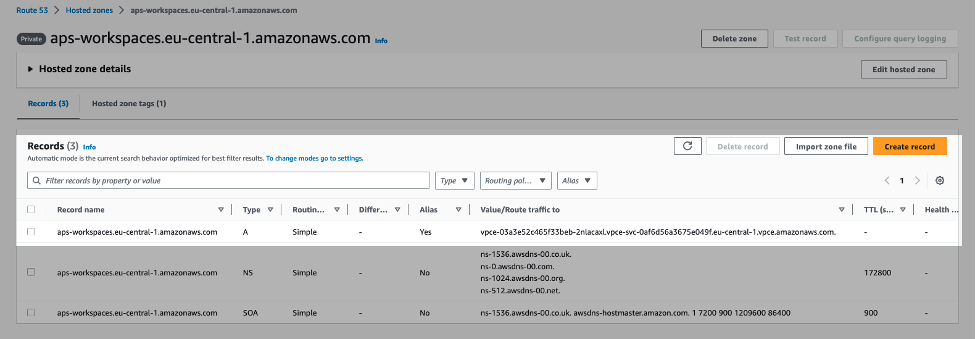
Figure 6.2: Route 53 Private Hosted Zone for AMP service endpoint aps-workspaces.eu-central-1.amazonaws.com
Step 4: Test Amazon Managed Service for Prometheus data source connectivity from Amazon Managed Grafana
To test the connectivity from your Amazon Managed Grafana workspace hosted in us-east-1 to Amazon Managed Service for Prometheus workspace hosted in eu-central-1, we can follow the below steps.
Step 4.1: Set up the Amazon Managed Service for Prometheus as data source inside Amazon Managed Grafana
Once you login to your Amazon Grafana workspace, to configure the data source, click AWS, choose Data Sources, navigate to Data sources tab, for Service search and select Amazon Managed Service for Prometheus, for regions select Europe (Eu-central-1).
Select the checkbox for the AMP data source listed and click Add 1 data source. The Amazon Managed Service for Prometheus workspace in Region eu-central-1 is now configured as the data source for Amazon Managed Grafana in Region eu-central-1.
Step 4.2: Ensuring the connectivity
Under data sources for Amazon Managed Grafana, select Amazon Managed Service for Prometheus, choose the Prometheus data source and click Go to Settings.
Under Settings, leave the default values as is and click Save&Test. You should see a message “Data Source is working”. We have successfully established a private secure connection between inter-region Amazon Managed Service for Prometheus and Amazon Managed Grafana.
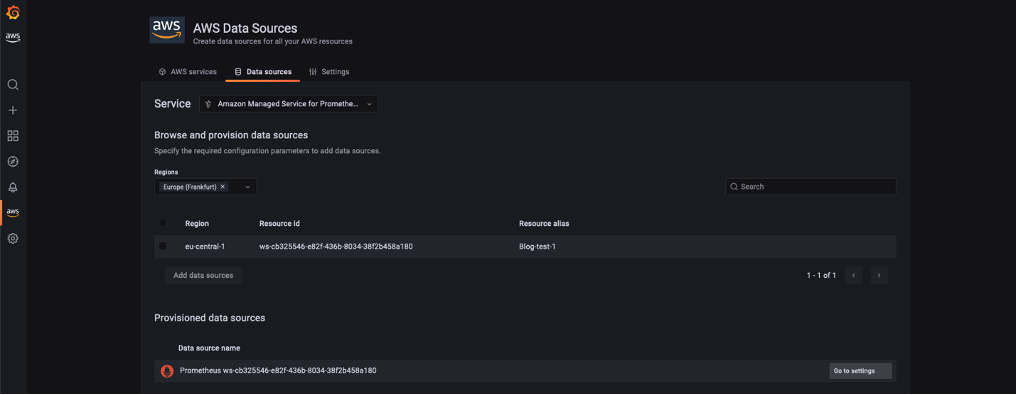
Figure 7.0: Configuring AMP data sources in Amazon Managed Grafana
Cleaning up
Be sure to delete any Amazon Managed Grafana and Amazon Managed Service for Prometheus workspaces, or AWS Transit Gateways to avoid charges. Cancel Grafana Enterprise trial before 30 days to avoid fees after free period ends.
Conclusion
In this post, we walked through how to securely connect Amazon Managed Grafana deployed in one AWS region (us-east-1) to Amazon Managed Service for Prometheus deployed in another AWS region (eu-central-1). Using AWS PrivateLink and AWS Transit Gateway, we established an encrypted private connection between the regions that allowed Amazon Managed Grafana to query Amazon Managed Service for Prometheus across accounts and regions.
With this setup, you gain the benefits of deploying resources in separate regions for high availability while still being able to analyze your metrics and logs in a centralized Amazon Managed Grafana dashboard. This architecture can be expanded to incorporate other data sources across accounts and regions and services like Amazon OpenSearch Service.