AWS Cloud Operations Blog
How to auto add new cross-account Amazon EC2 instances in a central Amazon CloudWatch dashboard
Managing various metrics of Amazon Elastic Compute Cloud (Amazon EC2) instances in multiple accounts can be challenging, especially if new instances are launched regularly. Amazon CloudWatch has a cross-account dashboard functionality that provides you with cross-account visibility to various metrics without having to log in and out of different accounts. In addition, CloudWatch dashboards are customizable home pages in the CloudWatch console that let you monitor your resources in a single view, including resources from different AWS accounts.
In this post, we will walk through the steps for automatically adding specific metrics of newly launched EC2 instances from cross-accounts to a central CloudWatch dashboard widget in the monitoring account. This method uses search expressions, which are a type of math expression that you can add to CloudWatch graphs. Search expressions let you create dynamic graphs that automatically add appropriate metrics to their display, even if those metrics don’t exist when you first create the graph. Note that the search expressions implemented in this post will graph existing EC2 instances and newly launched instances.
Overview of solution
The following diagram illustrates the solution architecture for this post. We have a monitoring account where the central CloudWatch dashboard resides. We have a cross-account, referred to as Account X, where new EC2 instances are launched. The objective is to include metrics from newly launched EC2 instances into the central CloudWatch dashboard. In this post, we will include the CPUUtilization metric. Metrics from existing instances in the cross-account can also be tracked in the central dashboard. The method can be extended to include metrics from EC2 instances in multiple AWS accounts and the monitoring account.
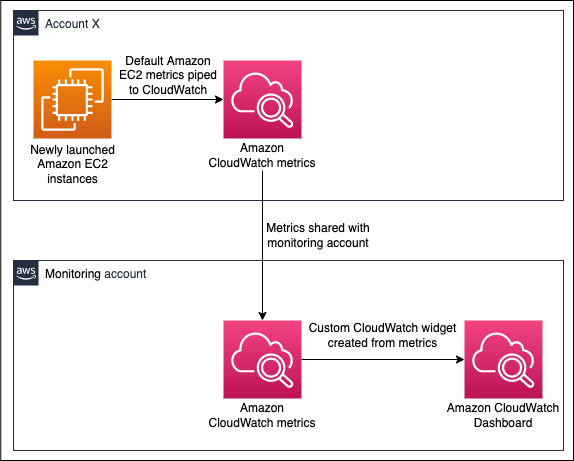
Figure 1: Cross Account CloudWatch Dashboard Architecture
Walkthrough
In this section, we will guide you through the steps required to deploy the cross-account Amazon EC2 monitoring method in your AWS account, and to test the solution on newly launched Amazon EC2 instances in the cross-account.
The high-level steps are as follows:
- Enable cross-account CloudWatch metrics sharing in the cross-account
- (Optional): Launch an EC2 instance in the cross-account
- Enable viewing in the monitoring account
- Create a custom dashboard in the monitoring account
- Create a dashboard widget in the dashboard that tracks cross-account instances
- Launch an EC2 instance in the cross-account
- View the metrics of the new instance in the monitoring account dashboard
Step 1: Enable cross-account sharing in the cross-account
If you have already enabled cross-account sharing in Account X, then this step is optional. This step is also documented in the CloudWatch documentation at Cross-account cross-Region CloudWatch console.
- Sign in to Account X.
- In the CloudWatch console, choose Settings, and then under Cross-account cross-region, choose Configure.
- Under Share your CloudWatch data, choose Share data.
- Under Sharing, choose Specific accounts, and then choose Add account. Enter the monitoring account ID.
- Under Permissions, keep the defaults.
- Under Create CloudFormation Stack, choose Launch CloudFormation template.
- On the confirmation page, type
Confirm, and then choose Launch template. - Select the I acknowledge check box, and then choose Create stack.
Step 2 (Optional): Launch an Amazon EC2 instance in the cross-account
If there are already EC2 instances that are launched in Account X, then this step is optional. For instructions on how to launch an EC2 instance, refer to the Tutorial for getting started with Amazon EC2 Linux instances.
- In the Amazon EC2 console, choose Instances, and then select Launch instances.
- Select the Amazon Linux 2 AMI (HVM), and then select Review and Launch.
- Select Launch.
- In the dropdown, select Proceed without a key pair, check the acknowledgement checkbox, and then select Launch Instances.
Step 3: Enable viewing in the monitoring account
If you have already enabled viewing for cross-account CloudWatch data in the monitoring account for Account X, then this step is optional.
- Sign in to the monitoring account.
- In the CloudWatch console, choose Settings, and then under Cross-account cross-region, choose Configure.
- Under View cross-account cross-region, choose Enable.
Under Enable account selector, choose Custom account selector, and then enter the accounts that you will be monitoring. For example:
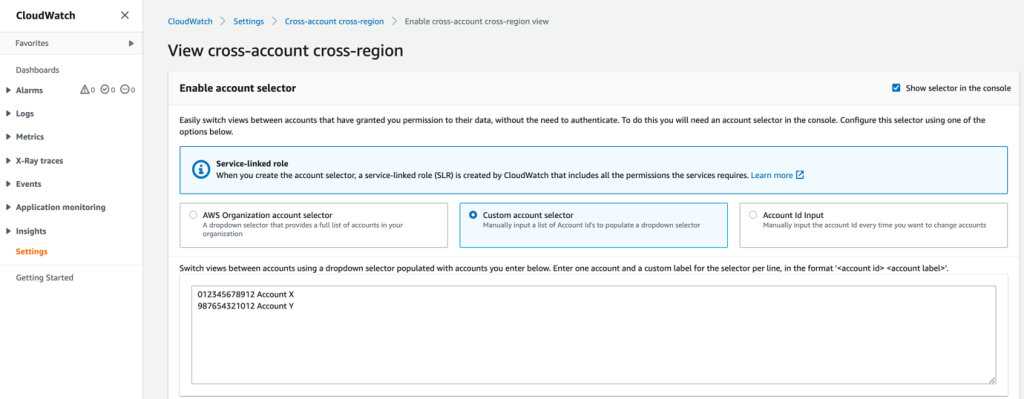
Figure 2: Add account IDs and their labels to the custom account selector
- Choose Enable.
Step 4: Create a custom dashboard in the monitoring account
- In the CloudWatch console, choose Dashboards, and select Create dashboard.
- On the confirmation page, type
Confirm, and enter a name for the dashboard. Example:CloudWatch-Default, then select Create dashboard.
Step 5: Create a widget in the dashboard that tracks the CPU utilization of cross-account instances
- On the Add widget page, select Line.
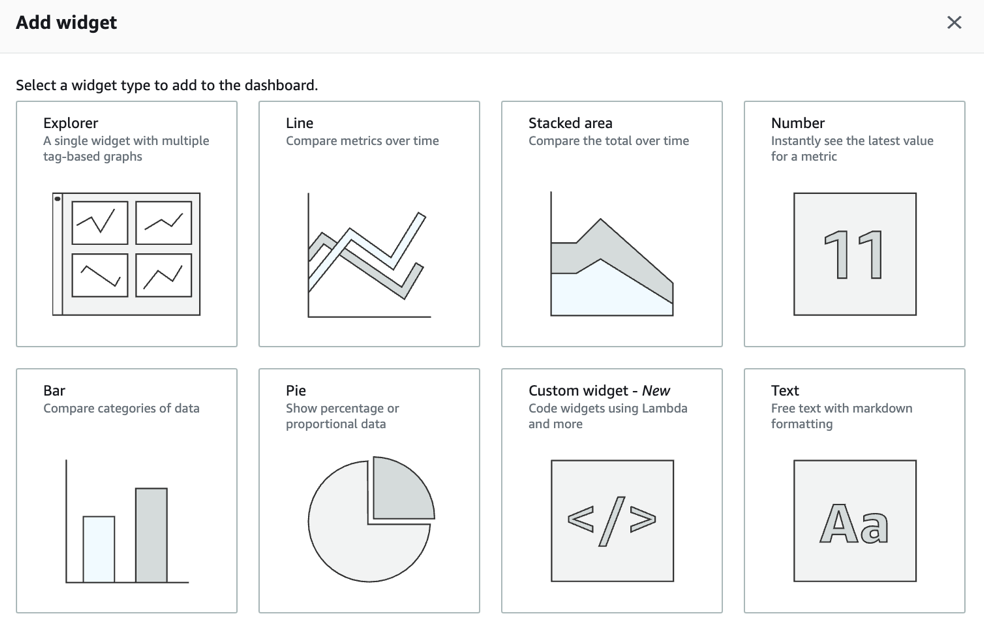
Figure 3: Various widget options. Select Line widget
- On the Add to this dashboard page, select Metrics.
- Under Source, enter the JSON below, and then replace ‘Account X ID’ with the Account ID of Account X. Select Update to preview the graph. This JSON uses a CloudWatch SEARCH expression, which can automatically search for new instances that are launched. For more information, refer to the AWS documentation for the CloudWatch search expression syntax. If Step 2 was completed, a line for the launched instance can be in the graph. Once completed, select Create widget. Note that the search expression is scoped to a single region – in this example, us-east-1. To track instances in different regions in a single dashboard, you must do this on a second widget, or add another expression.
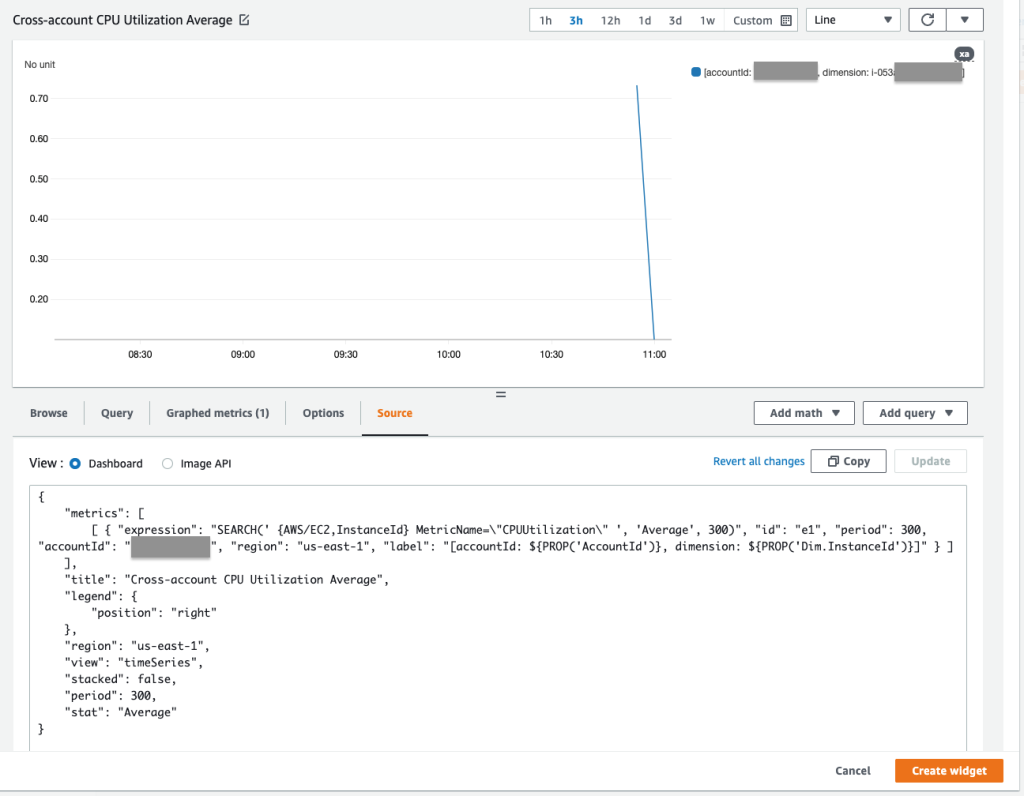
Figure 4: Enter the JSON that uses the SEARCH expression for cross-account metrics and preview the resulting graph
- (Optional) If there was more than one cross-account to be monitored, then refer to the JSON provided below for reference, where Amazon EC2 instances from Account X and Account Y are being monitored in this widget. Replace ‘Account X ID’ and ‘Account Y ID’ with the Account ID of Account X and Account Y, respectively.
- This adds the widget to the dashboard.
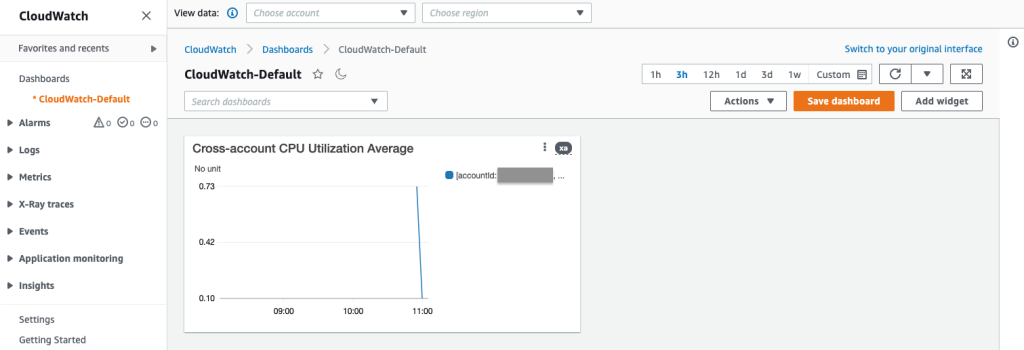
Figure 5: Widget added to the dashboard based on the JSON configuration
- Select Save dashboard to save the changes made.
Step 6: Launch an Amazon EC2 instance in the cross-account
- Sign in to Account X.
- In the Amazon EC2 console, choose Instances, and then select Launch instances.
- Select the Amazon Linux 2 AMI (HVM), and then select Review and Launch.
- Select Launch.
- In the dropdown, select Proceed without a key pair, check the acknowledgement checkbox, and then select Launch Instances.
- Note the instance ID. This is used to verify that the new instance was added to the widget in the monitoring account. In the following screenshot, the Instance ID starts with “i-010”.
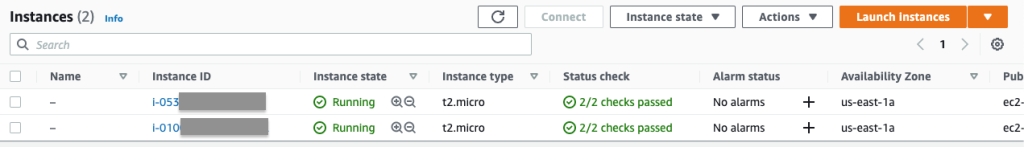
Figure 6: EC2 instances launched in Account X
Step 7: View the metrics of the new instance in the monitoring account dashboard
- Sign in to the monitoring account.
- In the CloudWatch console, choose Dashboards, and then select the name of the dashboard that was configured in Step 4 – in this example, it is CloudWatch-Default.
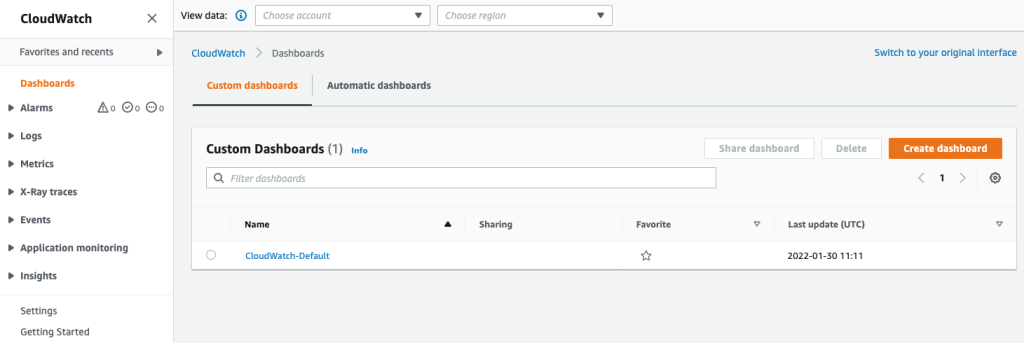
Figure 7: Select the CloudWatch-Default dashboard that was created in Step 4
- This brings up the dashboard and we can see that there is an additional line in the graph. If you don’t see the additional line, then wait for a few minutes to let the CPU utilization metric be piped to CloudWatch since the instance was just launched.
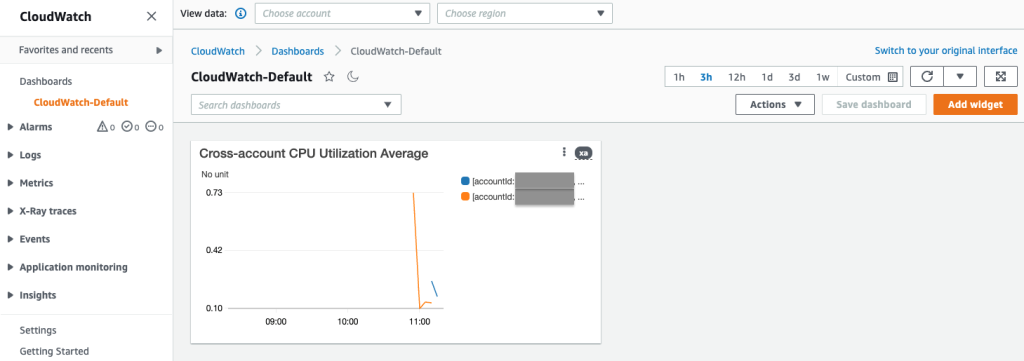
Figure 8: The monitoring account’s CloudWatch dashboard widget shows data points from Account X’s newly launched EC2 instance
- Hover over the title of the widget, and select the Maximize icon to expand the widget.
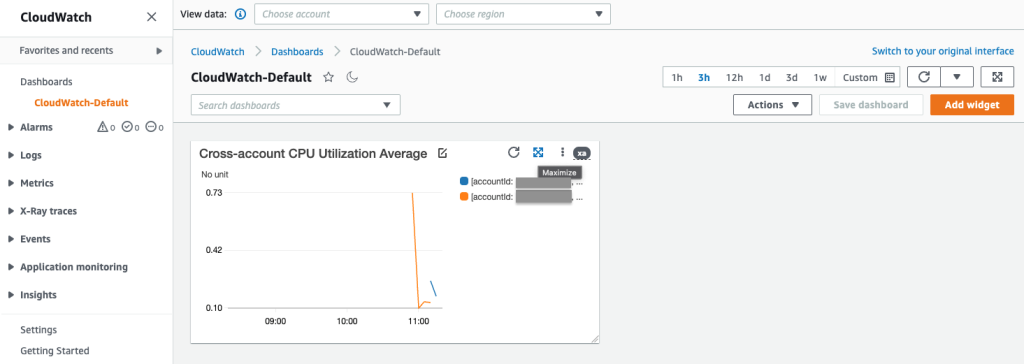
Figure 9: CloudWatch dashboard widgets can be maximized to view the full legend
- The expanded widget shows the instance IDs for each line, where we can verify that it corresponds to the Amazon EC2 Instance that was launched in the previous steps.
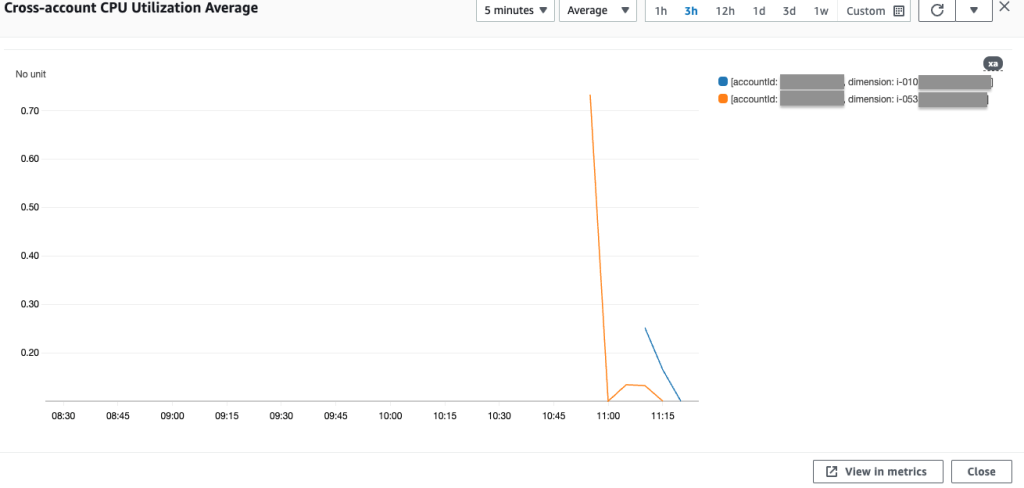
Figure 10: Verify that the Instance ID of the newly added EC2 instance matches the Instance ID recorded from Step 6
Cleaning up
To avoid incurring future charges, the following steps will clean up the deployed resources:
- Delete the Amazon CloudWatch dashboard:
- Sign in to the monitoring account.
- In the CloudWatch console, choose Dashboards.
- Select the dashboard that was created, then select Delete. When prompted again, select Delete.
- Delete the Amazon EC2 instances:
- Sign in to Account X.
- In the Amazon EC2 console, choose Instances.
- Select the checkbox for all of the launched instances, then under the Instance state dropdown, select Terminate instance.
Conclusion
In this post, you learned a method for monitoring metrics from existing and newly launched Amazon EC2 instances in cross accounts in a central dashboard of a monitoring account. This lets administrators have a bird’s-eye view of all of the instances in multiple accounts to streamline monitoring processes. In the example scenario, we monitored the CPU utilization metric. This can be extended to other CloudWatch EC2 instance metrics. Refer to this list of available CloudWatch metrics for your instances. In addition, you can use search expressions for any metric name and namespace, which includes namespaces such as “AWS/EBS” and “AWS/Lambda”. For an example of how to use search expressions with the “AWS/EBS” and “AWS/NetworkELB” namespaces, refer to the AWS documentation on search expression examples.
Moreover, refer to the official documentation to learn more about CloudWatch cross-account and cross-Region functionalities.
Author: