AWS Cloud Operations Blog
Monitoring Windows services with Amazon CloudWatch
If you run Windows workloads on Amazon Elastic Compute Cloud (Amazon EC2), monitoring the health and performance of your Windows Services is essential for reliable systems administration. It’s not just about ensuring uptime; it’s about having a pulse on your system’s health and performance. With a variety of services operating in the background, each playing a crucial role in the functionality of your applications, it becomes imperative to have a monitoring strategy in place.
This isn’t merely about catching issues as they arise; it’s about proactively managing your environment to ensure smooth, uninterrupted service. Whether you’re running critical business applications, hosting websites, or managing databases, understanding the status of your Windows services is key to maintaining operational excellence.
In this post, you will dive into how you can leverage Amazon CloudWatch, enhanced with the procstat plugin, to bring efficiency and clarity to your monitoring routine, using the data to display on CloudWatch dashboards, create CloudWatch alarms and analyze log data with CloudWatch Logs Insights.
Solution overview
The solution will use the CloudWatch agent configuration wizard to build a configuration for Windows Server. You will then use the procstat plugin to add per-process metrics to monitor Windows services. Finally, you’ll create a CloudWatch dashboard and CloudWatch alarm to utilize the data you have collected.
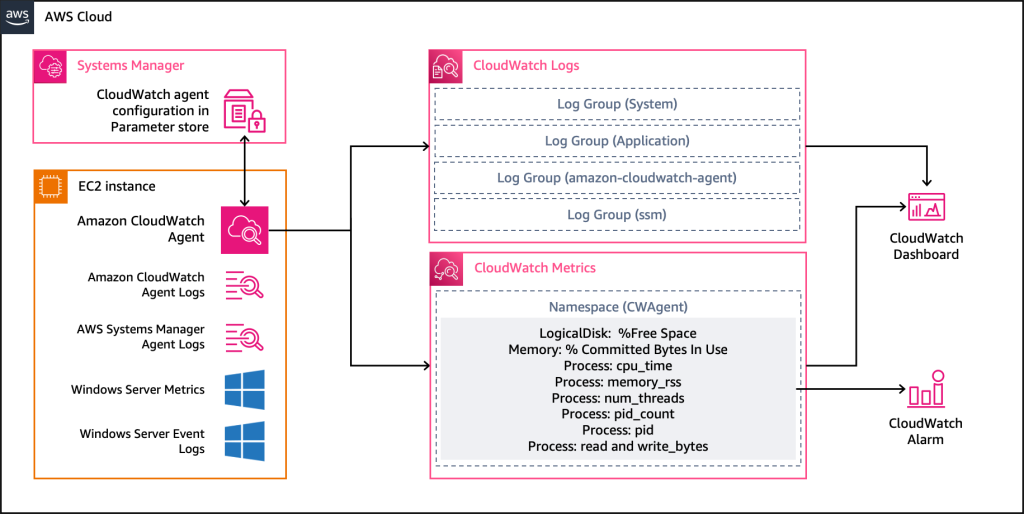
Figure 1: Architecture for sending Windows Server logs and metrics to CloudWatch
Prerequisites
To follow along with this post, you need the following prerequisites:
- An active AWS account
- An Amazon EC2 instance running Windows with the Amazon CloudWatch agent installed. See Installing the CloudWatch agent using AWS Systems Manager.
Configure the CloudWatch Agent
- Log on to your Amazon EC2 instance running Windows
- Open PowerShell
- Run the CloudWatch agent configuration wizard:
cd "C:\Program Files\Amazon\AmazonCloudWatchAgent"
.\amazon-cloudwatch-agent-config-wizard.exe
Choose the following options for metrics (adjust according to your requirements). Where the default choice matches the option, you can just press enter, only the non-default choices are documented below:
- Do you want to turn on StatsD daemon? 2. No
- Continue with the following options for log files (adjust according to your requirements). Where the default choice matches the option, you can just press enter, only the non-default choices are documented below:
- Log file path: c:\ProgramData\Amazon\AmazonCloudWatchAgent\Logs\amazon-cloudwatch-agent.log to send the CloudWatch agent logs to Amazon CloudWatch Logs
- Log group name: amazon-cloudwatch-agent
- Repeat steps for c:\ProgramData\Amazon\SSM\Logs\amazon-ssm-agent.log and c:\ProgramData\Amazon\SSM\Logs\errors.log using ssm as the Log group name to send SSM agent logs to CloudWatch Logs
- Do you want to specify any additional log files to monitor? 2. No
- Continue with the following options for the Windows event log (adjust according to your requirements):
- Repeat steps for other event logs which could include Application, Security, Setup and Forwarded Events. For now, include Application for Windows event log name.
- Do you want to specify any additional Windows event log to monitor? 2. No
- You now have the option to configure the CloudWatch agent for X-ray traces. You can skip this step unless your application is using tracing:
- Do you want the CloudWatch agent to also retrieve X-ray traces? 2. No
- The wizard has created a new config file and saved it as C:\Program Files\Amazon\AmazonCloudWatchAgent\config.json. You can optionally store the config in the Systems Manager Parameter Store:
- Do you want to store the config in the SSM parameter store? 1. Yes
- What parameter store name do you want to use to store your config? (Use ‘AmazonCloudWatch-‘ prefix if you use our managed AWS policy) AmazonCloudWatch-windows
- Which region do you want to store the config in the parameter store? Choose default choice as this will depend on the region you are using
- Which AWS credential should be used to send json config to parameter store? Choose default choice
- Examine the configuration and press enter to exit
Start the agent
Run the following command to start the agent
& "C:\Program Files\Amazon\AmazonCloudWatchAgent\amazon-cloudwatch-agent-ctl.ps1" -a fetch-config -m ec2 -s -c file:"C:\Program Files\Amazon\AmazonCloudWatchAgent\config.json"If you saved the config to Systems Manager, you could also use the Systems Manager parameter:
& "C:\Program Files\Amazon\AmazonCloudWatchAgent\amazon-cloudwatch-agent-ctl.ps1" -a fetch-config -m ec2 -s -c ssm:AmazonCloudWatch-windowsYou’ll shortly start to be able to see your logs and metrics in the CloudWatch console. You have Windows event logs, logs from the CloudWatch agent and Systems Manager agent and additional host metrics. But you’re not quite finished yet, you want to be able to see the status of Windows Services.
Using the procstat plugin
The procstat plugin enables you to collect metrics from individual processes. It is supported on servers running Windows Server 2012 or later.
To view your configuration file, run the following command in PowerShell or open C:\Program Files\Amazon\AmazonCloudWatchAgent\config.json in an editor:
cat config.jsonNow, you are going to collect metrics using procstat so that you can determine if your service is running and analyze performance metrics for the process. See Metrics collected by procstat for Windows processes, you should configure with exe. On servers running Windows Server, search strings are evaluated as WMI queries. An example would be pattern: “%amazon-cloudwatch-agent%”. For more information, see LIKE Operator.
To get started, find the processes that you would like to monitor, you can start with CloudWatch and Systems Manager, to discover the process names, run the following commands:
get-process *cloudwatch*
Handles  NPM(K)   PM(K)   WS(K)   CPU(s)    Id  SI ProcessName
-------  ------   -----   -----   ------    --  -- -----------
    390      19   53696   74008   127.84  7660   0 amazon-cloudwatch-agent
     64       7   12700    5928     0.02  3952   0 start-amazon-cloudwatch-agent
get-process *ssm*
Handles  NPM(K)   PM(K)   WS(K)   CPU(s)    Id  SI ProcessName
-------  ------   -----   -----   ------    --  -- -----------
    278      12   23508   20360    11.42  6468   0 amazon-ssm-agent
    335      17   27988   28892    27.22  3836   0 ssm-agent-worker
    268      14   23068   21376     0.11  5728   0 ssm-session-worker
Now you need to edit the configuration file. Editing the file in Systems Manager Parameter Store is the preferred method as you will have a copy to deploy elsewhere, but you can use a text editor on your Windows Server or even use the command line to edit the file if you are feeling brave.
To monitor the two agents, you are going to use amazon-cloudwatch-agent and ssm-agent as the search strings based on the Windows process names.
Edit the config file
To edit the parameter in AWS Systems Manager:
- Navigate to Systems Manager
- Choose Parameter Store under the Application Management menu
- Choose AmazonCloudWatch-windows
- Choose Edit
- Add the following to the config file in Value, directly underneath “metrics_collected”: {
            "procstat": [
                {
                    "exe": "ssm-agent",
                    "measurement": [
                        "cpu_time_system",
                        "cpu_time_user",
                        "memory_rss",
                        "num_threads",
                        "pid_count",
                        "pid",
                        "read_bytes",
                        "write_bytes"
                    ]
                },
                {
                    "exe": "amazon-cloudwatch-agent",
                    "measurement": [
                        "cpu_time_system",
                        "cpu_time_user",
                        "memory_rss",
                        "num_threads",
                        "pid_count",
                        "pid",
                        "read_bytes",
                        "write_bytes"
                    ]
                }
            ],
- Don’t forget the trailing comma, this separates the procstat metrics from your existing disk and memory metrics.
- Choose Save changes
Restart the agent with the updated config
If you saved edited the config in SSM, run the following command on your EC2 instance:
& "C:\Program Files\Amazon\AmazonCloudWatchAgent\amazon-cloudwatch-agent-ctl.ps1" -a fetch-config -m ec2 -s -c ssm:AmazonCloudWatch-windows
Otherwise, if you updated the config file on your EC2 instance, Run the following command:
& "C:\Program Files\Amazon\AmazonCloudWatchAgent\amazon-cloudwatch-agent-ctl.ps1" -a fetch-config -m ec2 -s -c file:"C:\Program Files\Amazon\AmazonCloudWatchAgent\config.json"
To deploy the configuration to other instances or this instance using Systems Manager, follow the instructions to Start the CloudWatch agent using Systems Manager Run Command. This is best practice for deploying the configuration to multiple EC2 instances. See AWS Prescriptive Guidance for advice on managing CloudWatch agent configurations.
Create a Dashboard
You can use CloudWatch dashboards to create customized views of the metrics, logs and alarms for your AWS resources.
Add metrics:
- Navigate to CloudWatch
- Choose All Metrics from the navigation menu
- Enter amazon-ssm-agent.exe in the metric search box
- Choose Graph search
- Choose Options
- Choose Number as the Widget type
- Ensure Display sparkline at bottom is selected
- Under Actions, select Add to dashboard
- Choose Create new
- Enter a name such as windows-services for Dashboard name
- Choose Create
- Enter a name such as SSM Agent for Widget Name
- Choose Add to dashboard
- Turn Autosave on!
- Repeat Steps 2-9 for but enter the following in the search:
- exe : amazon-cloudwatch-agent
- process_name !: start-amazon-cloudwatch-agent.exeThis will ensure that you are just monitoring the agent process.
- Choose windows-services for Select dashboard
- Enter a name such as CloudWatch Agent for Widget Name
- Choose Add to dashboard
- Choose All Metrics from the navigation menu
- Enter pid_count in the metric search box
- Enter exe=amazon-cloudwatch-agent in the metric search box
- Repeat steps 4-8, 16
- Enter a name such as CW pid count for Widget Name
- Choose Add to dashboard
- Repeat steps 20-24 but enter pid_count and exe=ssm-agent in the metric search box and SSM pid count for Widget Name
The pid count metric allows you to monitor the status of your Windows services. If the value falls to below the expected value, you know that the correct number of processes are not running. Now you can add the logs to your dashboard:
- Choose Logs Insights from the navigation menu
- Choose the amazon-cloudwatch-agent and ssm log groups
- Delete | limit 20 from the query
- Choose Run query
- Choose Add to dashboard
- Choose windows-services for Select dashboard
- Enter CloudWatch and SSM for Widget Name
- Choose Add to dashboard
After resizing and moving the widgets, you should now have a service dashboard that looks like this:
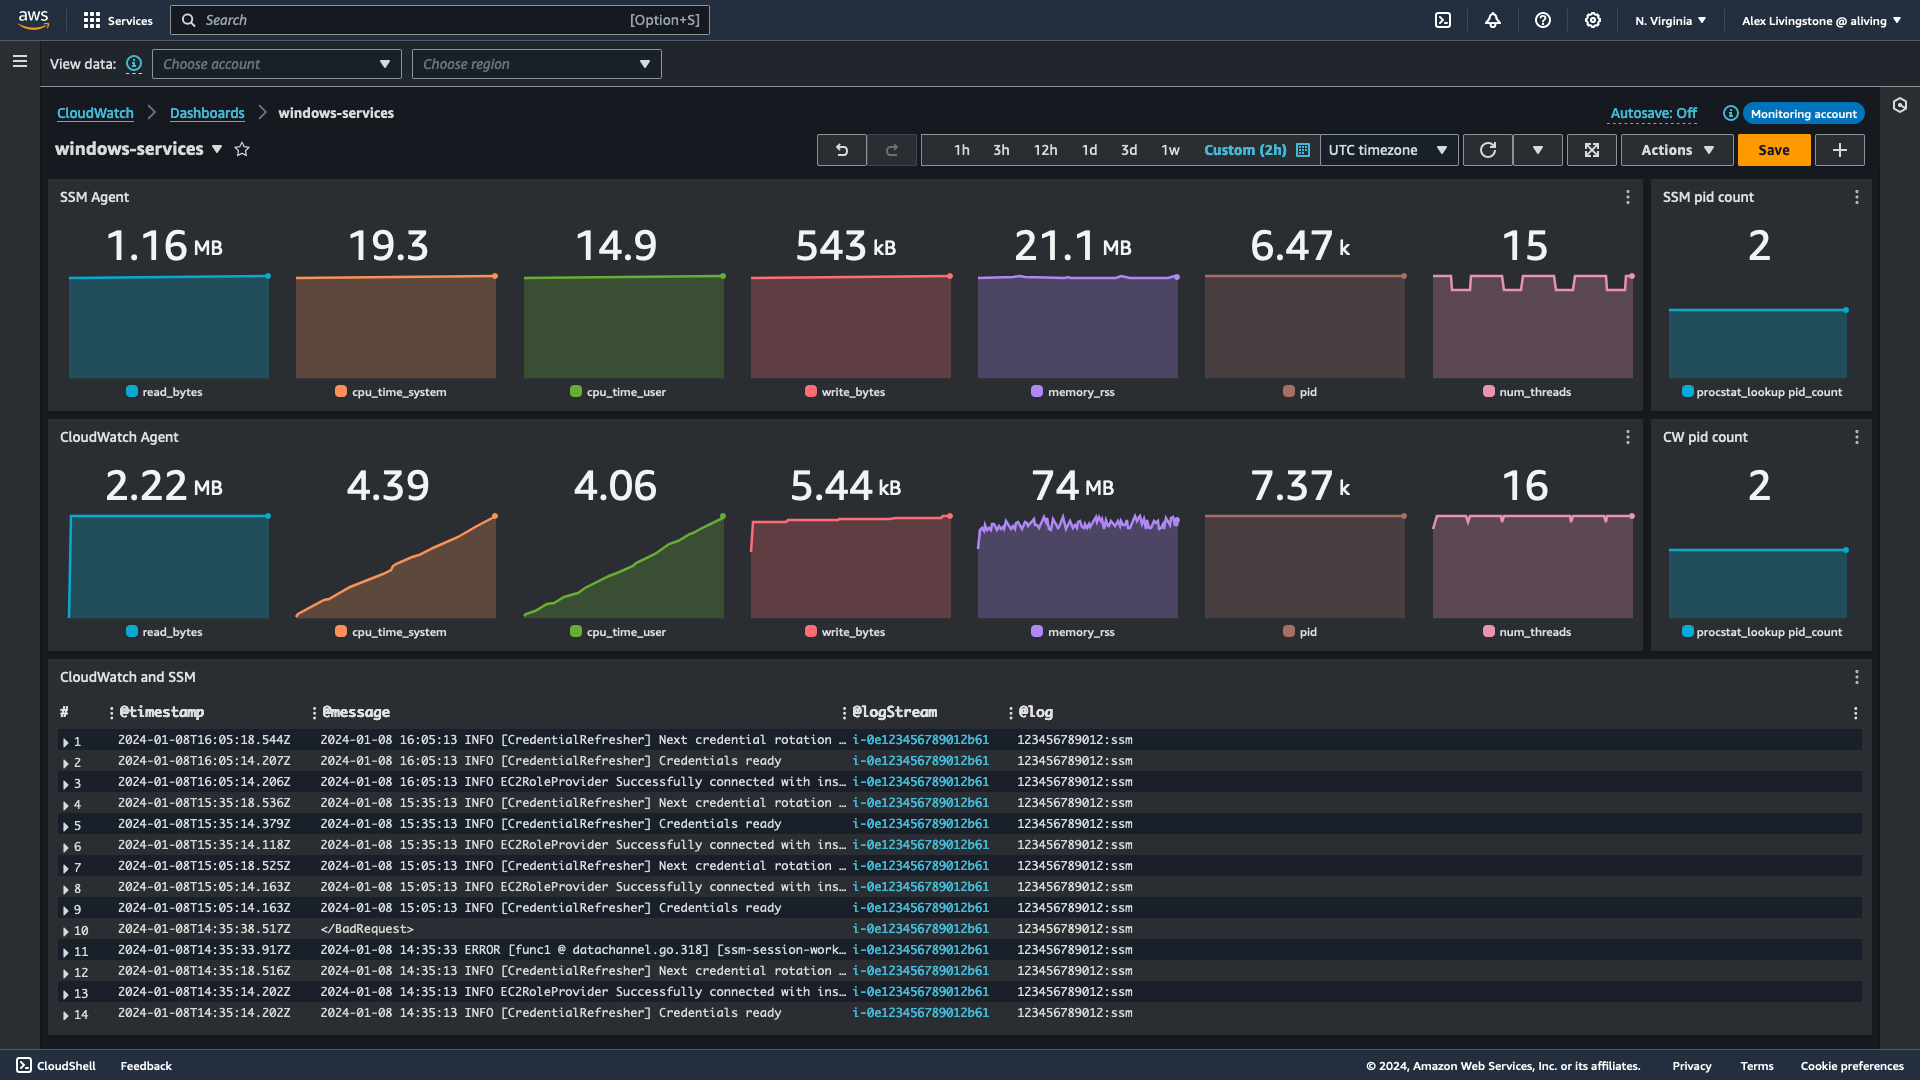
Figure 2: CloudWatch dashboard with procstat metrics and CloudWatch logs
Create an Alarm
- Open your dashboard
- Choose the Options menu from CW pid count
- Choose View in metrics
- Choose the bell icon (Create alarm)
- Change alarm condition to Lower
- Change threshold to 2
- Choose Next and follow your standard process for creating alarms
Cleanup
- Stop the CloudWatch Agent:
& "C:\Program Files\Amazon\AmazonCloudWatchAgent\amazon-cloudwatch-agent-ctl.ps1" -a stop
- Delete windows-services dashboard
- Delete ssm and amazon-cloudwatch-agent log groups
Conclusion
Harnessing Amazon CloudWatch alongside the procstat plugin offers a robust solution for monitoring your Windows services on EC2. This approach not only ensures operational uptime but also provides a granular view of your system’s health and performance. By following the steps outlined, you’re now equipped to create comprehensive dashboards, set precise alarms, and gain valuable insights through log analysis. Embrace this strategy to proactively manage your cloud environment and maintain the pulse of your infrastructure with confidence.