AWS Cloud Operations Blog
Troubleshoot and resolve Windows workload issues using AWS Systems Manager Fleet Manager
If you’re a cloud operations engineer, you have the financial and operational responsibility to implement a monitoring, tracking, and resolution process to keep a fleet of EC2 instances healthy while staying within budget. In this blog post, I show how you can quickly detect, track, troubleshoot, and resolve operational issues at scale with Amazon CloudWatch, AWS Systems Manager OpsCenter, and Fleet Manager, a new capability in Systems Manager.
Assume that you have a fleet of Amazon Elastic Compute Cloud (Amazon EC2) instances that serve as code repositories to a CI/CD pipeline. This workload uses low-cost burstable performance instance types, such T3 or T4. They provide a baseline level of CPU performance with the ability to burst CPU usage at any time for as long as required.
As the number of globally deployed CI/CD pipeline increases, so does the stress on the supporting EC2 instances. Last year during the weekend deployment of a global multi-platform application, many of the EC2 instances sustained CPU burst usage above the baseline. This resulted in a 25% increase in the costs of running the workload.
Prerequisites
If you want to follow along make sure you have access to the AWS Console with the proper IAM permissions required to create CloudWatch alarms, access Systems Manager Ops Items, Systems Manager Session Manager and the ability to execute CLI commands via AWS Cloudshell. Any EC2 instances should have the proper managed instance profile to allow it to communicate with Systems Manager endpoints.
Monitor an EC2 fleet with CloudWatch alarms
In this post, I walk you through creation of a CloudWatch alarm to monitor the EC2 fleet of burstable instance types and troubleshoot them using Fleet Manager. It’s important to create alarms that are actionable. To track CPU usage above the baseline, you might consider using the CPUUtilization metric. But depending on the size of the instance, the baseline utilization per vCPU varies from 5% to 40%. If you set an arbitrary threshold, you might wind up with too many or too few alerts.
CPUCreditBalance is a better metric for this use case. You can set the alarm to trigger when the CPU credit balance gets close to zero. In this case, if you choose 5 as the threshold, you’ll have some lead time to resolve the issue before the accrual of surplus CPU credit balance begins.
Apply alarms at scale
Ideally, you want to put this alarm on every burstable type EC2 instance launched by using Amazon EventBridge to trigger an AWS Lambda function whenever a RunInstances API call is sent to AWS CloudTrail. The Lambda function calls the put_metric_alarm API action in the AWS SDK for Python (Boto3). For more information, check creating alarms in Amazon CloudWatch in the Boto3 documentation.
For the sake of brevity, I show you how to create the alarm on one instance using the AWS Command Line Interface (AWS CLI). From an authenticated AWS CLI prompt, run the put-metric-alarm command and reference a JSON-formatted input file:
aws cloudwatch put-metric-alarm --cli-input-json file://put_metric_alarm.json
In the JSON file, replace the [ACCOUNT_ID] and [INSTANCE_ID] placeholders with your values:
{
"AlarmName": "[INSTANCE_ID]-BurstableInstanceCPUCreditBalanceLow",
"AlarmDescription": "Burstable instance type cpu credit balance approaching zero",
"ActionsEnabled": true,
"AlarmActions": [
"arn:aws:ssm:us-east-1:[ACCOUNT_ID]:opsitem:2#CATEGORY=Cost"
],
"MetricName": "CPUCreditBalance",
"Namespace": "AWS/EC2",
"Statistic": "Average",
"Dimensions": [
{
"Name": "InstanceId",
"Value": "[INSTANCE_ID]"
}
],
"Period": 300,
"EvaluationPeriods": 1,
"Threshold": 5,
"ComparisonOperator": "LessThanThreshold"
}
Verify that the alarm was created successfully
1. Open the Amazon CloudWatch console, and from the left navigation pane, choose Alarms.
2. Locate and select the alarm named [INSTANCE_ID]-BurstableInstanceCPUCreditBalanceLow.
3. In Actions, confirm that a Systems Manager action is displayed, as shown in Figure 1:
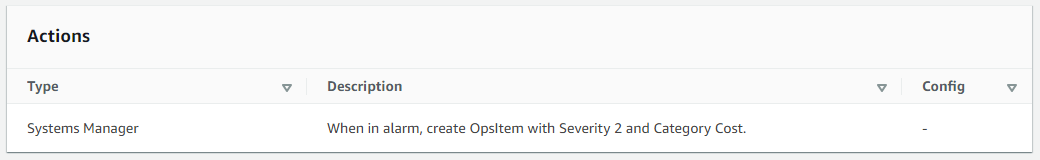
Figure 1. Confirm Systems Manager action
4. After a short period of time, the status of the alarm is OK, as shown in Figure 2:
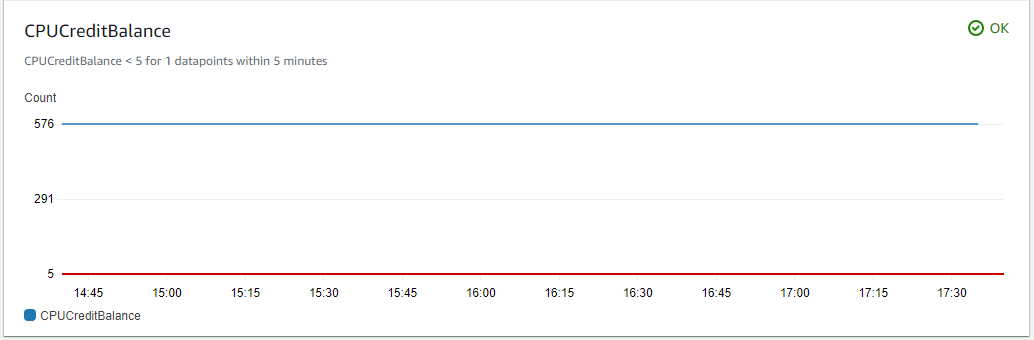
Figure 2. CPUCreditBalance alarm in OK status
Track OpsItems using Systems Manager OpsCenter
When it’s triggered, the CloudWatch alarm you created creates an OpsItem with a status of Open that should be reviewed and resolved by an operations engineer. For more information, see working with OpsItems in the AWS Systems Manager User Guide.
Trigger the alarm through simulated stress on the workload
In this scenario, a PowerShell script has been running for several hours and has exhausted the CPU credit balance below the threshold, which triggers the alarm. Figure 3 shows an OpsItem with a status of Open has been created.
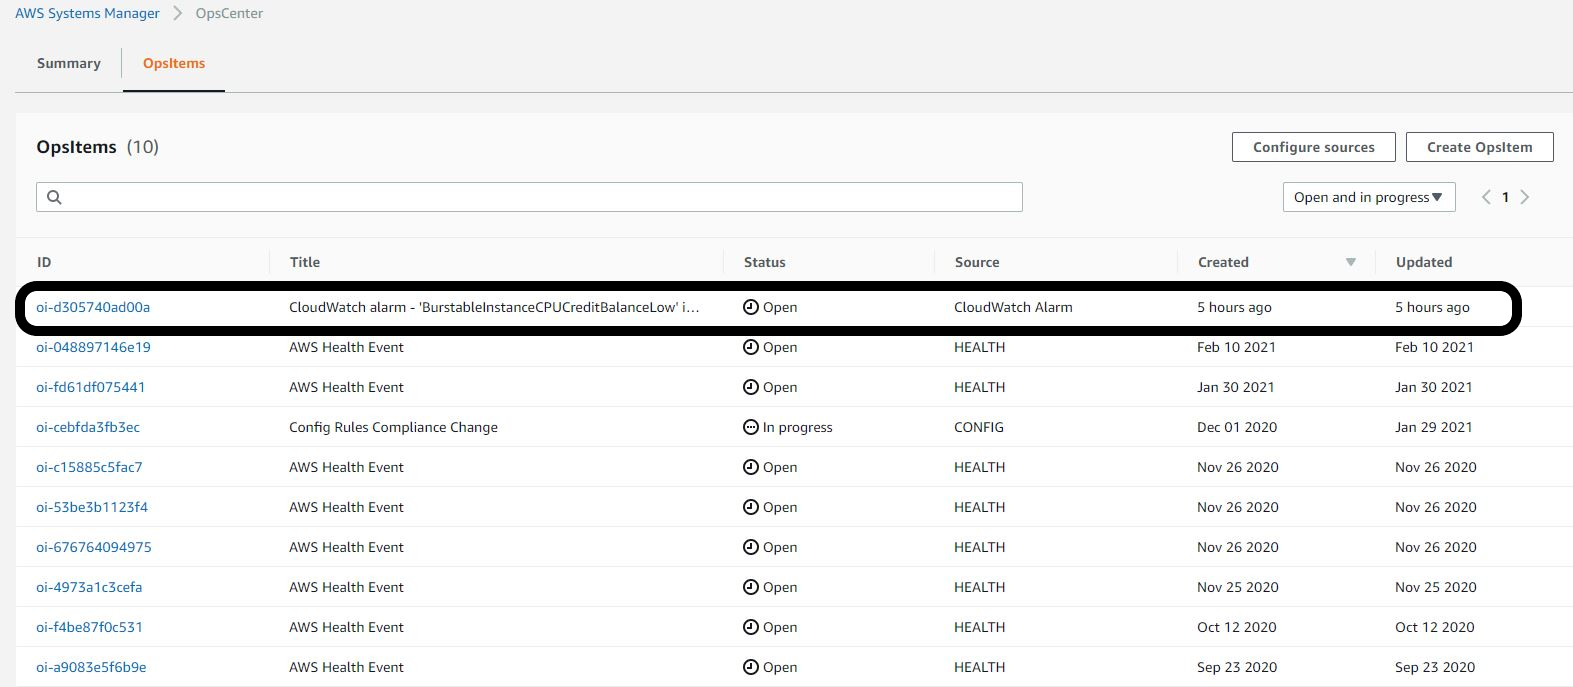
Figure 3: Alarm triggered the creation of an OpsItem
Troubleshoot and resolve issues using Fleet Manager
Fleet Manager enables systems administrators to view and administer their fleets of managed instances from a single location, in an operating system-agnostic manner, without needing to resort to remote connections with SSH or RDP. You can use file system, Windows registry, performance counters, and Session Manager to troubleshoot and resolve problems that occur on EC2 or on-premises managed instances.
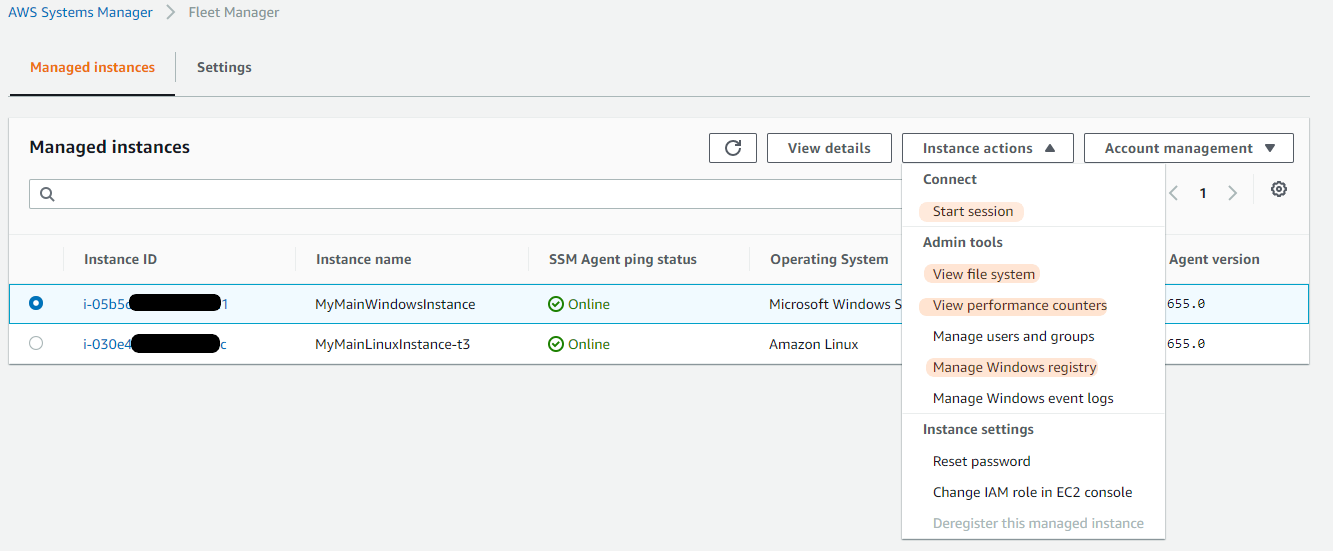
Figure 4. Fleet Manager instance actions for Windows
On the Managed instances page, from instance actions, select view performance counters. You get a live view of the last minute’s worth of data for metrics such as CPU utilization, disk I/O, network traffic, and memory usage. Figure 5 shows that CPU utilization is still high, so you will need to continue troubleshooting the cause.
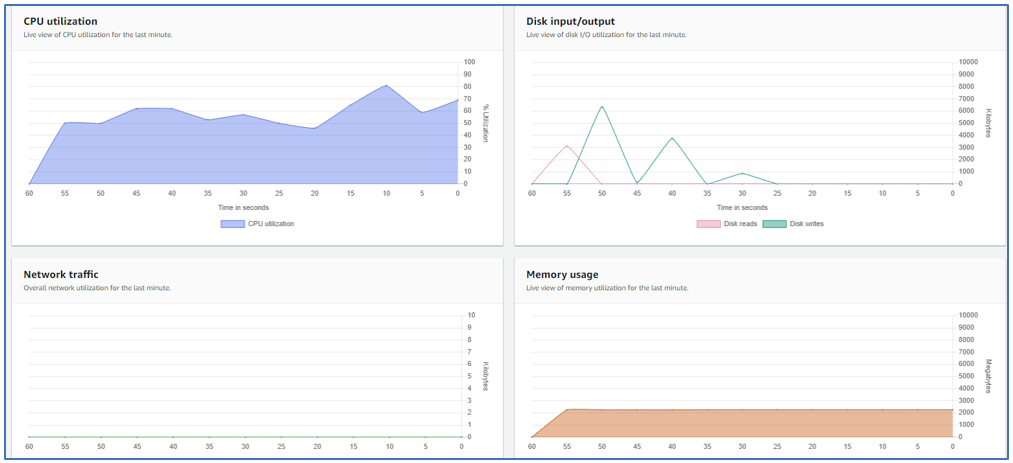
Figure 5. Performance counters show various real-time metrics
As part of troubleshooting, you can browse file system objects and view their properties (for example, date modified, type, permissions mode, and size). You can view or tail up to 10,000 lines of a file’s content.
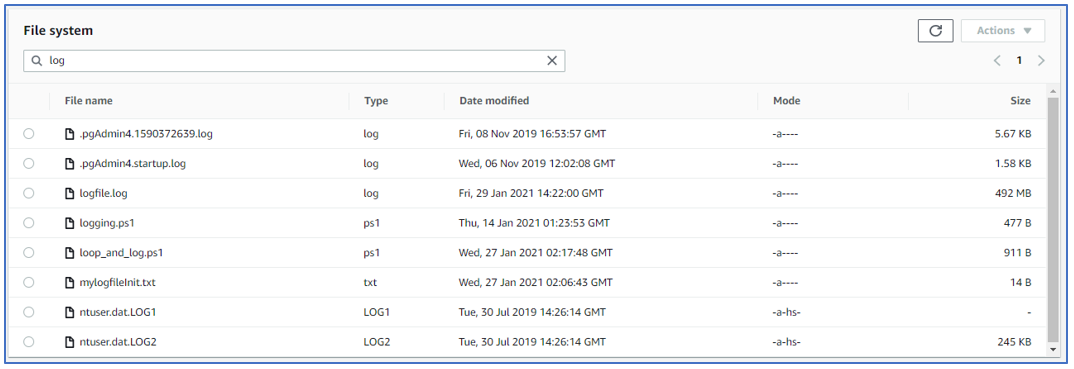
Figure 6: Browse the file system and view file properties
Fleet Manager can initiate a PowerShell session without the need to open RDP ports or use a bastion host. This is a great way to run commands that allow you to get more information about the cause of the excessive CPU usage.
To start a new PowerShell session on the instance, from Instance actions, choose Start session. Fleet Manager calls Systems Manager Session Manager to connect to the server.
You are now ready to run PowerShell commands that will help you narrow down the cause of the high CPU load. When you use Session Manager, the session data is encrypted using AWS Key Management Service (AWS KMS), as shown at the top of Figure 7.
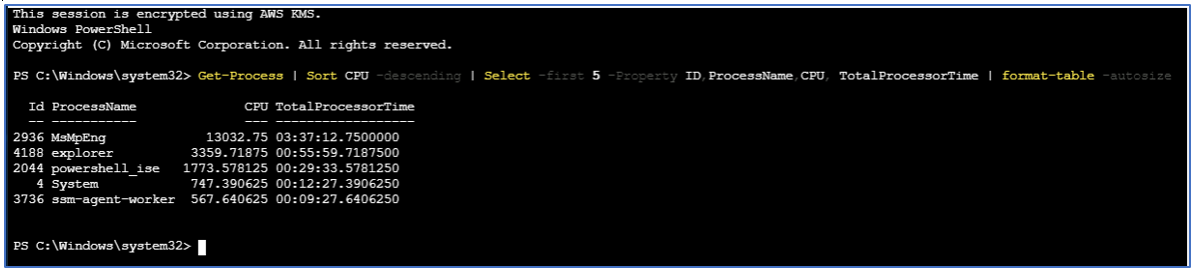
Figure 7. Run PowerShell commands from Session Manager
When you look at the list the top five processes that are consuming the most CPU time, the process with an ID of 2044 stands out. It’s a PowerShell process that has consumed one half hour of the CPU’s time. Run PowerShell commands to interactively join the existing session associated with process ID 2044 and use debug mode to discover the full path to running script as shown in figure 8.
![Output of PowerShell commands, Enter-PSHostProcess, Get-Runspace, and Debug-Runspace, displays the name and location of the script consuming much of the CPU.]](https://d2908q01vomqb2.cloudfront.net/972a67c48192728a34979d9a35164c1295401b71/2021/03/20/Figure8.png)
Figure 8. Executed PowerShell commands return the full path to the offending script.
You can then use Fleet Manager functionality to preview the content of the script file, as shown in Figure 9.
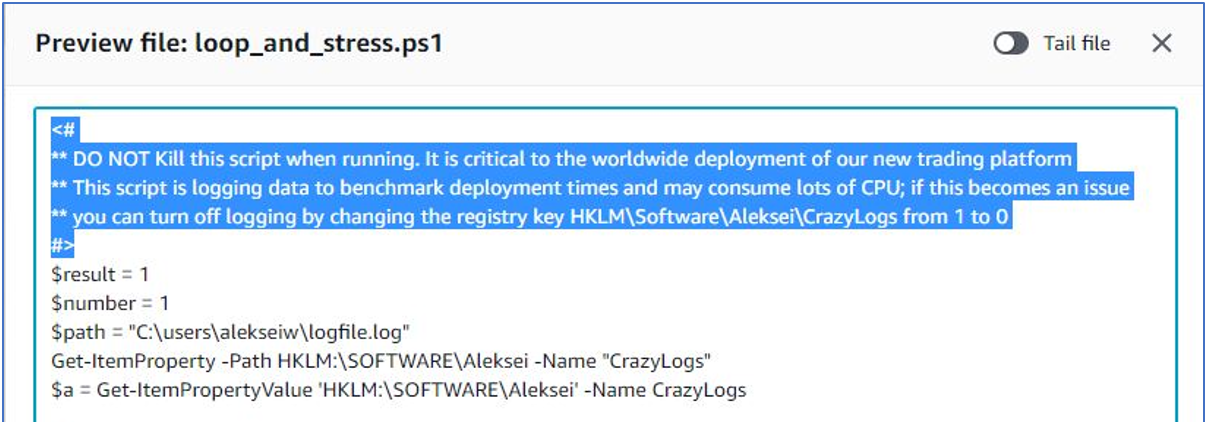
Figure 9. Use Fleet Manager to preview up to 10,000 lines of a file.
The script author has provided useful information in the comments section that will help you resolve this issue.You can turn off the excessive logging that is causing the high CPU consumption by changing a Windows registry key. Although you can change the registry key’s value directly in Fleet Manager (see Figure 10), it’s better to target the entire fleet of EC2 instances that power the CI/CD workload.
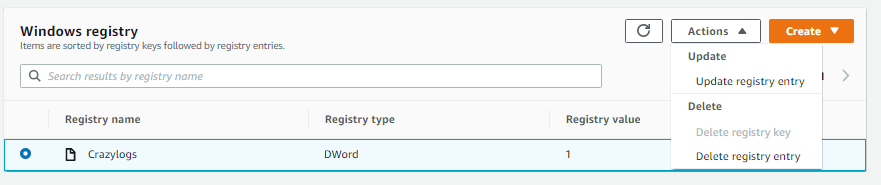
Figure 10. Update registry entry functionality of Fleet Manager actions
By using an AWS Systems Manager Run Command that targets multiple instances, you can safely update this registry key at scale on a large number of EC2 or on-premises instances. You can set rate controls for concurrency and error thresholds to manage how many simultaneous instances the command runs on in addition to a limit on the number of failed executions before the system stops sending commands to additional instances.
Start Run Command
1. Open the AWS Systems Manager console, and from the left navigation pane, choose Documents.
2. In the search field, add filters for Document type: Command and Search: SetWindows.
The AWSFleetManager-SetWindowsRegistryValue document appears in the results, as shown in Figure 11.
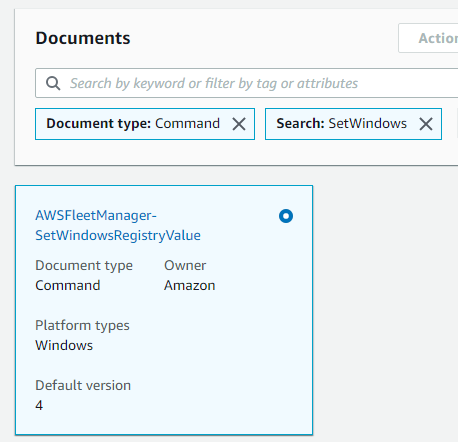
Figure 11. SSM document to set Windows registry values
3. In Command parameters, enter the values shown in Figure 12.
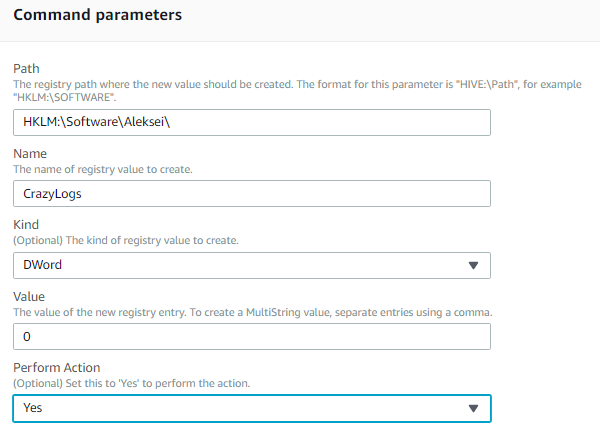
Figure 12. SetWindowsRegistry Run Command parameters.
In this scenario, all instances in the CI/CD code repository have been conveniently tagged with a tag key and value pair of code-repo and true.
4. To target just those instances, in Targets, choose Specify instance tags, as shown in Figure 13. You can also choose instances individually or specify a predefined resource group.
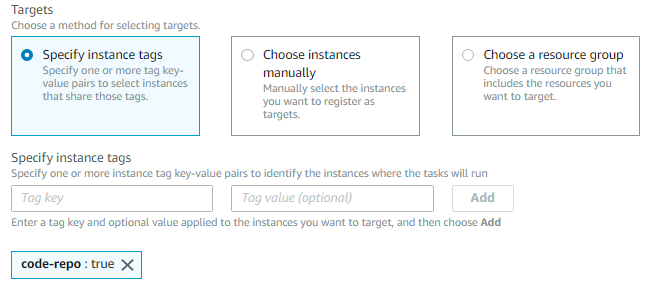
Figure 13. Choose targets by specifying instance tags
It takes a few seconds to run the document and change the registry key to turn off the logging. Figure 14 shows a sharp decrease in the CPU utilization performance counter.
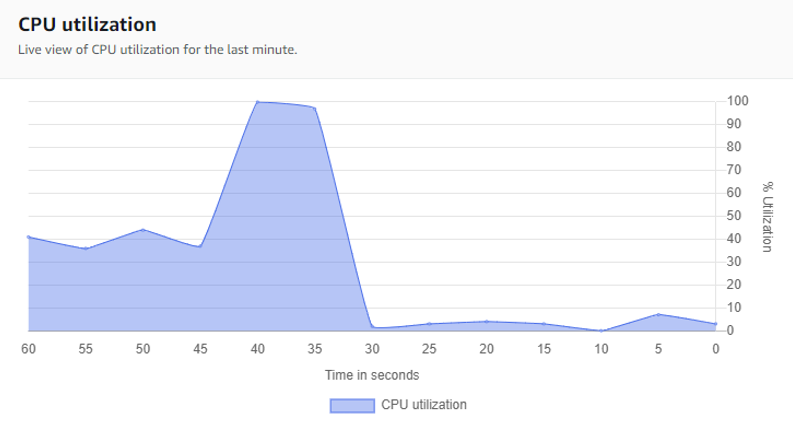
Figure 14. CPU utilization returns to normal.
Now that the issue has been resolved, a best practice would be to go back into the OpsItem that was created by the CloudWatch alarm and from the Set status menu on the upper right hand corner, choose Resolved.
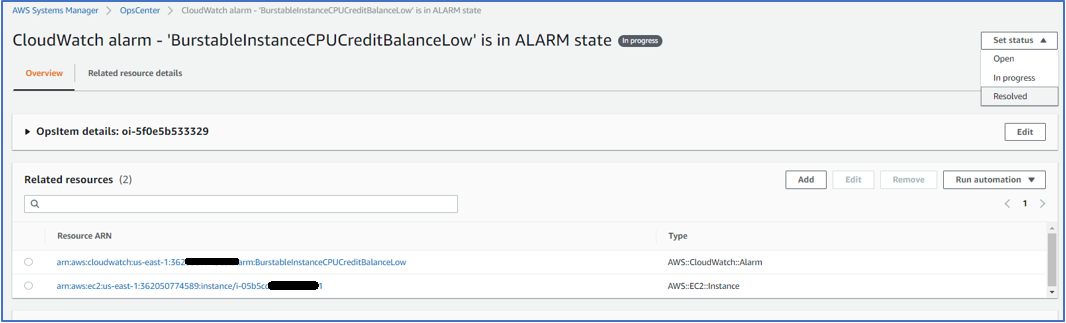
Figure 15. Change the OpsItem status from in progress to resolved.
Cleaning up
If you followed along with the steps in this blog please make sure to terminate any EC2 instances and CloudWatch alarms you created so as not to incur unwanted charges.
Conclusion
In this blog post, I showed how you can use Fleet Manager, Session Manager, OpsCenter, and CloudWatch alarms to quickly detect, track, troubleshoot, and resolve operational issues. You created an alarm that when triggered created an OpsItem, which is helpful for keeping track of issues that need to be resolved. You also learned how to launch a PowerShell session to run commands that help isolate a problem without the need to open RDP ports or use bastion hosts. Lastly, you learned how to run routine administrative tasks such as setting a Windows registry key at scale across large fleets.
About the Author

Aleksei (Alex) Wolff is a Senior Technical Account Manager for AWS Enterprise Support. He has been working with AWS technology for since 2016. Alex works with Enterprise customers to design, implement and support complex cloud infrastructures. Alex lives in Greensboro, North Carolina with his wife and two kids. When not obsessing over customers Alex spends his free time road cycling.