AWS Cloud Operations Blog
Using CloudTrail data events with Athena and CloudWatch to create an audit trail for DynamoDB tables events
Highly regulated industries must maintain an audit trail of events at various levels to meet regulatory and industry compliance requirements. Data events provide visibility into the resource operations performed on or in a resource, including object-level API activities such as delete, update, and put items. You can use AWS CloudTrail to create an audit trail for events that take place inside an Amazon DynamoDB table.
According to the AWS CloudTrail best practices, you should record data events for security-sensitive workloads at a multi-region trail level. For workloads with intensive compliance requirements, we recommend that you enable S3 data events to audit access to production files.. This is particularly important when there is a need to audit privileged access to data stored in S3. Logging data events provides the ability to audit at the data level, including changes inside the resource you are enabling visibility.
By default, CloudTrail logs data events from user actions, services activities, and API calls. It provides events history of your AWS account:
- In a secure way: using industry standard algorithms: SHA-256 for hashing and SHA-256 with RSA for digital signing.
- Enabling governance: by centralizing all API logs in one place, and validating its integrity by identifying if a log file has been deleted or changed.
- Compliance, operational auditing, and risk auditing: since all logs can be further used for forensics inspections.
For example, you can choose to log all the API activities of data events in DynamoDB tables, Amazon Simple Storage Service (Amazon S3) buckets, AWS Lambda, and Amazon Managed Blockchain. When creating a trail all logs are delivered to an S3 bucket by default, and additionally can be also delivered to Amazon CloudWatch Logs. This integration with CloudWatch allows you to query, view, or provide alerts based on logged actions for more stringent business needs, such as an alert for security group modifications. For more information, see Monitoring CloudTrail log files with Amazon CloudWatch Logs.
You can use advanced event selectors for granular control of logging (for example, to log all events, read-only events, write-only events, or custom events). The advanced log selector lets you customize the selector name, log or exclude events from specific resources, objects, users, or roles.
In this blog post, we will share practices to maintain track of captured events at the data plane layer by AWS CloudTrail, and demonstrate how to use the data events with Amazon Athena and Amazon CloudWatch to analyze activity from Amazon DynamoDB, such as:
- A Multi-Region visualization of all Amazon DynamoDB logs with Amazon Cloud Watch
- Using Amazon Cloud Watch Log to query the logs for identifying actions by user
- Using Amazon Athena for a more granular log analysis
As a requirement to get started, use the information in the Amazon DynamoDB now supports audit logging and monitoring using AWS CloudTrail blog post.
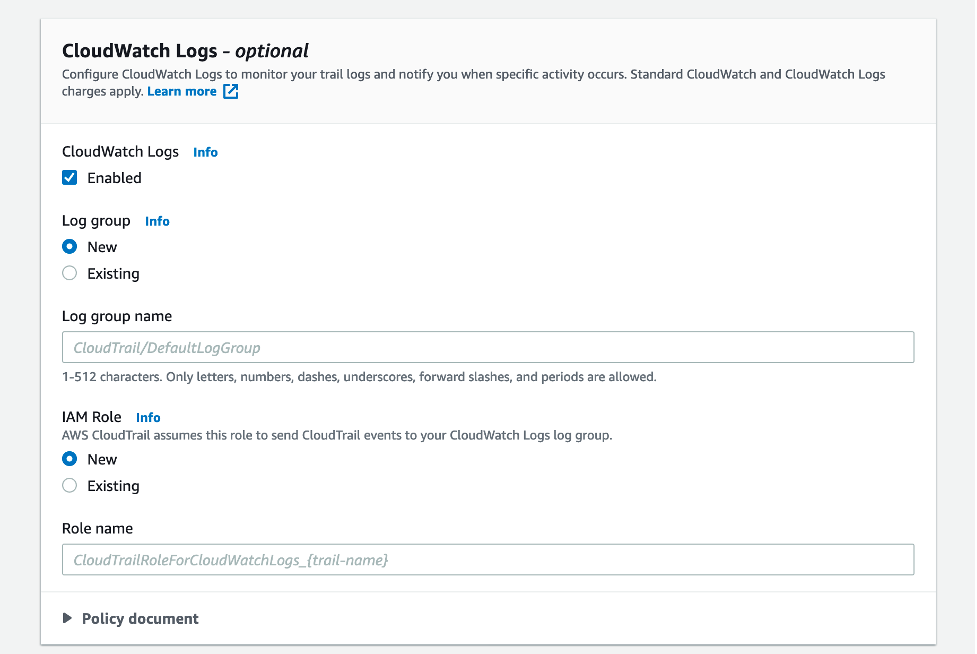
Figure 1: Enable CloudWatch Logs
Multi-Region visualization
When enabled, this feature delivers all events to the same S3 bucket, separated by Region and table, creating a centralized bucket for all logs, which helps creating a centralized management rules for the content. The multi-region visualization helps the responsible team to have a centralized view of the content, in order to have a single view to maintain compliance from the data logs. The following example is a query in CloudWatch Logs Insights that shows the count of each event (such as DeleteItem, BatchWrite, Query, and Scan) in an account’s DynamoDB tables, per Region, for the past 45 minutes.
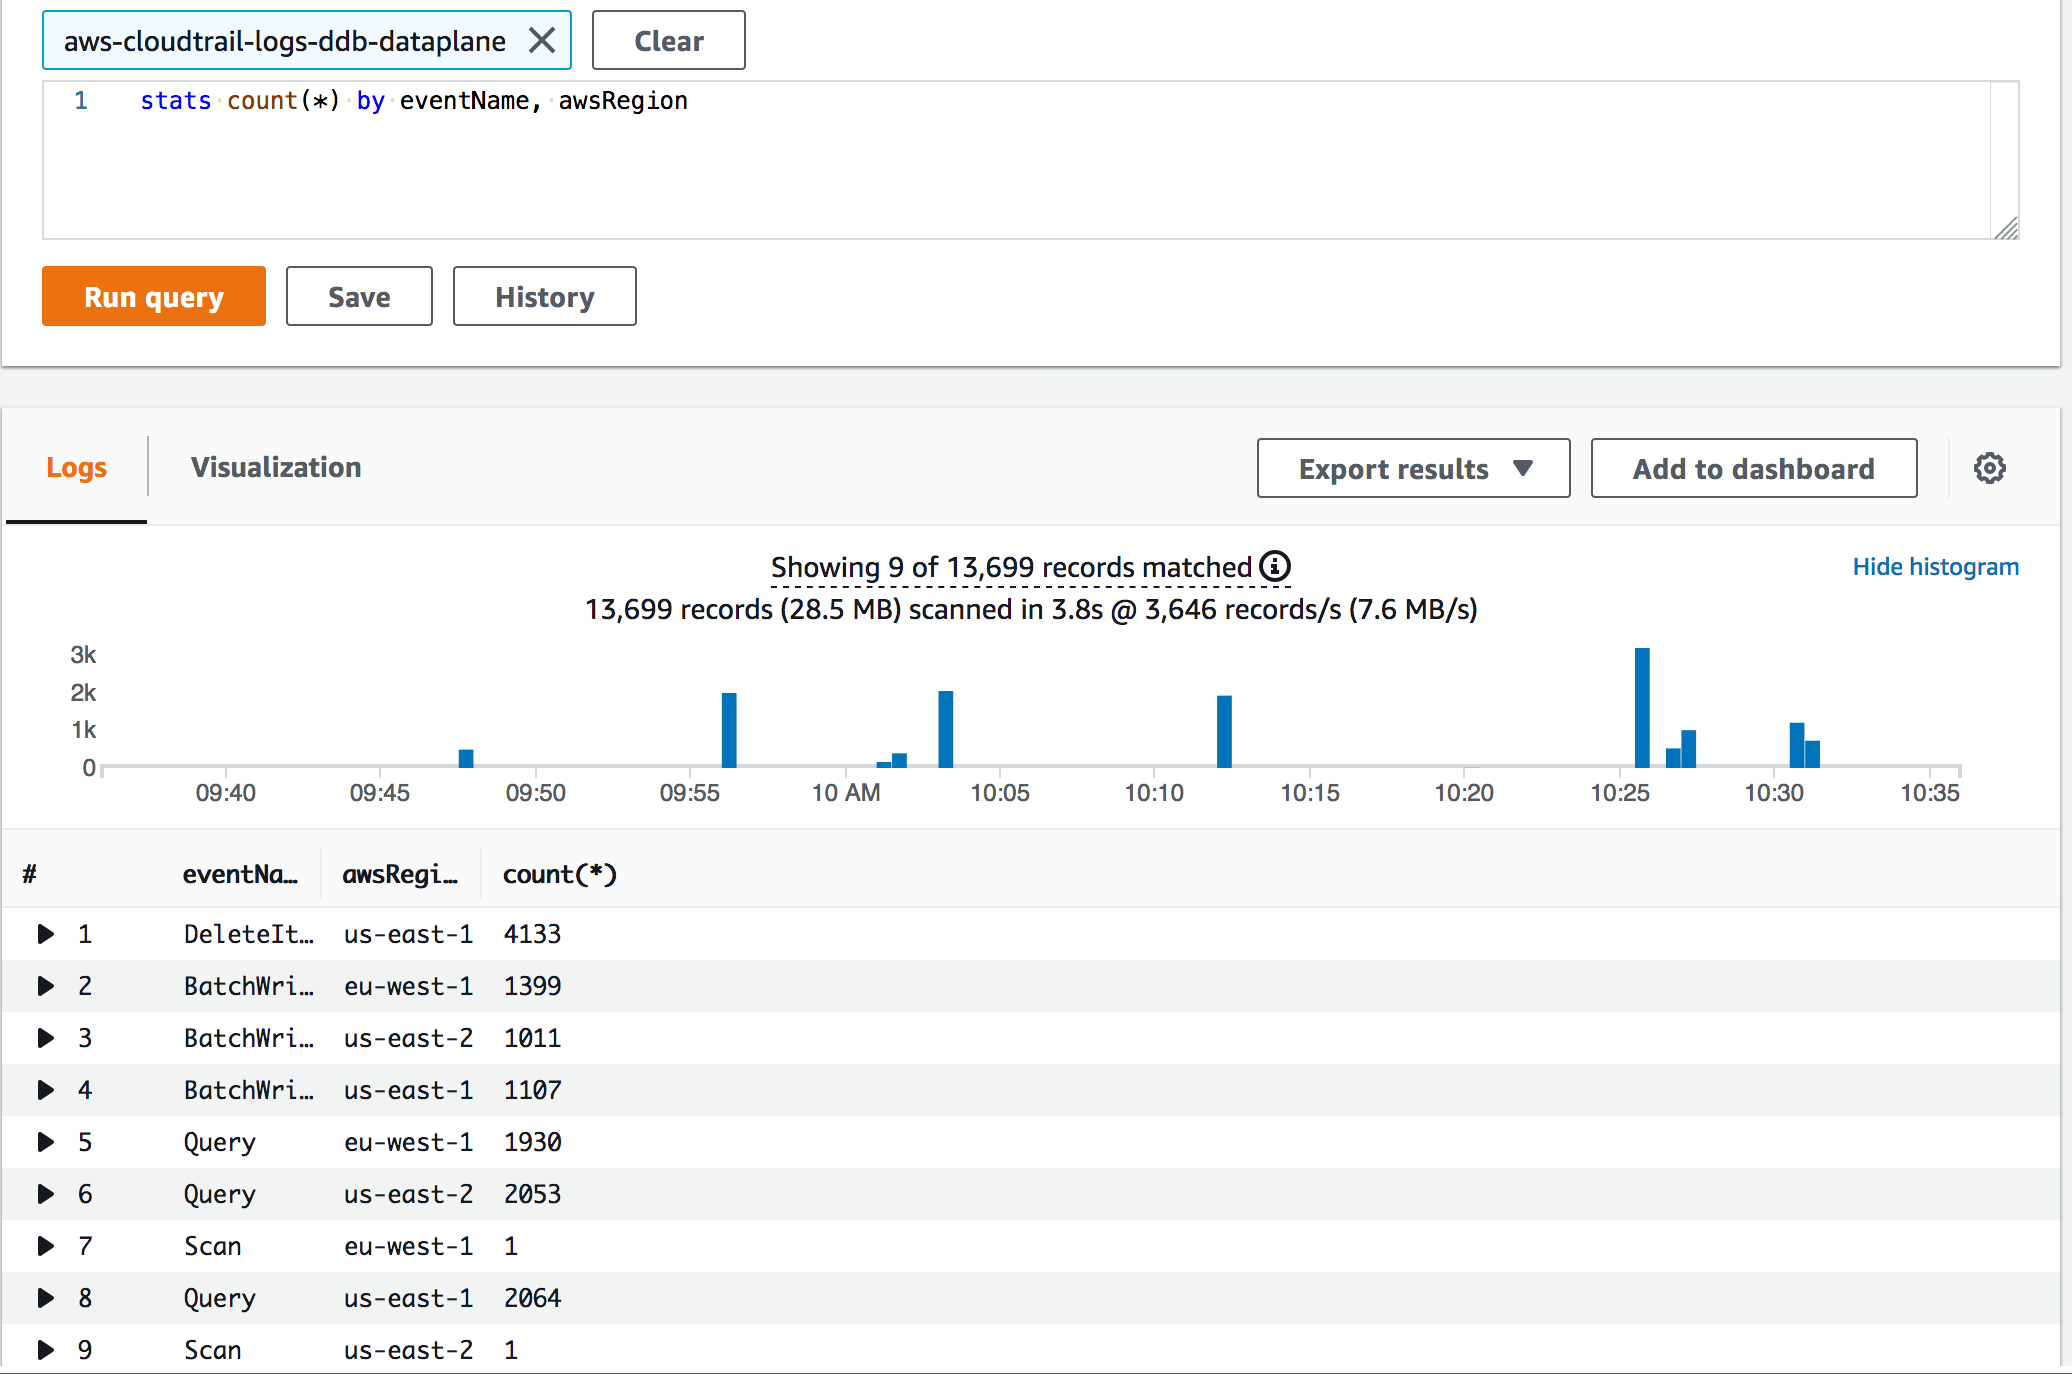
Figure 2: CloudWatch Logs Insights query
Figure 3 shows a visualization of the query results.
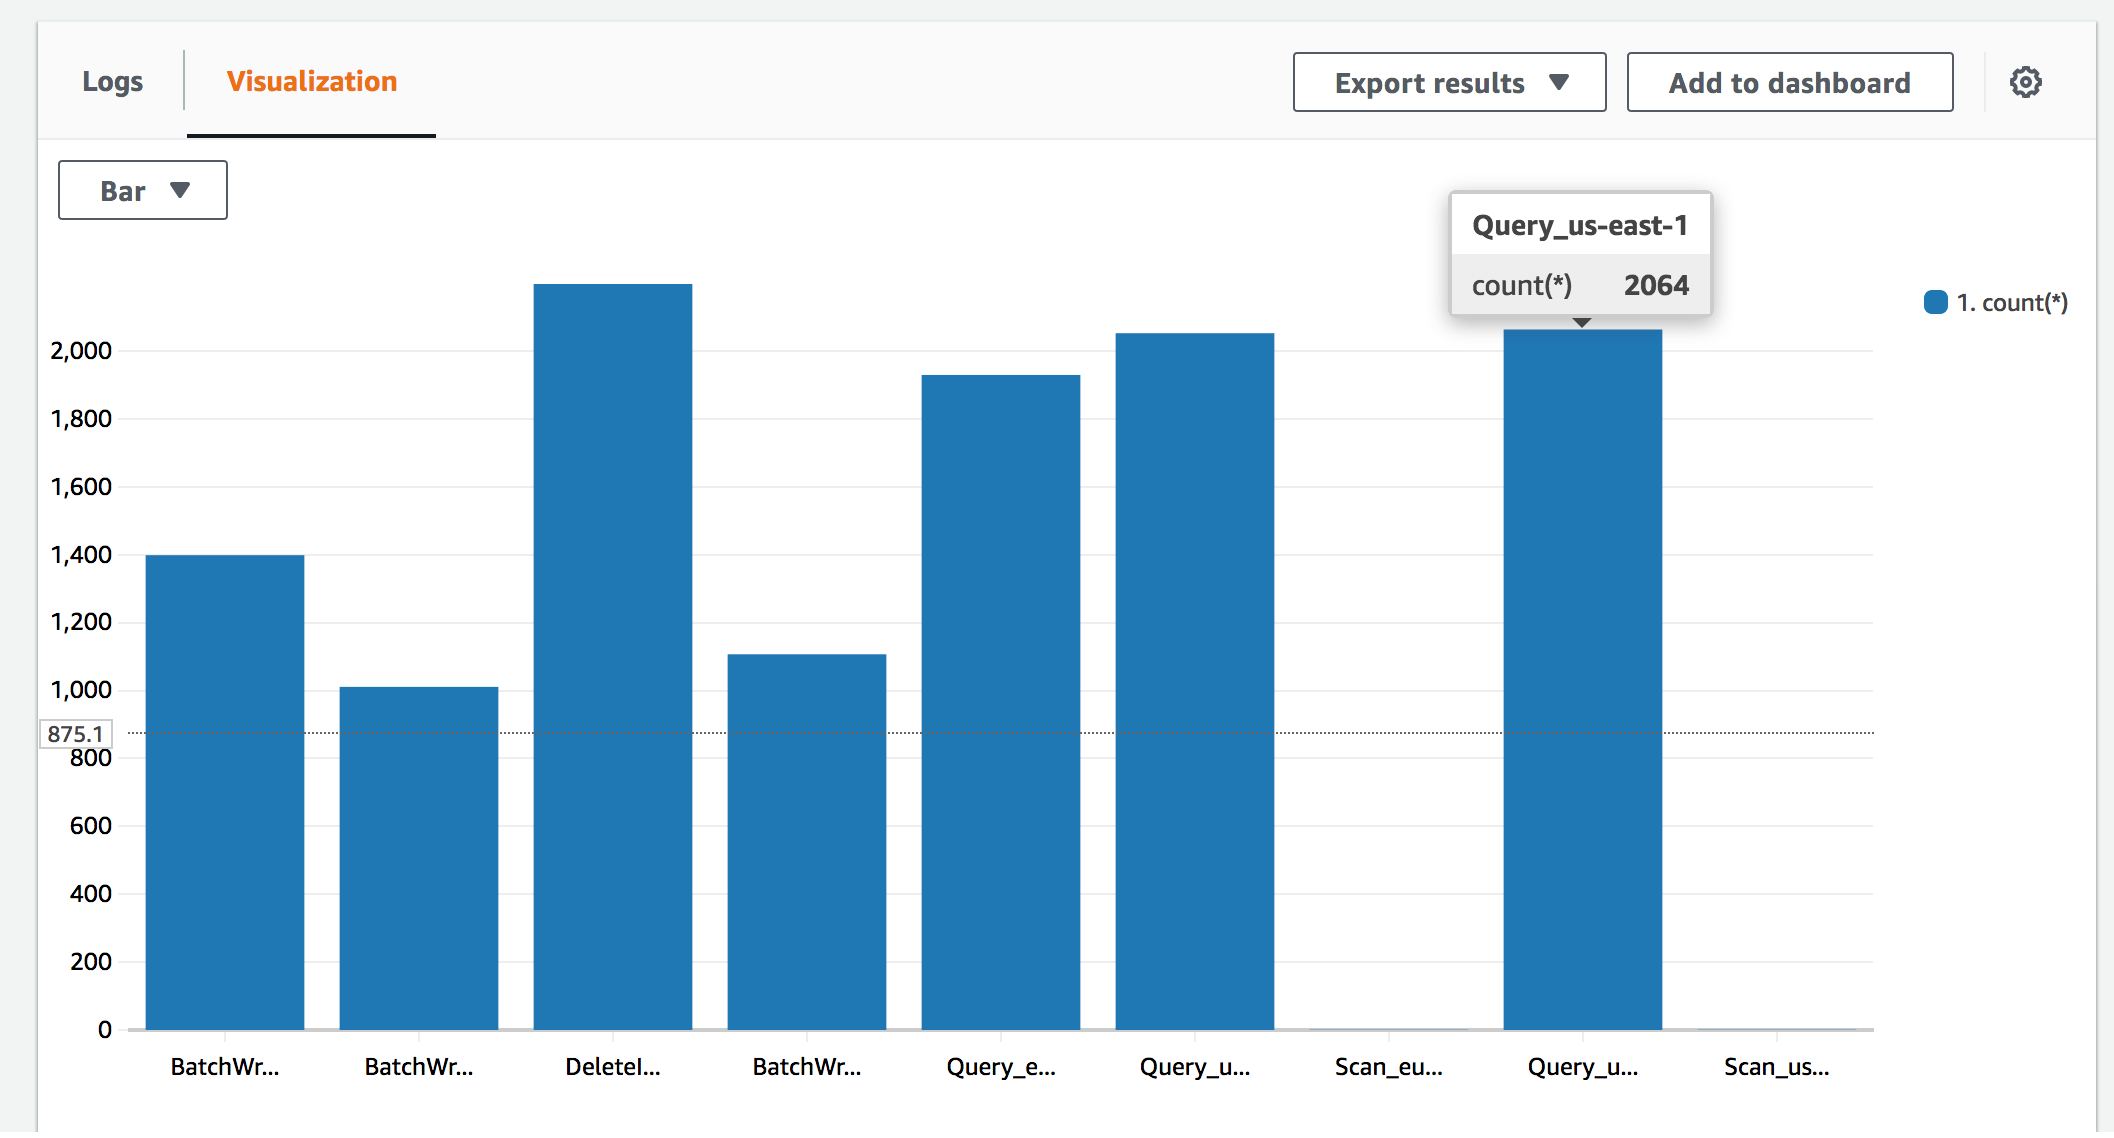
Figure 3: Visualization tab
Following the AWS multi-account best practices, the bucket that contains the audit logs should be created using an account dedicated for logs and auditing.
Identifying the user agent by events
For example, In a scenario where we need to identify the actions of a user inside the AWS Dynamo DB table, we can identify the user, who deleted items by selecting the DeleteItem with a specific date and time. The result shows which user took the delete action.
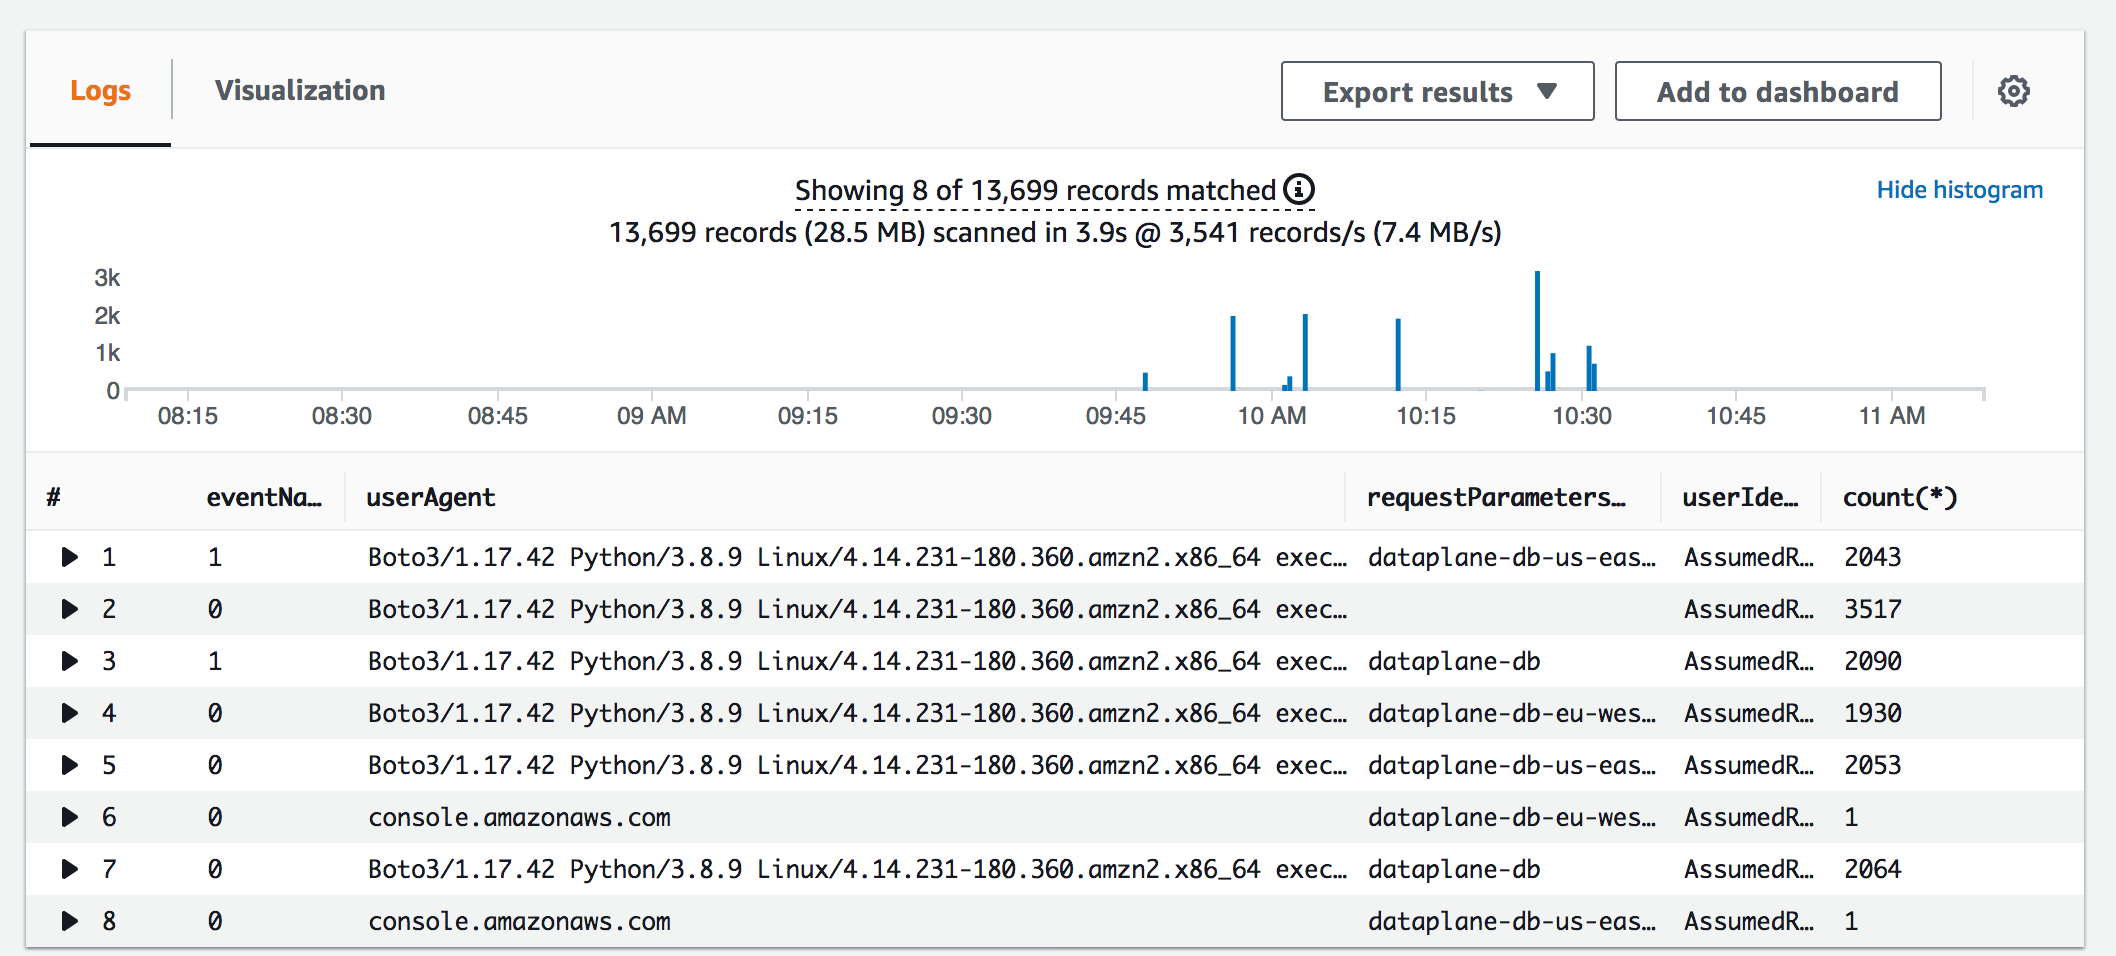
Figure 4: Logs tab
Use Amazon Athena for more granular analysis
Amazon Athena is an interactive query service that you can use to analyze data in Amazon S3 using SQL statements. To create a table in Amazon Athena based on your CloudTrail trail, open the AWS CloudTrail console. From the left navigation pane, choose Event history, and then choose Create Athena table.
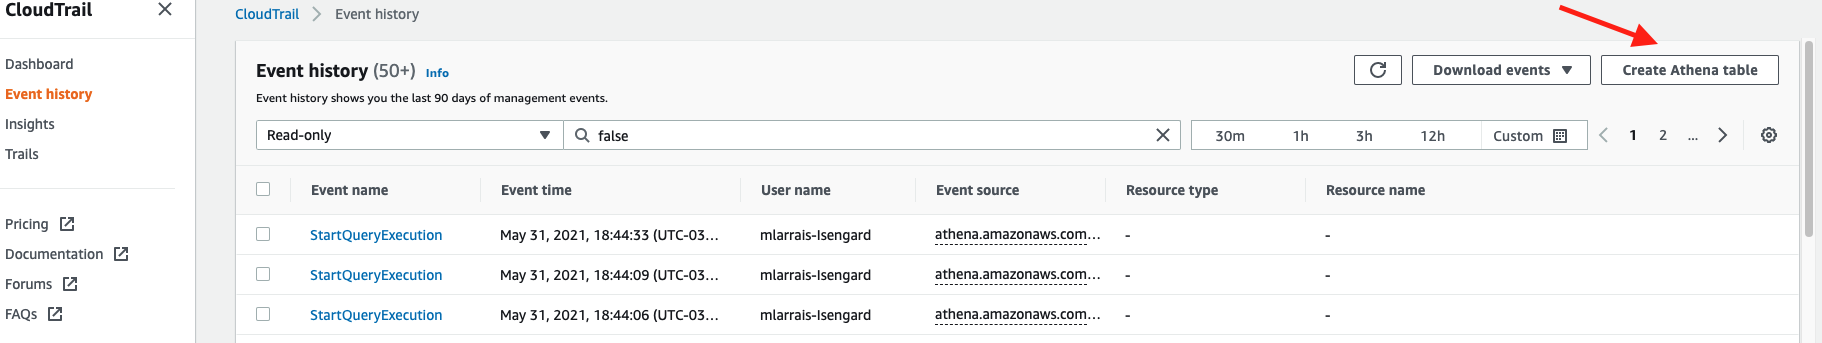
Figure 5: Event history
Enter a name and storage location for the table and then enter the SQL query. For more information, see Querying AWS CloudTrail Logs.
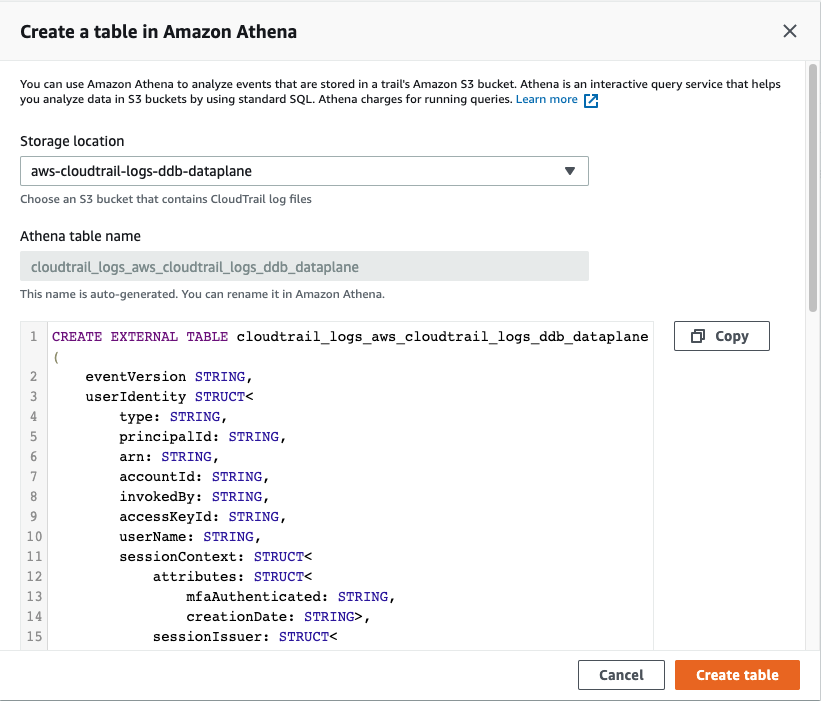
Figure 6: CREATE EXTERNAL TABLE
After the table is created, Amazon Athena allows you to query the user and event with more specificity, including range of time. This added flexibility can be used to troubleshoot issues that affect specific databases or tables. For example, the following query will return users or roles who performed the write operation between May 1 and May 31.
In this query, you can identify which user is making unauthorized requests to your DynamoDB tables.
Compliance standards like GDPR and PCI DSS have explicit requirements for capturing data-level logging and auditing. In PCI DSS 10.2.1 and 10.2.3, there is a requirement that audit trails reconstruct all individual user accesses to cardholder data.
The following query can help identify data events compliance and collect evidence for auditing:
Conclusion
The data events logging provided by CloudTrail will collect event details about items, actions, and authors, creating a centralized and secure place for all logs collected. When you use CloudWatch and Amazon Athena, you can gather evidence of each action collected to meet compliance and auditing requirements, such as identifying a user action for forensics inspections. By creating a centralized visualization for the responsible team it helps deliver greater value throughout the data analysis inputs.
For more information, see Logging DynamoDB Operations by Using AWS CloudTrail.