AWS Cloud Operations Blog
Using Curated Packages and AWS managed Open Source services to observe your On Premises Kubernetes environment
Customers who run containerized workloads on Kubernetes clusters on their hardware use Amazon EKS Anywhere (Amazon EKS-A). Customers look for prescriptive guidance for the observability of their modern applications running on EKS-A. Using AWS-managed open-source services such as AWS Distro for OpenTelemetry (ADOT), Amazon Managed Service for Prometheus, and Amazon Managed Grafana helps customers to offload the operational burden of managing the infrastructure of observability tooling.
Amazon EKS-A curated packages are trusted, up-to-date, and compatible software supported by Amazon to extend your EKS-A cluster’s functionality while reducing the need for multiple vendor support agreements. ADOT now supports EKS-A curated package which is an OpenTelemetry collector providing a vendor-agnostic solution to receive, process, and export telemetry data. It removes the need to run, operate, and maintain multiple agents/collectors. ADOT Collector is an AWS-supported distribution of the OpenTelemetry Collector. OpenTelemetry collector provides a vendor-agnostic solution to receive, process, and export telemetry data. It removes the need to run, operate, and maintain multiple agents/collectors. ADOT Collector is an AWS-supported distribution of the OpenTelemetry Collector.
The grafana-operator is a Kubernetes operator built to help you manage your Grafana instances inside Kubernetes. Grafana Operator allows you to manage and create Grafana dashboards, data sources, etc., declaratively between multiple instances easily and scalable. The Grafana operator now supports managing resources such as dashboards, data sources, etc., hosted on external environments like Amazon Managed Grafana. GitOps manages application and infrastructure deployment so that the system is described declaratively in a Git repository. It is an operational model that allows you to manage the state of multiple Kubernetes clusters by leveraging the best practices of version control, immutable artifacts, and automation. Flux is a GitOps tool that automates the deployment of applications on Kubernetes. It works by continuously monitoring the state of a Git repository and applying any changes to a cluster. So Grafana Operator ultimately enables us to use GitOps mechanisms using CNCF projects such as Flux to create and manage the lifecycle of resources in Amazon Managed Grafana from Amazon EKS-A cluster.
In this post, we will show you how to use ADOT EKS-A curated package, AWS managed open source services and Grafana-operator to observe your on-premises Kubernetes cluster.
Solution Overview
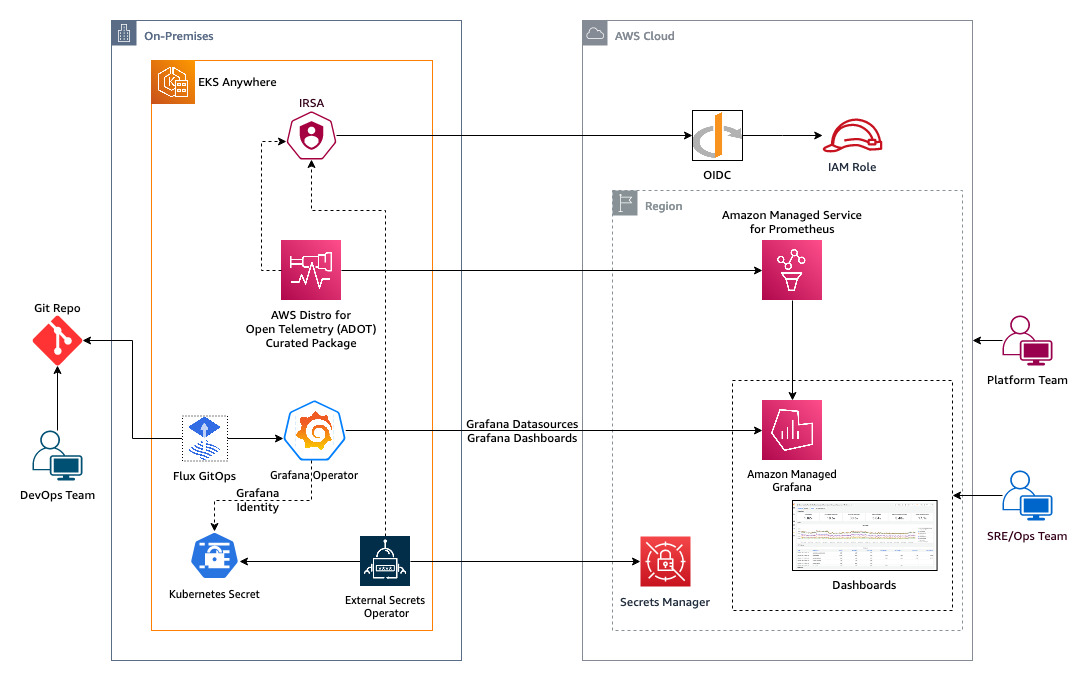
Solution Walkthrough
In this solution, we start with using ADOT EKS-A curated package to remote write Prometheus-compatible metrics from your EKS-A cluster to Amazon Managed Service for Prometheus. We will then use GitOps mechanisms with Flux and Grafana Operator from your EKS-A cluster to create and manage Grafana resources such as dashboards, data sources, etc., hosted on external environments like Amazon Managed Grafana to visualize metrics from your on-premises Kubernetes cluster.
Prerequisites
Ensure the following prerequisites are complete:
- A Linux-based host machine using Amazon EC2 instance, Cloud9 instance, or a local machine with access to your AWS account.
- Ensure your AWS account has access to EKS Anywhere curated packages. If not, please follow EKS Anywhere curated package management to get a subscription.
- Configure admin access to EKS Anywhere cluster from the host machine.
- Configure IAM Roles for Service Account (IRSA) on EKS Anywhere cluster.
- An existing Amazon Managed Grafana Workspacein your AWS account.
- Install the following tools on the host machine:
- AWS CLI version 2 to interact with AWS services using CLI commands.
- Helm to deploy and manage Kubernetes applications
- kubectl to communicate with the Kubernetes API server
- eksctl and eksctl anywhere to create and manage EKS Anywhere cluster
- Git to clone the required source repository from GitHub
- curl to make HTTP requests
- envsubst to substitute environment variables in shell
Setup Environment
Set the following environment variables:
export EKSA_ACCOUNT_ID=$(aws sts get-caller-identity --query 'Account' --output text)
export EKSA_REGION="us-east-2"
export EKSA_CLUSTER_NAME="sample-cluster" # EKS Anywhere cluster name
export KUBECONFIG="./sample-cluster/sample-cluster-eks-a-cluster.kubeconfig" # absolute path of EKS Anywhere cluster kubeconfig file
export EKSA_OIDC_PROVIDER=<value of $ISSUER_HOSTPATH as configured in IRSA setup>
export EKSA_ADOT_NAMESPACE="observability"
export EKSA_ADOT_SERVICE_ACCOUNT="curated-adot-sa"
export EKSA_ES_SERVICE_ACCOUNT="external-secrets-sa"
export EKSA_AMP_WORKSPACE_ALIAS=${EKSA_CLUSTER_NAME}-AMP-workspace
export EKSA_AMG_WORKSPACE_NAME="amp-adot-grafana" # replace with name of your desired AMG workspace
export GO_API_KEY_SECRET_NAME="/eksa/amg-api-key"
Ensure pod-identity-webhook is deployed in observability namespace at which ADOT will be deployed. If not, follow IAM Roles for Service Accounts configuration steps to deploy the same.
Setting up Amazon Managed Service for Prometheus
Here, we will deploy a curated ADOT package with a configuration to write metrics to Amazon Managed Service for Prometheus (AMP). Start with creating Amazon Managed Service for Prometheus workspace, using the command:
aws amp create-workspace \
    --region ${EKSA_REGION} \
    --alias ${EKSA_AMP_WORKSPACE_ALIAS}
Set the following environment variables with values from Amazon Managed Service for Prometheus workspace created:
export EKSA_AMP_WORKSPACE_ID=$(aws amp list-workspaces \
    --region=${EKSA_REGION} \
    --alias ${EKSA_AMP_WORKSPACE_ALIAS} \
    --query 'workspaces[0].[workspaceId]' \
    --output text)

export EKSA_AMP_WORKSPACE_ARN=$(aws amp list-workspaces \
    --region=${EKSA_REGION} \
    --alias ${EKSA_AMP_WORKSPACE_ALIAS} \
    --region=${EKSA_REGION} \
    --query 'workspaces[0].[arn]' \
    --output text)

export EKSA_AMP_ENDPOINT_URL=$(aws amp describe-workspace \
    --region=${EKSA_REGION} \
    --workspace-id ${EKSA_AMP_WORKSPACE_ID} \
    --query workspace.prometheusEndpoint \
    --output text)

export EKSA_AMP_REMOTEWRITE_URL=${EKSA_AMP_ENDPOINT_URL}api/v1/remote_write
Then, run the steps to create an IAM role that grants fine-grained permission to AMP workspace with the OIDC provider as a trusted entity to assume this role.
# create a trust policy for the IAM role
curl -s https://raw.githubusercontent.com/aws-samples/containers-blog-maelstrom/main/eksa-adot-cp/templates/irsa-trust-policy-template.json \
    | envsubst > ./irsa-trust-policy.json

# create a permission policy for the IAM role
curl -s https://raw.githubusercontent.com/aws-samples/containers-blog-maelstrom/main/eksa-adot-cp/templates/amp-irsa-perm-policy-template.json \
    | envsubst > ./amp-irsa-perm-policy.json

# create an IAM role
existingRole=$(aws iam list-roles --query "Roles[?RoleName=='${EKSA_ADOT_SERVICE_ACCOUNT}-role'].RoleName" --output text)
if [ -z ${existingRole} ]; then
    aws iam create-role --role-name ${EKSA_ADOT_SERVICE_ACCOUNT}-role \
        --assume-role-policy-document file://irsa-trust-policy.json \
        --query Role.Arn --output text

    aws iam put-role-policy --role-name ${EKSA_ADOT_SERVICE_ACCOUNT}-role \
        --policy-name IRSA-AMP-PermissionPolicy \
        --policy-document file://amp-irsa-perm-policy.json
fi

export IRSA_ROLEARN=$(aws iam list-roles --query "Roles[?RoleName=='${EKSA_ADOT_SERVICE_ACCOUNT}-role'].Arn" --output text)
Deploy AWS Distro for OpenTelemetry (ADOT) curated package for EKS Anywhere
Create a service account for ADOT in EKS Anywhere cluster.
kubectl create namespace $EKSA_ADOT_NAMESPACE

curl -s https://raw.githubusercontent.com/aws-samples/containers-blog-maelstrom/main/eksa-adot-cp/templates/eksa-adot-sa-template.yaml \
    | envsubst > ./eksa-adot-sa.yaml
kubectl apply -f ./eksa-adot-sa.yaml
The pod-identity-webhook deployment in observability namespace should be complete before proceeding to the next step.
Create an ADOT package configuration file with AMP. See the ADOT configuration for more details.
curl -s https://raw.githubusercontent.com/aws-samples/containers-blog-maelstrom/main/eksa-adot-cp/templates/amp-adot-package-template.yaml \
    | envsubst > ./amp-adot-package.yaml
eksctl anywhere create packages -f ./amp-adot-package.yaml
Validate installation using the command.
eksctl anywhere get packages --cluster $EKSA_CLUSTER_NAME

NAME                               PACKAGE                            AGE     STATE       CURRENT VERSION                                               TARGETVERSION                                                         DETAIL
curated-amp-adot                   adot                               5d10h   installed   0.25.0-ec883752f028661cbb3bda6083a77263226dca5a              0.25.0-ec883752f028661cbb3bda6083a77263226dca5a (latest)
Installing External Secrets Operator
We will set up External Secrets Operator to securely access Amazon Managed Grafana workspace API key.
Follow the steps to create the Amazon Managed Grafana workspace API key and create secret /eksa/amg-api-key in AWS Secrets Manager.
export GO_AMG_ENDPOINT_URL="https://$(aws grafana list-workspaces \
    --region ${EKSA_REGION} \
    --query "workspaces[?name=='${EKSA_AMG_WORKSPACE_NAME}'].endpoint" \
    --output text)"

export GO_AMG_WORKSPACE_ID=$(aws grafana list-workspaces \
    --region ${EKSA_REGION} \
    --query "workspaces[?name=='${EKSA_AMG_WORKSPACE_NAME}'].id" \
    --output text)

export GO_AMG_API_KEY=$(aws grafana create-workspace-api-key \
  --region ${EKSA_REGION} \
  --key-name "grafana-operator-key" \
  --key-role "ADMIN" \
  --seconds-to-live 432000 \
  --workspace-id $GO_AMG_WORKSPACE_ID \
  --query key \
  --output text)

aws secretsmanager create-secret \
    --region ${EKSA_REGION} \
    --description "API Key of Grafana Instance" \
    --name $GO_API_KEY_SECRET_NAME

aws secretsmanager update-secret \
    --region ${EKSA_REGION} \
    --secret-id $GO_API_KEY_SECRET_NAME \
    --secret-string "${GO_AMG_API_KEY}"
Install External Secrets Operator using the command:
helm repo add external-secrets https://charts.external-secrets.io
helm upgrade --install external-secrets external-secrets/external-secrets \
    -n external-secrets --create-namespace
Confirm installation using the command:
kubectl get pods -n external-secrets

NAME                                                READY   STATUS    RESTARTS   AGE
external-secrets-79f74fbbdc-s9n2q                   1/1     Running   0          2m52s
external-secrets-cert-controller-6ff57885db-7xnbs   1/1     Running   0          2m52s
external-secrets-webhook-79cbc94f95-hbqs7           1/1     Running   0          2m52s
Then, create IRSA for accessing AWS Secrets Manager secret with fine-grained access.
# create a trust policy for the IAM role
curl -s https://raw.githubusercontent.com/aws-samples/containers-blog-maelstrom/main/eksa-adot-cp/templates/secrets-manager-trust-policy-template.json \
    | envsubst > ./secrets-manager-trust-policy.json

# create a permission policy for the IAM role
curl -s https://raw.githubusercontent.com/aws-samples/containers-blog-maelstrom/main/eksa-adot-cp/templates/secrets-manager-perm-policy-template.json \
    | envsubst > ./secrets-manager-perm-policy.json

# create an IAM role
existingRole=$(aws iam list-roles --query "Roles[?RoleName=='${EKSA_ES_SERVICE_ACCOUNT}-role'].RoleName" --output text)
if [ -z ${existingRole} ]; then
    aws iam create-role --role-name ${EKSA_ES_SERVICE_ACCOUNT}-role \
        --assume-role-policy-document file://secrets-manager-trust-policy.json \
        --query Role.Arn --output text

    aws iam put-role-policy --role-name ${EKSA_ES_SERVICE_ACCOUNT}-role \
        --policy-name secrets-manager-PermissionPolicy \
        --policy-document file://secrets-manager-perm-policy.json
fi

export ES_ROLEARN=$(aws iam list-roles --query "Roles[?RoleName=='${EKSA_ES_SERVICE_ACCOUNT}-role'].Arn" --output text)
Then, create a service account for ExternalSecret.
curl -s https://raw.githubusercontent.com/aws-samples/containers-blog-maelstrom/main/eksa-adot-cp/templates/external-secrets-sa-template.yaml \
    | envsubst > ./external-secrets-sa.yaml
kubectl apply -f ./external-secrets-sa.yaml
Create ClusterSecretStore with service account-based authentication
curl -s https://raw.githubusercontent.com/aws-samples/containers-blog-maelstrom/main/eksa-adot-cp/templates/clustersecretstore-template.yaml \
    | envsubst > ./clustersecretstore.yaml
kubectl apply -f ./clustersecretstore.yaml
Verify ClusterSecretStore status using command
kubectl get clustersecretstore aws-secretsmanager -n observability

NAME                 AGE   STATUS   CAPABILITIES   READY
aws-secretsmanager   16m   Valid    ReadWrite      True
Then, create ExternalSecret in grafana-operator namespace with a secret target name as grafana-admin-credentials. This configuration will sync Kubernetes secret grafana-admin-credentials with AWS Secrets Manage secret /eksa/amg-api-key every hour. Grafana Operator expects this secret to be available through data key GF_SECURITY_ADMIN_APIKEY.
kubectl create namespace grafana-operator

curl -s https://raw.githubusercontent.com/aws-samples/containers-blog-maelstrom/main/eksa-adot-cp/templates/eksa-externalsecret-template.yaml \
    | envsubst > ./eksa-externalsecret.yaml
kubectl apply -f ./eksa-externalsecret.yaml
Validate configuration using the command
kubectl get es -n grafana-operator

NAME                  STORE                REFRESH INTERVAL   STATUS         READY
eksa-externalsecret   aws-secretsmanager   1h                 SecretSynced   True
We can verify the value of Kubernetes secrets synched using the command.
kubectl get secrets -n grafana-operator grafana-admin-credentials \
    -o jsonpath='{.data.GF_SECURITY_ADMIN_APIKEY}' | base64 -d
If we need to force sync for any troubleshooting reasons, then run the commands.
kubectl annotate es eksa-externalsecret -n grafana-operator \
    force-sync=$(date +%s) --overwrite
# check last synced status
kubectl get es -n grafana-operator eksa-externalsecret -o yaml | grep condition -A 5
Installing Grafana Operator
Install Grafana Operator in namespace grafana-operator
helm upgrade -i grafana-operator oci://ghcr.io/grafana-operator/helm-charts/grafana-operator --version v5.0.0-rc0 -n grafana-operatorVerify installation by using command:
kubectl get pod -n grafana-operator

NAME                                READY   STATUS    RESTARTS   AGE
grafana-operator-6fb7474577-nrnmc   2/2     Running   0          3h
Installing Prometheus Node Exporter
Run the command to deploy prometheus-node-exporter to generate various metrics.
helm repo add prometheus-community https://prometheus-community.github.io/helm-charts
helm install prometheus-node-exporter prometheus-community/prometheus-node-exporter \
 --version 4.17.3 \
 --namespace prometheus-node-exporter \
 --create-namespace
Verify the prometheus-node-exporter status using the command.
kubectl get pods -n prometheus-node-exporter -l "app.kubernetes.io/name=prometheus-node-exporter"

NAME                             READY   STATUS    RESTARTS   AGE
prometheus-node-exporter-7jm49   1/1     Running   0          93s
prometheus-node-exporter-d2k6q   1/1     Running   0          93s
prometheus-node-exporter-dqgwl   1/1     Running   0          93s
prometheus-node-exporter-tc6mt   1/1     Running   0          93s
GitOps with Amazon Managed Grafana
We will use GitOps sync via Flux to create Grafana Datasources and Dashboards in Amazon Managed Grafana using Grafana Operator. Deploy Flux in your EKS Anywhere cluster using the command:
kubectl apply -f https://github.com/fluxcd/flux2/releases/latest/download/install.yaml
kubectl get pods -n flux-system

NAME                                       READY   STATUS    RESTARTS   AGENAME                                           READY   STATUS    RESTARTS   AGE
helm-controller-794cf7df78-tx4xw               1/1     Running   0          23s
image-automation-controller-6f767475df-86ch6   1/1     Running   0          23s
image-reflector-controller-df6857b88-sdlxm     1/1     Running   0          23s
kustomize-controller-6c555cb5c-rdrjb           1/1     Running   0          23s
notification-controller-5ff465bc5c-cbdmv       1/1     Running   0          23s
source-controller-6bf685fcdd-bfrjv             1/1     Running   0          23s
Use the declarative code snippet from One-Observability-demo GitHub repo to create data sources for Amazon Managed Service for Prometheus and dashboards in Amazon Managed Grafana . This snippet needs variables such as AMG_AWS_REGION, AMP_ENDPOINT_URL, AMG_ENDPOINT_URL, and GRAFANA_NODEEXP_DASH_URL with required values. We will use Flux Post build variable substitution to dynamically render these variables from a ConfigMap and avoid hardcoding values in manifest files.
export GRAFANA_CLUSTER_DASH_URL="https://raw.githubusercontent.com/aws-samples/one-observability-demo/main/grafana-dashboards/nodeexporter-nodes.json"

kubectl create configmap cluster-vars -n flux-system \
    --from-literal=AMG_AWS_REGION=$EKSA_REGION \
    --from-literal=AMP_ENDPOINT_URL=$EKSA_AMP_ENDPOINT_URL \
    --from-literal=AMG_ENDPOINT_URL=$GO_AMG_ENDPOINT_URL \
    --from-literal=GRAFANA_NODEEXP_DASH_URL=$GRAFANA_CLUSTER_DASH_URL
Then, set One-Observability-demo GitHub repo as source GitRepository in Flux and verify using the commands.
kubectl apply -f https://raw.githubusercontent.com/aws-samples/one-observability-demo/main/gitops/git-repository.yaml
kubectl get gitrepositories.source.toolkit.fluxcd.io grafana-repo -n flux-system

NAME           URL                                                     AGE     READY   STATUS
grafana-repo   https://github.com/aws-samples/one-observability-demo   2m21s   True    stored artifact for revision 'main@sha1:4793caae4f6b9d6806a384681594b8fa37f7aa51'
Next, setup Kustomization for Flux to sync GitRepository and verify using the following commands.
kubectl apply -f https://raw.githubusercontent.com/aws-samples/one-observability-demo/main/gitops/grafana-kustomization.yaml
kubectl get kustomizations.kustomize.toolkit.fluxcd.io grafana-kustomization -n flux-system

NAME                    AGE   READY   STATUS
grafana-kustomization   28s   True    Applied revision: main@sha1:4793caae4f6b9d6806a384681594b8fa37f7aa51
Check the identity of Amazon Managed Grafana created and status using the command.
kubectl get grafanas.grafana.integreatly.org -n grafana-operator -o jsonpath='{.items[0].status.adminUrl}{"\n"}{.items[0].status.stageStatus}{"\n"}'

https://g-1234567890.grafana-workspace.us-east-2.amazonaws.com/
success
Verify the data source configuration and status using the command. We should see the Amazon Managed Service for Prometheus endpoint and no errors in the status message as shown:
kubectl get grafanadatasources.grafana.integreatly.org -n grafana-operator -o jsonpath='{.items[0].spec.datasource.url}{"\n"}{.items[0].status}{"\n"}'

https://aps-workspaces.us-east-2.amazonaws.com/workspaces/ws-1a23b456-1234-1ab2-ab2a-1ab23456abc3/
{"hash":"4f272eb40a579c94f007b5dc32f751314f5e2fc84bbe5b49a6f30e507c9b75b9"}
Also, verify the Grafana Dashboards status using the command.
kubectl get grafanadashboards.grafana.integreatly.org -n grafana-operator

NAME                            AGE
external-grafanadashboard-url   13m
Check logs of grafana-operator pod for sync status
kubectl logs -n grafana-operator -l app.kubernetes.io/instance=grafana-operator -c grafana-operator --tail=5


1.6856899784976947e+09    INFO    found matching Grafana instances for datasource    {"controller": "grafanadatasource", "controllerGroup": "grafana.integreatly.org", "controllerKind": "GrafanaDatasource", "GrafanaDatasource": {"name":"grafanadatasource-sample-amp","namespace":"grafana-operator"}, "namespace": "grafana-operator", "name": "grafanadatasource-sample-amp", "reconcileID": "08a6f8e1-f39a-4e8b-bfd0-b62eb7bd7672", "count": 1}
1.6856902684062688e+09    INFO    found matching Grafana instances for dashboard    {"controller": "grafanadashboard", "controllerGroup": "grafana.integreatly.org", "controllerKind": "GrafanaDashboard", "GrafanaDashboard": {"name":"external-grafanadashboard-url","namespace":"grafana-operator"}, "namespace": "grafana-operator", "name": "external-grafanadashboard-url", "reconcileID": "d7e2f203-3aa6-4315-9c5f-a0648951a188", "count": 1}
1.685690278911489e+09    INFO    found matching Grafana instances for datasource    {"controller": "grafanadatasource", "controllerGroup": "grafana.integreatly.org", "controllerKind": "GrafanaDatasource", "GrafanaDatasource": {"name":"grafanadatasource-sample-amp","namespace":"grafana-operator"}, "namespace": "grafana-operator", "name": "grafanadatasource-sample-amp", "reconcileID": "2b5115ab-a5c0-4512-ba71-08e4a5134a97", "count": 1}
Then, let us navigate to the Amazon Managed Grafana console and verify the data source grafana-operator-amp-datasource created by grafana-operator.

Click and open the grafana-operator-amp-datasource, scroll to the bottom, and click “Save & test”.

Finally, let’s navigate to the Amazon Managed Grafana console, click on Search Dashboards, and you will be able to see a Dashboard by the name Grafana Operator - Node Exporter / Nodes. Click it, set the data source to grafana-operator-amp-datasource, and view Grafana Dashboard created out of the box having all the metrics from Prometheus Node Exporter installed on your Amazon EKS Anywhere Cluster.

Clean up
We continue to incur costs until deleting the infrastructure created for this post. Use the commands to delete resources created during this post.
# clean up EKSA resources
wget https://raw.githubusercontent.com/aws-samples/containers-blog-maelstrom/main/eksa-adot-cp/cleanup-eksa-resources.sh
bash ./cleanup-eksa-resources.sh

# clean up AWS resources
wget https://raw.githubusercontent.com/aws-samples/containers-blog-maelstrom/main/eksa-adot-cp/cleanup-aws-resources.sh
bash ./cleanup-aws-resources.sh
Conclusion
In this post, you learned how to use ADOT EKS-A curated package to remote write Prometheus-compatible metrics from your EKS-A cluster to Amazon Managed Service for Prometheus. Further, We used GitOps mechanisms with Flux and Grafana Operator from your EKS-A cluster to create Grafana-managed resources such as dashboards, data sources, etc., hosted on external environments like Amazon Managed Grafana to visualize metrics from your on-premises Kubernetes cluster. Please read our blog on Using Open Source Grafana Operator on your Kubernetes cluster to manage Amazon Managed Grafana if you want to implement a similar solution on your Amazon EKS cluster on AWS Cloud.
To learn more about AWS Observability services, check the resources below:
- AWS Observability Best Practices Guide
- One Observability Workshop
- Terraform AWS Observability Accelerator
- CDK AWS Observability Accelerator
- EKS Anywhere curated package management
- Blue/Green Kubernetes upgrades for Amazon EKS Anywhere using Flux
- Monitoring Amazon EKS Anywhere using Amazon Managed Service for Prometheus and Amazon Managed Grafana
About the Authors

Elamaran Shanmugam
Elamaran (Ela) Shanmugam is a Sr. Container Specialist Solutions Architect with Amazon Web Services. Ela is a Container, Observability, and Multi-Account Architecture SME and helps AWS partners and customers to design and build scalable, secure, and optimized container workloads on AWS. His passion is building and automating Infrastructure to allow customers to focus more on their business. He is based out of Tampa, Florida, and you can reach him on Twitter @IamElaShan

Prakash Srinivasan
Prakash is a Solutions Architect with Amazon Web Services. He is a passionate builder who helps customers modernize their applications and accelerate their Cloud journey to get the best out of the Cloud for their business. In his spare time, he enjoys watching movies and spending more time with his family. He is based out of Denver, Colorado, and you can connect with him on Linkedin at linkedin.com/in/prakash-s