AWS Open Source Blog
Simplifying serverless best practices with AWS Lambda Powertools Java
Modern applications are increasingly relying on compute platforms based on serverless technologies to provide scalability, cost efficiency, and agility. Distributed architectures have unlocked many benefits, and they have introduced new complexities in how the applications operate. With traditional architectures, debugging was as straightforward as logging into the server and inspecting the logs. Modern observability must respond to the complexity of microservices architectures, the increased frequency of software deployments, and the short-lived nature of AWS Lambda execution environments.
Following the community’s continued successful adoption of AWS Lambda Powertools Python, we are announcing the general availability of AWS Lambda Powertools Java.
The Serverless Lens in AWS Well-Architected Tool article suggests several best practices for observability, such as structured logging, distributed traces, and monitoring of metrics. In this post, we demonstrate how to use the new open source Lambda Powertools Java library to implement these best practices without writing custom code. We walk through the process of getting started, with examples of the implementation drawn from a sample Java-based serverless microservice.
Lambda Powertools Java comes with a set of community-built utilities, in addition to the previously mentioned core utilities. We will briefly discuss these later in the post.

About Lambda Powertools
Lambda Powertools Java is an opinionated library that helps with implementing observability best practices without the undifferentiated heavy lifting. It currently supports AWS Lambda functions written in Java and officially supports all Java runtimes. Utilities are split into different maven modules, letting customers select and import only what they need, keeping the dependencies to a minimum. Lambda Powertools Java provides three core utilities:
- Tracing provides a simple way to send traces from functions to AWS X-Ray. It provides visibility into function calls, interactions with other AWS services, or external HTTP requests. You can add annotations to traces to allow filtering based on key information. For example, when using
@Tracing, it creates a ColdStart annotation for you. You can easily group and analyze traces where there was an initialization overhead. - Logging, based on log4j2, outputs structured JSON. It allows you to pass in strings, or more complex objects, and takes care of serializing the log output. Common use cases—such as logging the Lambda event payload and capturing cold start information—are handled for you. You can also include your own custom keys to the logger at any time.
- Metrics makes collecting custom metrics from your application simple, without the need to make synchronous requests to external systems. This functionality, which is powered by Amazon CloudWatch Embedded Metric Format (EMF), allows for capturing metrics asynchronously and uses the aws-embedded-metrics-java library. Again, convenient functionality provides for common cases, such as validating metrics against CloudWatch EMF specification and tracking cold starts.
Getting started
The following steps explain how to implement structured logging, add custom metrics, and enable tracing with AWS X-Ray for an example application. The example application backend uses AWS Serverless Application Model (AWS SAM) to manage deployment, and consists of a REST API providing different image-processing functionality. The example uses Apache Maven for dependency management.
First, we add the respective modules from the Lambda Powertools library as a dependency for our AWS Lambda functions:
When using different Java annotations provided by the library, configure the aspectj-maven-plugin to compile-time weave (CTW) the aws-lambda-powertools-java aspects into your project.
Note: If you are not planning to use any annotations from the library, this step is optional.
We use environment variables in the Globals sections of our application’s AWS SAM template to pass common configuration to the library. Enable active tracing for Lambda functions and Amazon API Gateway stages. We need those services to create a trace if one doesn’t already exist from an upstream request:
Next, we initialize the Metrics, Logging, and Tracing annotations in the code for the Java Lambda functions we want to enable utility on. For example:
For additional reference, please visit our GitHub.
Logging
The main benefit of using a standard logging framework is that it makes for a seamless transition. One of the most popular logging frameworks for Java developers is Apache Log4j 2. Customers who are already using Log4j 2 can adapt to it easily without many code changes.
Because the logging utility uses Log4j 2 as a base library to perform logging, we configure log4j2.xml to use LambdaJsonLayout provided by powertools-logging module:
The output is sent to Amazon CloudWatch Logs as a JSON-formatted line:
Another common use case, especially when developing new Lambda functions, is to print a log of the event received by the handler. We can achieve this by passing the logEvent attribute to the @Logging annotation, which is disabled by default to prevent potentially leaking sensitive event data into logs:
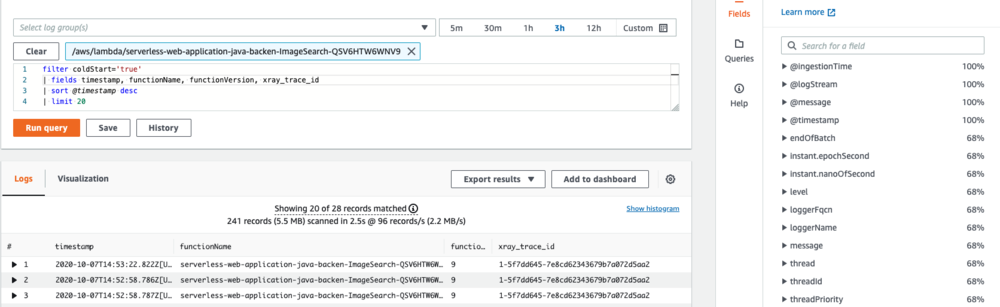
Having logs available as structured JSON lets us perform searches on this structured data using CloudWatch Logs Insights. In the example, we’re searching for all logs that were output during a Lambda cold start and displaying key fields in the output:
Tracing
By using the @Tracing annotation, we can instruct the library to send traces and metadata from the execution of our Lambda function to AWS X-Ray. To provide more granular details to our traces, we use the same annotation to capture the execution of other functions outside of the handler:
Once traffic is flowing, we see a generated service map in the AWS X-Ray console. We achieved this by annotating our Lambda function handler method, or any other method in the chain. We now have an overview of all the traffic flowing through our application:

We can also view the individual traces that are generated, along with a waterfall view of the segments and subsegments that comprise our trace. This data is invaluable when we want to pinpoint the root cause of slow operations or errors within our application:

We can also filter traces by annotation and create custom service maps with AWS X-Ray Trace groups, if necessary. In this case, we use the filter expression annotation.ColdStart = true to filter traces based on the ColdStart annotation.@Tracing annotation adds these automatically when used over the handler method:

You still have access to all the APIs provided by AWS X-Ray SDK for Java to capture any additional metadata and annotations on your X-Ray subsegments. There are other fluent APIs provided by the powertools-tracing module as well, which takes away most of heavy lifting of capturing X-Ray subsegments.
Metrics
Finally, let’s make adding custom metrics to the application simpler. CloudWatch offers many useful metrics out of the box to help answer general questions about the application’s throughput, error rate, and resource utilization. However, to understand the behavior of the application better, we also need to collect custom metrics relevant to our business.
In the image upload service, for example, we want to measure the remaining time in the functions timeout when it finishes execution, in order to tweak the timeout settings appropriately.
The metrics utility creates custom metrics asynchronously by logging metrics to standard output following Amazon CloudWatch Embedded Metric Format (EMF).
To create custom metrics, we start by decorating our Lambda function with @Metrics. This ensures that all metrics serialize properly and flush to logs when the function finishes its execution. We use standard library aws-embedded-metrics-java, so users have access to all the existing APIs to capture additional metrics, dimension, etc. We also have the option to pass captureColdStart parameter to the annotation to create a cold start metric automatically:
Helper utilities
Lambda Powertools Java adds a set of utilities that removes most of the heavy lifting that customers have to do across a wide range of use cases. New utilities get added based on community feedback. If you have an idea, feel free to open an RFC.
The following list shows a sample of the utilities supported:
- Amazon Simple Queue Service (Amazon SQS) Large Message Handling: The large message handling utility manages Amazon SQS messages that have had their payloads offloaded to Amazon Simple Storage Service (Amazon S3). These messages are usually larger than the Amazon SQS maximum. The utility automatically retrieves messages that have been offloaded to Amazon S3 using the amazon-sqs-java-extended-client-lib client library. Once the message payloads process successfully, the utility deletes the message payloads from Amazon S3.
- Amazon SQS Batch Processing: The Amazon SQS batch processing utility provides a way to handle partial failures when processing batches of messages from Amazon SQS. It prevents successfully processed messages from returning to Amazon SQS and provides simple interface for individually processing messages from a batch:
Alternatively, if you want a more functional API:
- Parameters: The parameters utility provides a way to retrieve parameter values from AWS Systems Manager Parameter Store or AWS Secrets Manager. It also provides a base class to create your parameter provider implementation. You can also configure it to cache the parameters to reduce function execution time:
Conclusion
Amazon CloudWatch and AWS X-Ray offer functionality that provides comprehensive observability for your applications. If you’re using AWS Lambda to run your Java functions, Lambda Powertools Java is now generally available. The library helps you to get the most value from those services, while minimizing the amount of custom code needed to achieve best practices.
You can find the full documentation and the source code for Lambda Powertools Java in GitHub. We welcome contributions via pull request, and we encourage you to create an issue if you have any feedback for the project. We’d love to see what you build with it.