AWS Startups Blog
1mg: Building a Patient Centric Digital Health Repository – Part 1

Guest post by Utkarsh Gupta, Lead Data Scientist, 1mg.com
1mg is an integrated health app that offers an online pharmacy, diagnostics, and consultations at scale in one place. Additionally, the app has a ton of digital health tools, including medicine reminders, digital health records, and much more to make healthcare management easier. Our goal is to provide 360-degree healthcare service in a few clicks.
Over the last 5 years, our business and users have scaled rapidly, going from a few thousand to upwards of 25 million users each month and generating billions of data points for our users. To support such a growth, our tech stack also evolved accordingly, and new data stores were introduced over time. These data stores were owned by numerous disjointed internal teams within 1mg, like order fulfilment, payments, and analytics. The data retrieved from these data stores can be broadly categorized into the following groups:
- Transactional data: the data generated from orders along with conversations between patients and doctors. This data is first validated and then stored into a data source of choice, like Amazon RDS PostgreSQL, RDS MySQL or a MongoDB cluster. These data sources are owned by the above mentioned disjointed internal teams as per a legacy approach. These sources together are comprised of over 200 tables, with 10 GB of new data being ingested per day. The data relevant for a single portion of the application is always interlinked through IDs for entities like users, prescriptions, conversations, vendors, etc. However, different portions in the app (like pharmacy, labs, and e-consultation) still used their individual infrastructure and storage mechanisms to optimize individual performance.
- Third-party non-transactional data: the behavioural data generated by third-party sources via logging of client-side interactions. These sources together are comprised of 10-20 GB of data ingestion per day and stored in similar third-party data stores. Linking such data with transactional data either requires us to fetch all non-transactional data into our transactional data store or take the subset of relational data onto the non-transactional platforms, followed by rigorous processing and mapping. Over time, these third-party platforms generated data at such a massive pace that we faced tough time managing the interactions.
- API request-response log data: data generated whenever a client interacts with a microservice-based backend system via a request for some action or data through various APIs. This log data is stored as local files per microservice of the backend system and is especially important for data science experiments. To make it easy to extract values from important keys, we flatten out the request-response object for these APIs to retain only a single key reference. As this source of data roughly generates 200+ GB of log files each day, the number of unique keys in the logs eventually exploded. Also, we ended up with a brittle metric tracking system since any change in the key namespace broke down the entire tracking until the new mapping was corrected in the data processing pipeline.
As evident from above, our infrastructure allowed ingestion of data into disjointed sources but did not provide a single source of truth about the user.
Therefore, we were unable to effectively address concerns that were relevant for accurate business decisions, like the business need to understand the conversion funnel of a branding campaign. The sample question could, for example, ask “what is the number of users who saw an ad banner on the 1mg app versus the number of users who actually performed a transaction based on that ad banner?”
For answers to such questions, we required data from all 3 data sources mentioned above, and it seemed like an uphill task, especially with the ever growing scale.
The solution
After a thorough evaluation, it was clear to us that a unified data lake would be an appropriate replacement of the existing infrastructure that would store, map, relate and normalize all the facts and dimensions of the data to provide a single source of truth for everything related to a user.
Our unified data lake, the one source of truth for everything, is depicted in the following architecture diagram.
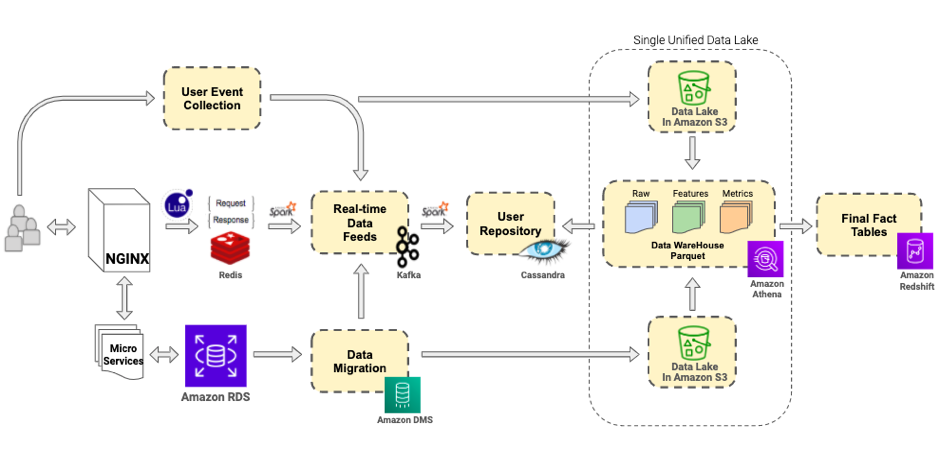
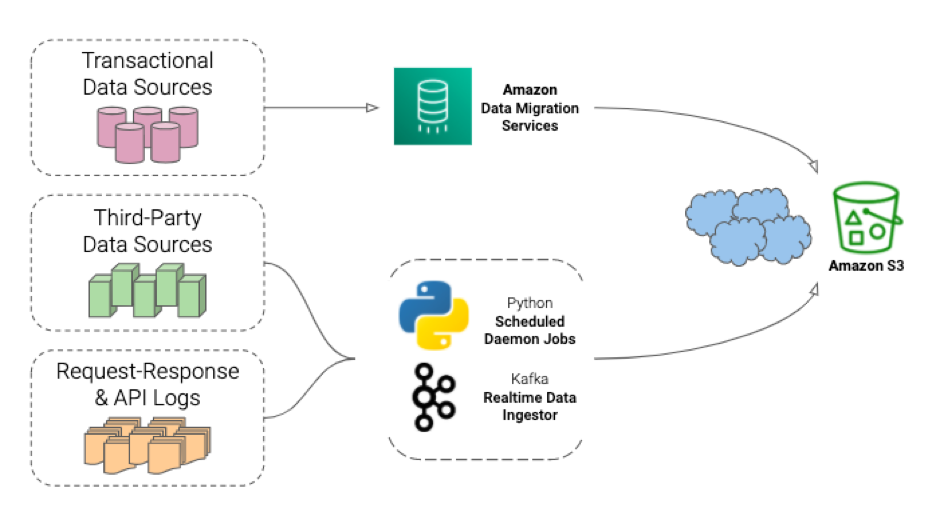
Considering the scale of our efforts, we went ahead with Amazon S3. We decided to fetch and push data from all the transactional databases, third party sources, and request-response logs to specific buckets in Amazon S3. These buckets together created a raw datalLayer for us.
The transactional data sources were connected to AWS Data Migration Service tasks to relay the full load and change data on to S3 buckets. The non-transactional data sources were connected to S3 endpoints via mechanisms native to these platforms, and the request-response logs were redirected to S3 buckets by daemons hosted on the servers generating these logs.
Amazon Athena – Data Processing Engine
Amazon S3 has primarily been used as a remote object storage, but now with technologies like Amazon Athena, which uses a Presto-based query engine, we can now process and consume data stored in S3 buckets. There are many amazing features about Athena but the following two stood out for us:
- You can access any data stored in S3 through SQL queries but the data is never altered with avoiding any chance of accidental deletion.
- With a feature called CTAS, data can be processed and stored in an optimized storage format: Parquet, which makes column specific queries quite efficient.
These features helped us build a simple and extremely fast data processing pipeline for a lower cost.
We further abstracted the data stored in S3 into three main components:
- Data Store – The data in S3 buckets is not immediately useful in the state it arrives. The data from earlier mentioned sources are further subjected to multiple strategies of partitioning and clustering using Amazon Athena CTAS queries.
- Feature Store – This next layer stores pre-calculated numeric features (columns) about users and other entities like vendors, orders, prescriptions, etc. These features are stored in tables in optimized and partitioned formats, which make it easily accessible for building models in data science experiments and for slicing and dicing for analytics reporting.
- Metrics Store – This is the most widely used layer and stores pre-calculated aggregates for reporting purposes. These datasets or tables are passed on to other data storage solutions like Amazon Redshift, which powers reporting dashboards.
The entire data upload and processing pipeline is managed through Apache Airflow, an open-source task scheduling engine. The single unit of processing executes a bunch of SQL queries to process data in S3 buckets and store them back in other S3 buckets.

In total there are about 600 CTAS queries running every day across all the components. Apache Airflow maintains this Athena CTAS-based processing via Directed Acyclic Graphs (DAGs).
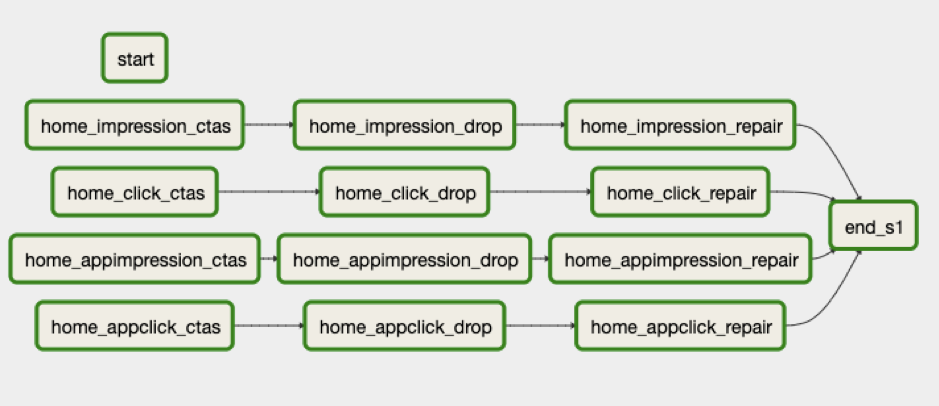
Homepage Metrics DAG
Building Robust and Scalable Analytics
Metrics are central to any product performance evaluation as well as understanding the behavioral patterns of different business entities and user cohorts. These metrics are aggregations generated after slicing and dicing of data across multiple dimensions.
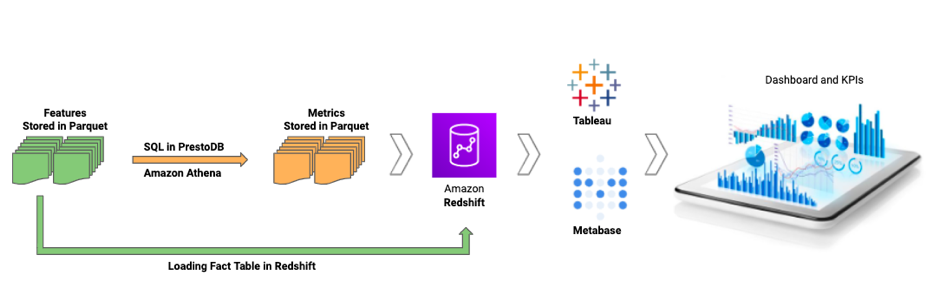
While this slicing and dicing is possible using queries directly on processed and optimized features in the Feature Store, a more flexible approach was needed that allowed tracking KPIs or evaluating model performance on an ongoing/ad-hoc basis. To enable this flexibility, we moved the pre-defined metrics and some final factual data (a subset of features for entities like user, order, vendor, delivery partners etc ) to Amazon Redshift.
We then further connected Amazon Redshift to Tableau and Metabase for building analytics and visualization dashboards. The Apache Airflow DAGs described above are used to schedule COPY command of Amazon Redshift to load parquet datafiles from Amazon S3.
Building metrics as a part of the unified data lake enabled us to share and re-use metrics across analytics and data science teams.
Integration across the data pipeline and bringing everything under a single umbrella ETL process has led to enhanced productivity and faster turnaround time for many analytics and algorithmic tasks. Computing attributes about all our users across business units and slicing and dicing them for targeted brand campaigns has become much easier and in many cases has been completely automated. This has opened multiple new revenue streams for target-based advertising teams both on and off the platform increasing the potential year-on-year advertisement revenue by 3x.
Summary
The present data architecture allows us to have a 360 degree view of our users and perform robust analytics on the underlying processed information. Amazon S3 provides a durable and cheap solution for data storage for all versions of processed data. The processing of this raw data to features and metrics is done through Amazon Athena which allows running SQL on data stored in Amazon S3 buckets. Since everything ends up in Amazon S3, the data can be easily loaded onto any platform for building dashboards. We use Tableau and Metabase for analytics monitoring and alerting.
In part 2 of this series, we discuss how the infrastructure described above can be used for large scale machine learning applications and the ways to deploy them in production to build a patient centric digital health repository.