AWS Startups Blog
redBus: Building a Data Platform with AWS & Apache Software Foundation
Guest post by Dweep Sharma, Data Engineering, redBus
redBus, India’s largest online bus ticketing platform, uses AWS and open source technologies for its data platform. As future data requirements cannot always be planned much ahead of time, the data warehousing effort is generally subdued by first creating a data lake, which is a pool of centralized data ready to be transformed based on use cases. A means for accessing and analyzing this data makes it easier for knowledge workers to make good informed decisions. In this post, Dweep Sharma walks through how they built their data platform.
Motivation
Before creation of the data lake, redBus had several challenges with data requirements that led to the creation of the data platform:
● As the organization grew, delivery of applications that required unification of historic and real time data deteriorated due to unstructured large sets of data.
● It was cumbersome to query multiple data sources because there was no centralized data access point.
● Querying data often led to timeout exceptions due to growing data volumes and inability of RDBMS to scale.
● Normalized data was not suitable for analytics.
● There was an inability to trace requests to/from micro-services at a session level.
Building the Data Platform with AWS & Apache Software Foundation

Data in silos can be very difficult to unify for analytics. The first task to perform any analytics is to unify raw data into a centralized store. We were maintaining multiple AWS accounts for various business units and different types of data stores, so we decided to work on a generic solution which would first bring raw data into a common format at a centralized store. Data would then be denormalized and stitched across business units to provide a flat structure.
redBus’ data platform is a collection of services to create a data lake, perform data transformations, create data marts specific to business use cases, offer a query interface for analytics, and allow for visualization of real time data and trends.
Architecture

Major components of our data platform
Data Ingestion & Transformations
We use two types of data synchronization strategies:
- A full synchronization or snapshot, which is a total copy of a table in which changes are infrequent. We use a combination of tools based on the workload like Sqoop, Apache Drill, AWS Glue (Spark) and NiFi for this task.
- Incremental synchronization for tables where updates occur frequently. This is done using NiFi & Kafka. Total data ingested and transformed weekly is close to 700 GB expected to grow to 1 TB with more pipelines being added.
The following technologies have been used to build the data platform:
- Apache NiFi supports data routing, transformation, and system mediation logic using powerful and scalable directed graphs.
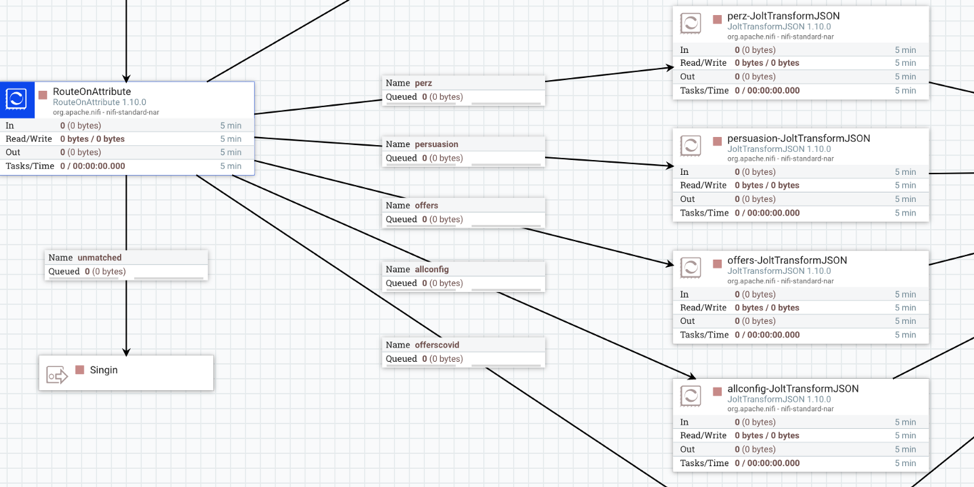
The image above depicts a real time NiFi pipeline that feeds data into a Kafka topic. Raw data is ingested using HandleHttpRequest processors and, using a combination of RouteOnAttribute & JoltTransformJSON processors (to parse JSON using JoltTransformations), data is transformed and published to Kafka.
- Parquet data format, when well partitioned, offers the read performance that makes it suitable for analytics. The format is built to support very efficient compression and encoding schemes, thereby offering a significant cost reduction on server-less query engines like Amazon Athena. The cost and storage size can be up to 90% lesser than using csv. For these reasons, we used parquet as the data format in our data lake.
- AWS Lambdas allow us to execute a unit operation or function that resides in the cloud. Lambdas are currently used for scheduled report generation and parsing incoming S3 files by S3 objectcreated event.
- Spark is the technology that currently runs on most big data platforms, because Spark is 100x faster compared to Hadoop Map-Reduce. At redBus, there are various systems that produce transaction data, application logs, Google analytics data, ELB logs, streams etc. Spark is the ideal choice for the transformation required for data warehousing due to its speed and scalability.
- AWS Glue is a fully managed serverless ETL service. The serverless feature helped us get started with Spark workloads as we were not fully aware of the scale at which we would need to run Spark jobs initially. Instead of running an underutilized, fixed cost model large spark cluster, we used the scalability configuration of Glue to meet our growing requirements.
- The advantages are schema inference enabled by crawlers, synchronization of jobs by triggers, integration of data catalog with Athena, and support for scala and python.
We use Glue for batch processing as cross-account-access enables us to run ETL Jobs on multiple data sources residing on different accounts. Glue also provides the necessary security as scripts are encrypted and stored in S3. Before every job run, the DPU configuration can be provided to fine tune the infra usage.
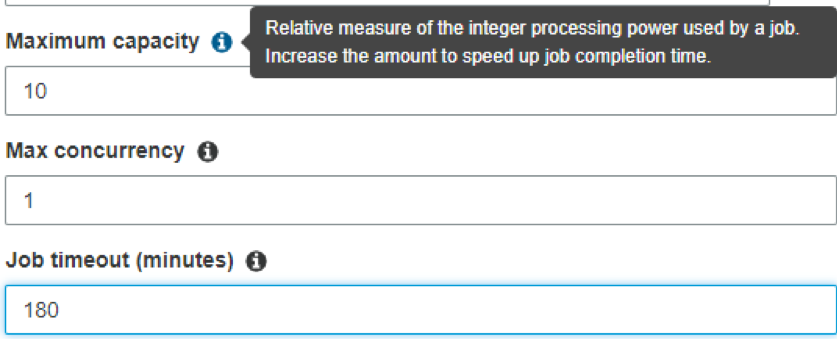
A single Data Processing Unit (DPU) provides 4 vCPU and 16 GB of memory. It can be set in job parameters (optional) of a Glue job.
An AWS Glue job of type Apache Spark requires a minimum of 2 DPUs. By default, AWS Glue allocates 10 DPUs to each Apache Spark job. Every DPU hosts 2 executors. Out of the total 20 executors, 1 executor is reserved for Driver program and 1 DPU for the application master. The actual workload is carried out by 2 * 10–2 (Master) — 1(Driver) = 17 executors. To increase the memory assigned to an executor, in the job parameters, we provide additional parameters to the job like — conf spark.yarn.executor.memoryOverhead =1024.
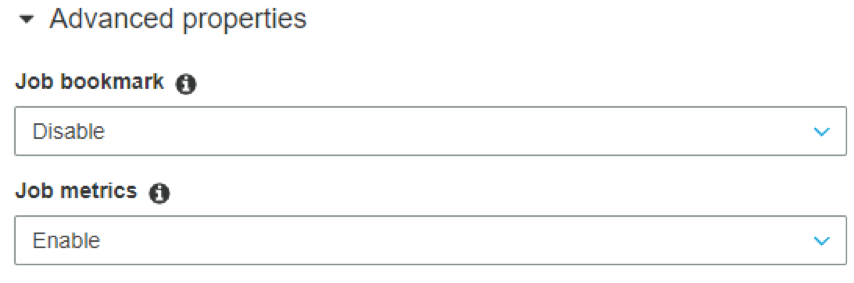
Glue also provides metrics (enabled in advanced properties) to monitor resource utilization of executors. Better performance can be achieved by parallelism of executors.
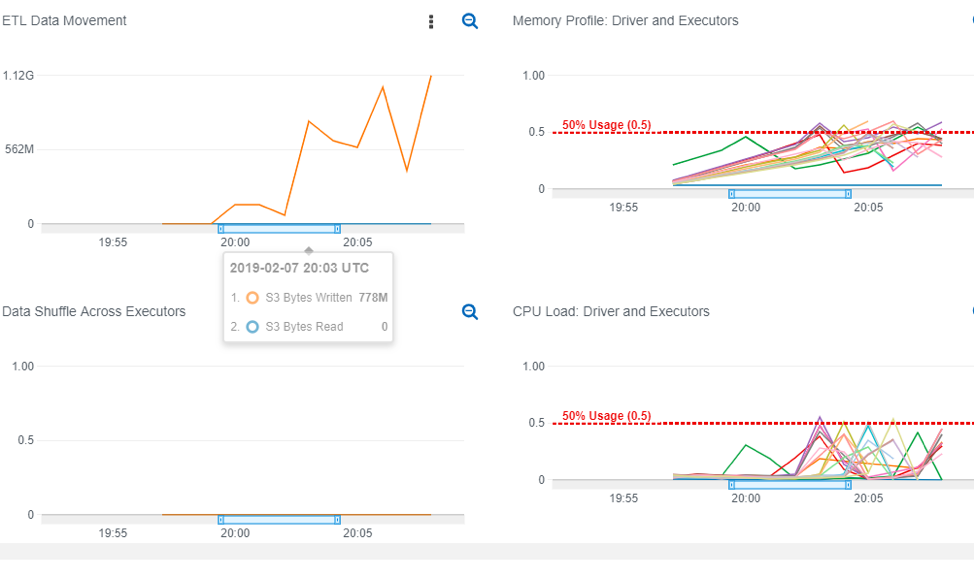
These are some metrics for one of our ETL jobs with 10 DPUs. Each (colored) line denotes an executor. Glue offers data, memory, cpu and executor profiles along with logs (info, exceptions) on Cloudwatch.
Observing the dashboard above, ETL data movement depicts the time taken to move the required volume of data to S3. Memory profile shows that all executors hover around a 50% memory utilization, and the CPU profile denotes the peak compute was at 50% as well.
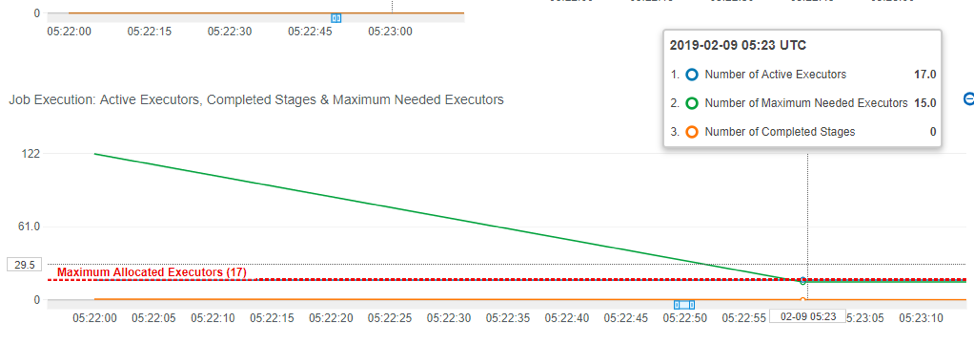
To optimize the runtime, AWS Glue metrics provides a means for determining if the DPUs are under-provisioned or over-provisioned. In the graph above, notice that the Number of Maximum Needed Executors (green) starts at 122 and falls to a constant 15 thereafter. Active Executors (blue) shows the number of executors currently performing the workload and the fixed horizontal red line — Maximum Allocated Executors denotes the 17 executors (based on our 10 DPU allocation). The ratio between the maximum needed executors and maximum allocated executors (adding 1 to both for the Spark driver) gives us the under-provisioning factor: 123/18 = ~7x. We can provision 7*9 + 1 DPUs = 64 DPUs to scale out the job to run it with maximum parallelism and finish faster.
On pricing, consider our ETL job that runs for 14 minutes and consumes 10 DPUs. The price of 1 DPU-Hour is $0.44. Since the job ran for 2/6th of an hour (14 rounded to 20 as the billing is every 10 mins) and consumed 10 DPUs, we are billed 10 DPUs * 2/6 hour at $0.44 per DPU-Hour or (20/6 * 0.44) = $1.46
Data Storage
Data Lake
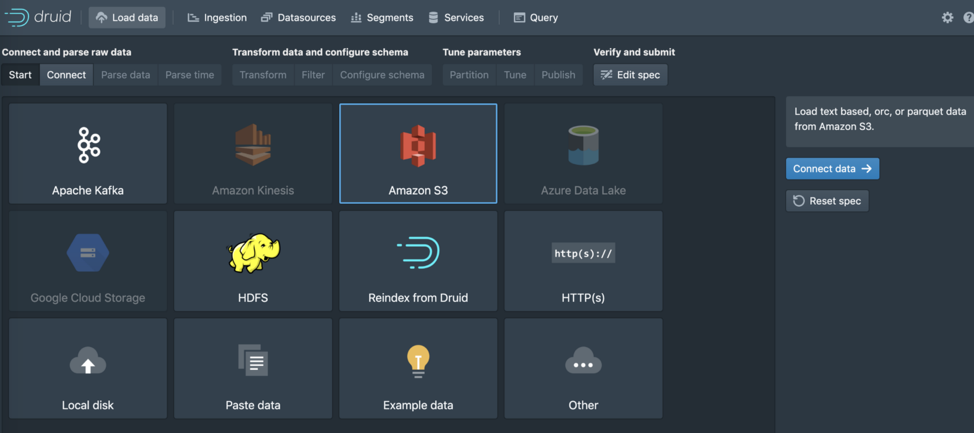
Amazon S3 was selected as a centralized store due to its low cost for long term storage. Using S3 also comes with another advantage as many ASF services connect seamlessly to S3.

S3 bucket structure
Raw data is stored in Parquet format into a staging folder. All data specific to each LOB (line of business) is stored in its respective folder which is partitioned by year, month, and day, which is extracted from a created/modified date field for efficient access for daily transformation jobs.
Once data is transformed, we create data marts in the processed folder by re-partitioning the datasets by dimensions for specific use cases.
Distributed Tracing
Druid is one of the most popular open-source data store for Online Analytical Processing (OLAP). Druid supports ingestion via Kafka, S3, HDFS, AWS Kinesis, other cloud services etc. out of the box.
Support for S3 as deep storage by Druid is also an advantage. Data is segmented, which is configurable, and provides near real-time query response time. Due to these reasons, we chose Druid as our real time analytical data storage system.
Each row in the datasource will store a single event and its related attributes. Since Druid does not natively store nested objects in a queryable format, we flatten the sub-object details as part of the ingestion process. Real time data is unified based on a sessionid.
A SessionId is created by client/channel and shared across with backend, which is a microservices architecture. Each microservice publishes events to the data platform with SessionId to allow us to stitch and trace events for the specific user session. This enables us to perform funnel analysis, root cause analysis and visualize business insights.
Analytics
Reports and Queries
Amazon Athena connects to the Glue data catalog and has access to the data stored in S3. Athena is currently billed based on the data size ($5.00 per TB of data scanned). Since Parquet file size is about 90% lesser than CSV, it is efficient to use Athena and be billed on-demand only. Glue crawlers provide the ability to infer schema directly from the data source and create a table definition on Athena. For our data lake, we run crawlers daily to discover new partitions created by our ingestion layer that can be queried from Athena.
Latest records on Athena : Once data is ingested into S3 from an OLTP store, we store the data in time series (immutable in S3). By this approach, there can be more than one record per transaction (due to updates or modifications).
To get the latest record from Athena, we partition the data and assign a row number. Row numbers are assigned after sorting based on the modified date field.
Data Visualisation
Superset features a rich set of data visualizations and is an easy-to-use interface for exploring and creating/sharing of dashboards. We had two choices for data visualizations: Grafana or Superset. Although Superset is still in the incubation stage, the features and its extensibility seem promising. Superset’s main goal is to make it easy to slice, dice, visualize data, and perform analytics at near real-time speed. Grafana is more appropriate as a monitoring tool, while Superset can be classified under Business Intelligence. Superset charts allows us to answer the below common questions for event analysis:
● What was attempted?
● When was this attempt made?
● Who tried to do it?
● Did they succeed?
● What was the time spent between events?
Some out of the box charts that can helped us get started are:
Event Sequence

Event sequence of multiple sessions
In the image above, we can observe the complete event sequence of a single session. Filters event was succeeded by Seatlayout after 8 seconds of elapsed time. The predecessors to Filters were perz, allconfig etc. Also Seatlayout event occurred 48 seconds after the beginning of this session, i.e from perz event.

Breakdown of all events of a particular session
Calendar heat-map
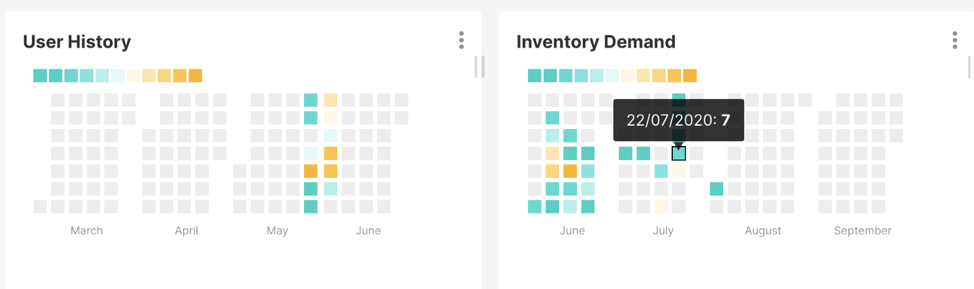
Another useful chart is the calendar heat-map that we use to depict user history and demand trends.
Sunburst Chart
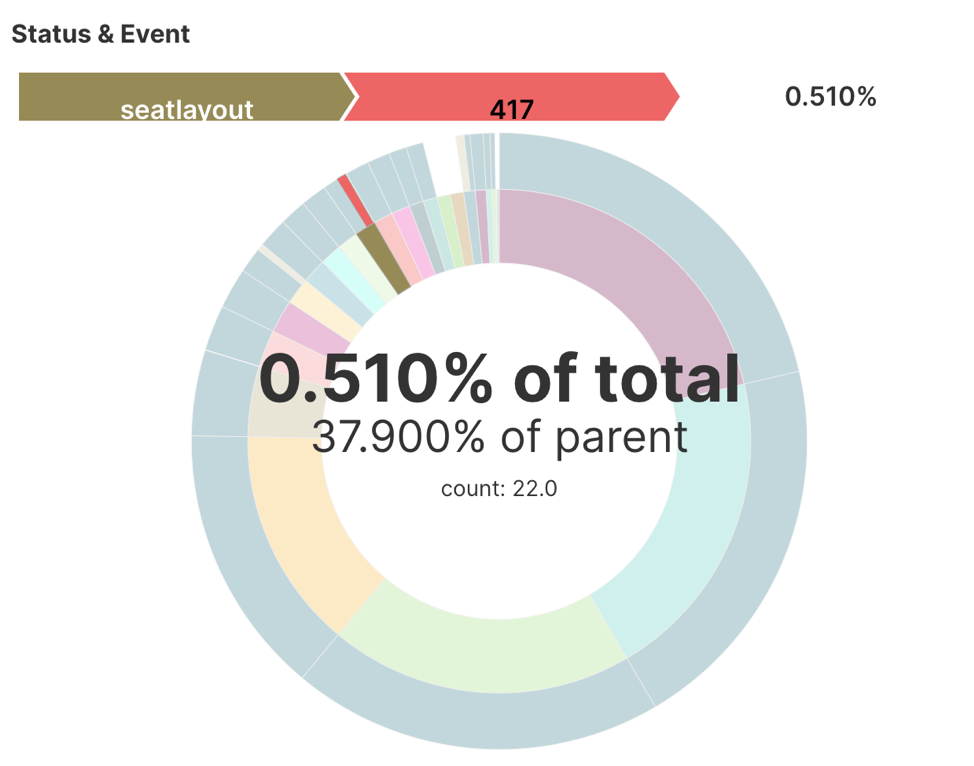
We use the sunburst chart to visualize the events that contribute to the overall 4xx and 5xx errors.
Conclusion
In this blog, we explored the use of different services to build a data lake, and why it is important to first build a data lake before warehousing the data, and some tips on how to increase performance of jobs and deduplication process.
Impact of Data Platform
Since the creation of the data platform, a number of things have happened:
- We have unified data across multiple transaction systems, AWS ELB logs, google analytics data etc. This makes it easier for data scientists to build models.
- Knowledge workers now have a single source to access all relevant information to make informed decisions that would steer the organization ahead.
- Applications no longer face SQL timeout exceptions as read or query times have reduced drastically.
- We have saved on cost as historic data which was stored in AWS RDS is now compressed and migrated to S3.
- Data warehousing becomes easier since data is flattened and stored in a common format at the lake.
- Real time data visualizations provide rich business insights to stakeholders.
Author
 Dweep Sharma enjoys designing systems with modern and relevant technologies. He pays close attention to system performance and efficiency and leverages his experience to help people support their innovations. Besides learning new problem solving methods he spends time swimming, gaming and traveling.